

Translate this page into:
Quantitative nitrate leaching relationship models based on nitrogen fertilisation and the intervals between maize irrigations in the salt-affected soil
⁎Corresponding author. melshikh@ksu.edu.sa (Mohamed S. Elshikh)
-
Received: ,
Accepted: ,
This article was originally published by Elsevier and was migrated to Scientific Scholar after the change of Publisher.
Abstract
Nitrate leaching from soil is a major environmental issue in modern agriculture as it can contaminate groundwater and degrade soil quality. Both nitrogen fertilization practices and irrigation methods contribute greatly to increased nitrate leaching. Researchers have developed quantitative models to predict nitrate leaching based on these farming techniques. This article examines new literature focusing on such models, particularly regarding salty soils used for maize cultivation. The study investigated the effects of nitrogen application rates and irrigation intervals on soil and groundwater properties in clay soils in Egypt. Results showed that nitrogen fertilization and irrigation frequency significantly impacted the water table depth, groundwater salt content, soil moisture levels, soil nitrogen availability, and groundwater nitrate levels. Correlations were discovered between nitrogen application, irrigation schedules, and various soil and groundwater parameters. The research emphasizes managing nitrogen rates and irrigation timings to maximize soil moisture while minimizing nitrate leaching during maize production. Proper agricultural management techniques are needed to reduce groundwater nitrate pollution risks. The review contributes to more sustainable farming practices.
Keywords
Nitrogen
Nitrate leaching
Pollution
Relationship models
Irrigation practices

1 Introduction
Nitrate leaching from agriculture pollutes soil and groundwater, threatening ecosystems and human health (Patel et al., 2022). Excess nitrogen fertilization (Lu et al., 2021) and inefficient irrigation (Rath et al., 2021) drive nitrate leaching. This paper reviews research on quantitative models predicting nitrate leaching from nitrogen and irrigation inputs for maize in saline soils, to mitigate nitrate pollution.
Several quantitative models have been developed to predict nitrate leaching from agricultural soils, incorporating factors like nitrogen fertilization and irrigation methods (Rath et al., 2021). Nitrogen fertilization is a major contributor to nitrate leaching by increasing plant-available nitrogen, which is readily leached by water (Wang et al., 2019). Irrigation techniques can influence nitrate leaching by regulating water drainage in the soil profile (Yang et al., 2020).
Maize (Zea mays L.) is one of the most widely cultivated cereal crops globally, planted on nearly 200 million hectares worldwide (USDA, 2017). However, saline soils present challenges for maize production, as salinity stress can reduce germination, plant growth, and yield (Jamil et al., 2011). Salt stress also alters maize nitrogen metabolism, uptake and utilization (Azizian and Sepaskhah, 2014). Developing nitrate leaching models for maize under salt-affected soil conditions is therefore critical to optimize nitrogen fertilizer rates and irrigation practices. Prior studies have examined nitrate leaching from maize under different irrigation regimes (Jia et al., 2014). However,
Nitrate leaching from agriculture contaminates water globally (Patel et al., 2022). Excess nitrogen and inefficient irrigation drive this issue (Yang et al., 2020). While quantitative models predict nitrate leaching from management practices exist (Díaz et al., 2012), models for maize in saline soils are lacking. This study addressed this gap by examining nitrate leaching correlations with nitrogen and irrigation inputs for maize in a salt-affected soil.
2 Materials and methods
2.1 Experimental site and climate
Two field studies were conducted on a clay soil in the experimental farm of El-Serw Agriculture Research Station, Agriculture Research Center, Damietta governorate (31°14N and 31°48E) in northern Egypt during the summer season (2020–2021). The soil had increased salinity issues from nearby drainage (Mosaad et al., 2020). The arid climate has hot dry summers and cool rainy winters (Messina, 2019). Meteorological measurements were taken during maize cultivation, including temperature, precipitation, pressure, humidity and wind speed (Table 2, Fig. 1). Soil physicochemical properties are shown in Table 1.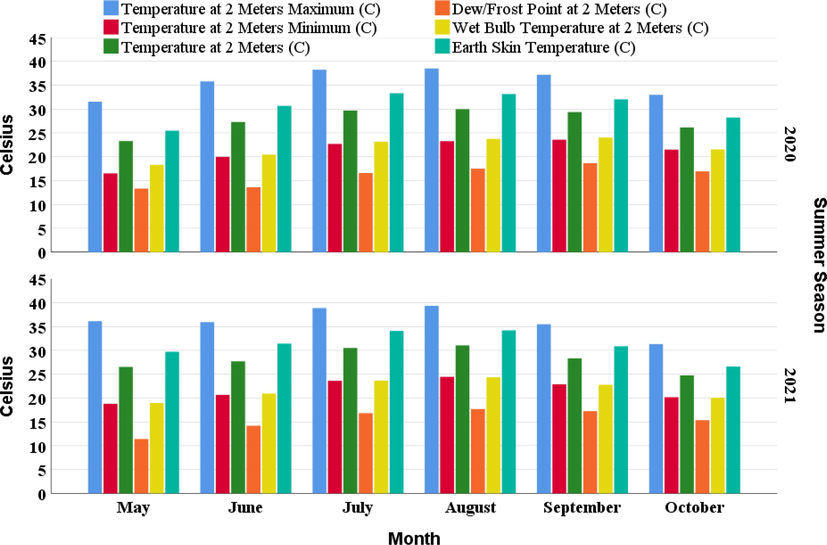
Maximum, Minimum and mean Temperature, Dew/Forest Point, Wet Bulb and Earth Skin Temperature (°C) of experimental site during summer seasons 2020 and 2021.
Properties
The first season
The second season
Physical properties:
Particle size distribution (%)
Coarse Sand
11.4
11.3
Fine Sand
13.9
13.7
Silt
16.5
16.7
Clay
58.2
58.3
Texture Class
Clayey
Clayey
Bulk density (g cm−3)
1.3
1.2
Field capacity (%)
40
41
Chemical analysis:
pH (1:2.5 Soil water suspension)
8.1
8.2
EC dSm−1 (1:5 Soil extract)
6.50
6.61
OM %
0.85
0.83
Soluble cations
(mmolc l−1)Ca++
10.14
9.99
Mg++
9.55
9.43
K+
0.37
0.36
Na+
39.25
37.18
Soluble anions
(mmolc l−1)CO3−
–
–
HCO3−
1.88
1.78
Cl−
38.77
33.94
SO4−
18.66
21.24
Available N (mg kg−1 soil)
36
37
Month
Precipitation Corrected (mm)
Surface Pressure (kPa)
Relative Humidity (%)
Wind Speed Range (m s−1)
Mean
Std. Dev.
Mean
Std. Dev.
Mean
Std. Dev.
Mean
Std. Dev.
2020
May
0.01
0.02
101.30
0.31
60.15
6.40
3.15
0.95
June
0.00
0.01
100.99
0.23
49.90
5.89
3.34
0.77
July
0.00
0.00
100.60
0.18
51.85
3.16
3.15
0.55
August
0.00
0.00
100.62
0.14
53.80
2.94
3.04
0.50
September
0.00
0.00
101.01
0.25
58.18
4.06
2.93
0.52
October
0.04
0.11
101.43
0.18
61.33
2.72
2.72
0.41
2021
May
0.00
0.00
101.15
0.17
47.44
6.04
3.07
0.69
June
0.00
0.00
101.14
0.26
49.66
3.36
3.20
0.50
July
0.00
0.00
100.63
0.18
50.15
3.53
3.15
0.79
August
0.03
0.06
100.73
0.18
51.94
4.77
2.70
0.62
September
0.05
0.11
101.09
0.18
55.27
3.79
3.26
0.49
October
0.18
0.61
101.47
0.28
59.66
4.16
2.89
0.54
2.2 Experimental treatments and crop management
A two-factor factorial experiment was conducted in a randomized complete block design with three replications. Factor A consisted of four nitrogen fertilisation levels. Factor B consisted of four irrigation intervals (3, 9, 15, and 20 days). The experiment investigated all 16 possible treatment combinations between the two factors. The experimental field was divided into blocks to account for variability in soil characteristics. Fertilisation and irrigation treatments were randomly allocated within each of the three blocks.
Maize was cultivated with four nitrogen fertilizer rates (0, 140, 280, 420 kg N/ha) applied before two irrigations. Surface irrigation met 100 % evapotranspiration needs on 16 m2 plots with four 4 m ridges. Maize variety 30K8 was planted May 10th both seasons, with grains 25 cm apart and thinned. Recommended practices were followed and maize harvested in early October.
2.3 Water table fluctuations
The plane work was designed to place observation wells at each treatment to monitor the fluctuation of the water table. During the irrigation interval, the ground water table was measured in observation wells (19 mm diameter and 2 m length) using a sounder consisting of a 1.25 cm diameter copper tube and 5 cm length coupled with a calibrated steel tape (Karklins and Lenon, 1996).
2.4 Soil samples
Soil samples were obtained from the soil's surface (0–30 cm). Soil samples were obtained for chemical and physical property analysis. Table 1 shows how soil samples were evaluated using recommended procedures. To measure Available nitrogen in the soil (mg kg−1), the Kjeldahl method was employed (Hesse, 1971). Also, soil moisture content was estimated using an irrigation interval (after 3, 9, 15, and 20 days of irrigation).
2.5 Water samples
Groundwater was sampled at 3, 9, 15, and 20 days after irrigation to analyze electrical conductivity (ECw) and nitrate concentration. ECw was measured with a conductivity meter calibrated using KCl solutions. Nitrate was determined spectrophotometrically by reacting samples with brucine sulfate and sulfuric acid to form a complex extracted into amyl acetate and measured at 405 nm, calibrated against potassium nitrate standards (Sparks et al., 2020).
2.6 Data statistical analysis
The data was statistically analyzed using ANOVA in SPSS (v. 26, IBM Inc., Chicago, II, USA) to determine the effect of factors and their interactions on measured parameters (Snedecor and Cochran, 1989). Means were compared by Tukey's HSD test at P ≤ 0.05. Standard error was calculated. Stepwise multiple regression modeling was used to evaluate the relationship between nitrogen fertilization, irrigation intervals as independent variables, and nitrate concentration in groundwater as the continuous dependent variable (Eberly, 2007).
3 Results
3.1 Ground water and soil properties
The influence of mineral nitrogen fertiliser levels on several ground water characteristics was substantial at 5 % during the time period between irrigations. This relationship is depicted in the following illustrations:
3.1.1 Depth of water table (cm)
Fig. 2 displays the effect of nitrogen fertiliser levels on the depth of the water table between irrigations when maize is planted. The greatest depth of the water table was when 420 kg N ha−1 was applied after 20 days of irrigation, which indicated an increase in depth of the water table with increasing rates of nitrogen fertilisation, as is the case when prolonging the interval between irrigations.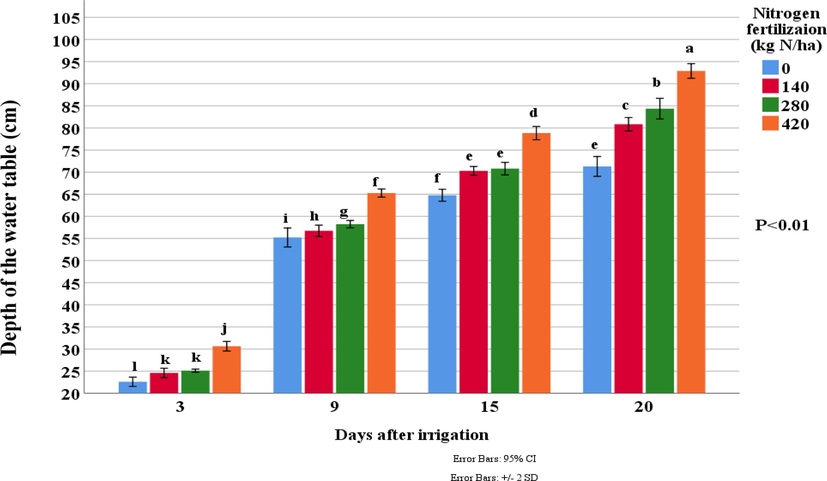
Effect of nitrogen fertiliser levels on the depth of the water table (cm) between irrigations.
3.1.2 Ecw of ground water (ds m−1)
Fig. 3 shows how nitrogen fertilisation levels during maize agriculture impact the electrical conductivity (ECw) of ground water between irrigations. Where it was established that, in contrast to the scenario when increasing the period between irrigations, the ECw of the ground water fell with increasing nitrogen fertilisation rates, and it was lower than the ECw of the ground water after three days of irrigation when using 420 kg N ha−1.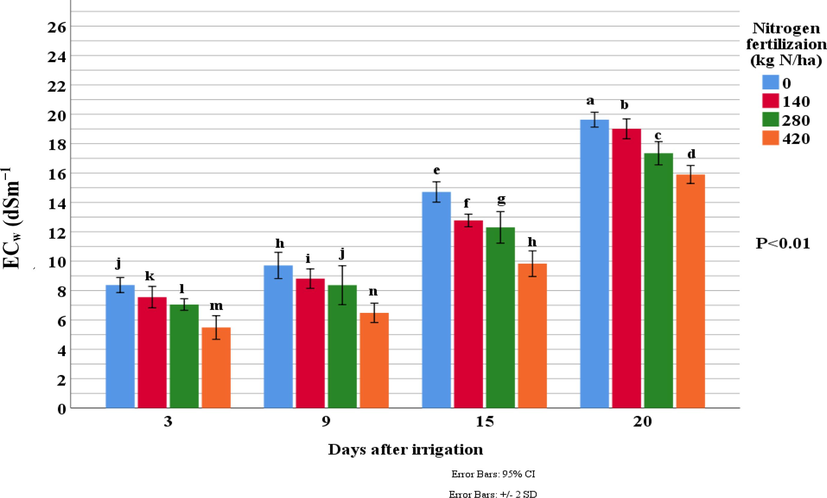
Effect of nitrogen fertiliser levels on the ECw of ground water (ds m−1) between irrigations.
3.1.3 Soil moisture content (%)
Fig. 4 shows how nitrogen fertilisation levels during corn cultivation alter soil moisture content between irrigations. The highest soil moisture content was when using 0 kg N ha−1 after 3 days of irrigation, illustrating that raising nitrogen fertiliser rates, as well as increasing the duration between irrigations, decreases soil moisture content.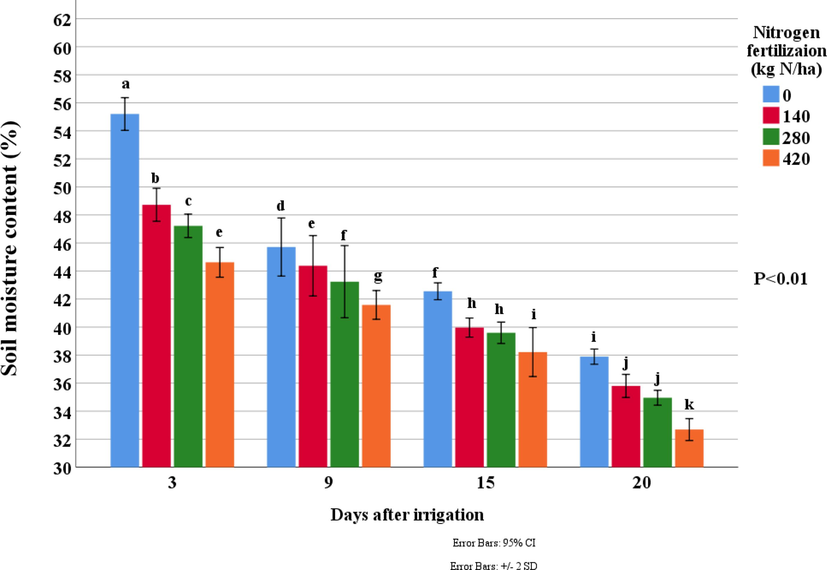
Effect of nitrogen fertiliser levels on the soil moisture content (%) between irrigations.
Furthermore, the graph shows that the time between irrigations influences soil moisture content, with soil moisture content decreasing as the time between irrigations increases. This discovery is also consistent with earlier research, which shows that longer watering intervals cause increased water stress in plants, resulting in lower soil moisture content.
3.1.4 Soil content of available nitrogen (mg kg−1)
Increasing mineral nitrogen fertilization from 0 to 420 kg N/ha significantly increased plant-available soil nitrogen after the first and second irrigations (Fig. 5). The highest soil nitrogen was with 140, 280, 420 kg N/ha after the second irrigation, while no fertilization had higher levels after the first. Soil nitrogen availability declined slightly from the first to second irrigation, and increased slightly with longer intervals between irrigations.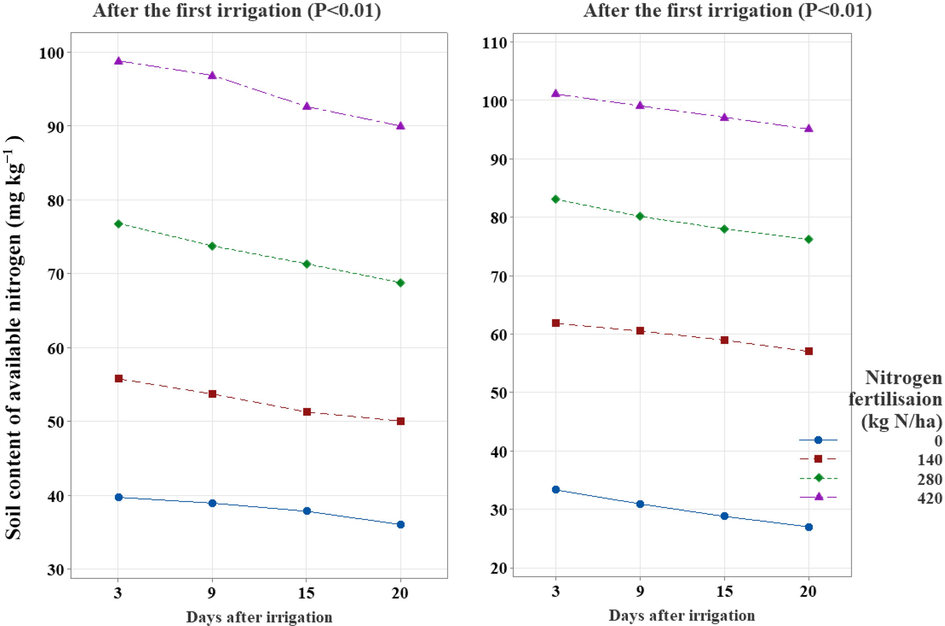
Effect of mineral nitrogen fertilisation levels during maize production, on soil content of available nitrogen (mg kg−1) after the first and second irrigations.
An important issue to take into account for increasing crop yield and minimizing environmental effects is the effect of mineral nitrogen fertiliser levels during the development of maize on soil nitrogen availability. Fig. 5 shows how different nitrogen fertilisation rates—from 0 to 420 kg N ha−1 affect the amount of available nitrogen in the soil for growing maize.
3.1.5 Ground water content of nitrate (mg kg−1)
Fig. 6 shows mineral nitrogen fertilization from 0 to 420 kg N/ha significantly increased groundwater nitrate content after the first and second irrigations of maize cultivation. Nitrate levels rose with increasing fertilization rates. Nitrate also increased at all fertilization levels after the second irrigation compared to the first. Longer intervals between irrigations significantly decreased groundwater nitrate content.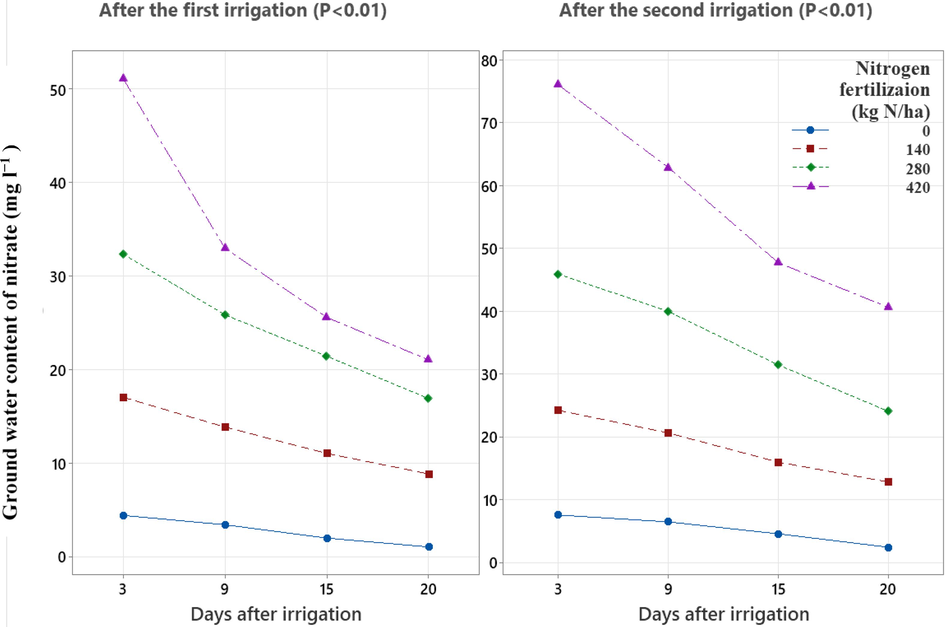
Effect of mineral nitrogen fertilisation levels during maize production, on ground water content of nitrate (mg l−1) after the first and second irrigations.
3.2 Correlation of groundwater and soil properties as affected by nitrogen fertilisation and the intervals between maize irrigations
Table 3 shows correlations between nitrogen fertilization rates, irrigation intervals, and soil/groundwater parameters. Higher nitrogen rates correlated significantly and positively with greater groundwater nitrate and soil nitrogen levels. Longer intervals between irrigations correlated significantly and positively with deeper water tables, higher groundwater salt levels, but negatively with soil moisture content. *Correlation is significant at the 0.05 level (2-tailed). **Correlation is significant at the 0.01 level (2-tailed).
Treatments
Water table depth(cm)
Ecw
(dsm−1)Moisture content (%)
Nitrate in groundwater
(mg L−1)Available nitrogen in the soil
(mg kg−1)
After the 1st IRR.
After the 2nd IRR.
After the 1st IRR.
After the 2nd IRR.
Nitrogen fertilization
0.214
−0.295
−0.384*
0.862**
0.912**
0.988**
0.989**
Days after irrigation
0.939**
0.905**
−0.892**
−0.401*
−0.336
−0.116
−0.088
3.3 Coefficients of stander multiple regressions of nitrate concentration in groundwater
Table 4 show multiple regression coefficients for quantitatively predicting groundwater nitrate levels from nitrogen rates and irrigation intervals. The second model with significant coefficients for nitrogen rate, interval between irrigations, and the constant was used to forecast nitrate levels after the first, and second irrigations and on average, demonstrated the ability to quantitatively predict groundwater nitrate concentrations.
-
The concentration of nitrates in the ground water = 12.578 + (0.072 × the amount of nitrogen fertiliser) + (−0.825 × the number of days between waterings)
-
The concentration of nitrates in the ground water = 16.253 + (0.122 × the amount of nitrogen fertiliser) + (−1.106 × the number of days between waterings)
-
The concentration of nitrates in the ground water = 14.416 + (0.097 × the amount of nitrogen fertiliser) + (−0.966 × the number of days between waterings)
| Model | Unstandardized Coefficients | P value | P value of the Estimate | R2 | Std. E. of the Estimate | ||
|---|---|---|---|---|---|---|---|
| B | Std. E. | ||||||
| The 1st irrigation | |||||||
| 1 | (Constant) | 2.878 | 2.032 | ns | P < 0.01 | 0.862 | 6.868 |
| Nitrogen fertilization (kg N ha−1) | 0.072 | 0.008 | P < 0.01 | ||||
| 2 | (Constant) | 12.578 | 1.877 | P < 0.01 | P < 0.01 | 0.951 | 4.266 |
| Nitrogen fertilization (kg N ha−1) | 0.072 | 0.005 | P < 0.01 | ||||
| The intervals between maize irrigations (day) | −0.825 | 0.118 | P < 0.01 | ||||
| The 2nd irrigation | |||||||
| 1 | (Constant) | 3.262 | 2.637 | ns | P < 0.01 | 0.912 | 8.913 |
| Nitrogen fertilization (kg N ha−1) | 0.122 | 0.010 | P < 0.01 | ||||
| 2 | (Constant) | 16.253 | 2.299 | P < 0.01 | P < 0.01 | 0.972 | 5.225 |
| Nitrogen fertilization (kg N ha−1) | 0.122 | 0.006 | P < 0.01 | ||||
| The intervals between maize irrigations (day) | −1.106 | 0.145 | P < 0.01 | ||||
| The pooled irrigation | |||||||
| 1 | (Constant) | 3.070 | 2.291 | ns | P < 0.01 | 0.805 | 7.744 |
| Nitrogen fertilization (kg N ha−1) | 0.097 | 0.009 | P < 0.01 | ||||
| 2 | (Constant) | 14.416 | 1.976 | P < 0.01 | P < 0.01 | 0.937 | 4.493 |
| Nitrogen fertilization (kg N ha−1) | 0.097 | 0.005 | P < 0.01 | ||||
| The intervals between maize irrigations (day) | −0.966 | 0.125 | P < 0.01 | ||||
In the same way that the first equation displays the nitrate concentration in the ground water following the first irrigation, the second equation displays the nitrate concentration in the ground water following the second irrigation, and the third equation displays the average nitrate concentration in the ground water following each irrigation.
4 Discussion
Longer irrigation intervals increase water table depth due to worsened drought effects. Also, higher nitrogen fertilization increases plant growth and water consumption, further raising the water table depth. Water table depth indicates soil moisture; positive values show the water table below ground, negative above. Soil moisture regulates peat carbon loss by controlling oxygen levels that affect microbial breakdown of peat (Teh et al., 2005).
While lengthening the time between irrigations raises the salinity of the groundwater, it also raises the concentration of salts, which raises the level of electrical conductivity. Enhanced nitrogen fertilisation, on the other hand, will lower the level of electrical conductivity in groundwater. This is due to enhanced soil fertility, which will distribute the biological content of the soil, which may operate to lower the level of electrical conductivity. Soil pH, EC, and nutrient availability are all related (Arshad and Martin, 2002). However, as Shen et al. point out, high nitrogen fertilisation rates, particularly in intensively managed agricultural areas, have resulted in secondary salinization and acidification of soil (Shen et al., 2016).
Fig. 5 shows that increasing nitrogen fertiliser rates from 0 to 420 kg N ha−1 resulted in a considerable increase in the quantity of available nitrogen in the soil following the first and second irrigations. This discovery is consistent with earlier research, which has demonstrated that nitrogen is a critical nutrient that can have a major impact on plant development and productivity (Mosaad et al., 2020).
The effect of nitrogen fertilisation on nitrate concentrations in groundwater during maize cultivation is an urgent issue that must be addressed. Fig. 6 depicts the effect of various quantities of mineral nitrogen fertiliser on nitrate concentrations in groundwater over two growing seasons. The data showed that mineral nitrogen fertilisation had a substantial effect on the concentration of nitrate in groundwater after the first and second irrigations. The results revealed that increasing nitrogen fertilisation rates from 0 to 420 kg n/ha resulted in an increase in nitrate concentration in groundwater. After the second irrigation, the amount of nitrate in the groundwater rose when utilizing 0, 140, 280, and 420 kg N ha−1. These findings are consistent with prior research that found a link between nitrogen fertilisation rates and nitrate leaking into groundwater (Minikaev et al., 2021). It is worth mentioning, however, that the concentration of nitrate in groundwater was significantly lower when the intervals between irrigations were greater. This is consistent with prior research that has shown that extending irrigation intervals reduces nitrate concentrations in groundwater (Abbasi and Sepaskhah, 2023). Adopting adequate irrigation measures, in addition to optimizing nitrogen fertilisation levels, can assist decrease nitrate leaking into groundwater.
Table 3 links high nitrogen fertilizer rates to increased accessible soil nitrogen (positive; Marsala et al., 2021; Minikaev et al., 2021) and groundwater nitrate (positive), but decreased soil moisture (negative; Si et al., 2020). It also reveals longer irrigation intervals increase soil moisture, groundwater depth, and groundwater EC (all positive; Gu et al., 2019), but interestingly decrease nitrate concentration after the first irrigation (negative; Zhang et al., 2020), possibly due to dilution.
This study used regression analysis to predict nitrate levels in groundwater after irrigation. Nitrogen fertilizer amount and time between irrigations significantly impacted nitrate levels. Developed models can help farmers manage these factors to minimize nitrate contamination. However, the models may not be universally applicable and further research is needed in diverse regions. Overall, careful fertilizer and irrigation practices are crucial to protect water quality.
5 Conclusions
The present study demonstrated that nitrogen fertilisation rates and irrigation intervals significantly influence groundwater and soil properties, as well as nitrate leaching, in maize grown in salt-affected soils. Key findings showed increased water table depth, decreased soil moisture, and increased nitrate leaching with higher nitrogen fertilisation rates. Extending irrigation intervals also impacted groundwater and soil parameters. Quantitative models developed in this study provide a useful tool for predicting nitrate leaching based on nitrogen fertilisation and irrigation practices. The models can inform best practices for minimizing nitrate pollution risks. This highlights the importance of an integrated approach combining controlled nitrogen fertilisation and optimized irrigation scheduling when cultivating maize in saline environments.
CRediT authorship contribution statement
Ibrahim Mosaad (IM), Rania El-Samit (RE), Abd El-Zaher M. A. Mustafa (AM) and Mohamed S. Elshikh (ME) contributed to the study conception and design. IM and RE conducted the experiments and analyzed the data together with Ali Seadh (AS) and Ahmed S. Abdelhamied (AA). All authors contributed to the writing of the manuscript with IM as the lead. All authors reviewed and approved the final manuscript.
Acknowledgements
For their cooperation with field experiments and laboratory research, the staff of the El-Serw Agricultural Research Station deserve our gratitude. For giving financial and moral support for this research, we also recognize the Soil, Water, and Environment Research Institute of the Agricultural Research Center and the Soil Science Department at Damietta University's Faculty of Agriculture, Egypt. The authors extend their appreciation to the Researchers supporting project number (RSP2024R941), King Saud University, Riyadh, Saudi Arabia.
Author contribution
Ibrahim Mosaad (IM), Rania El-Samit (RE), Abd El-Zaher M. A. Mustafa (AM) and Mohamed S. Elshikh (ME) contributed to the study conception and design. IM and RE conducted the experiments and analyzed the data together with Ali Seadh (AS) and Ahmed S. Abdelhamied (AA). All authors contributed to the writing of the manuscript with IM as the lead. All authors reviewed and approved the final manuscript.
Statements and declarations
On behalf of all authors, the corresponding author states that there is no conflict of interest.
Declaration of competing interest
The authors declare that they have no known competing financial interests or personal relationships that could have appeared to influence the work reported in this paper.
References
- Nitrogen leaching and groundwater N contamination risk in saffron/wheat intercropping under different irrigation and soil fertilizers regimes. Sci. Rep.. 2023;13:6587.
- [Google Scholar]
- Identifying critical limits for soil quality indicators in agro-ecosystems. Agr. Ecosyst. Environ.. 2002;88:153-160.
- [CrossRef] [Google Scholar]
- Maize response to different water, salinity and nitrogen levels: agronomic behavior. Int. J. Plant Prod.. 2014;8:107-130.
- [Google Scholar]
- Agricultural pollutant removal by constructed wetlands: Implications for water management and design. Agric. Water Manag.. 2012;104:171-183.
- [CrossRef] [Google Scholar]
- Multiple Linear Regression BT - Topics in Biostatistics. Totowa, NJ: Humana Press; 2007. p. :165-187.
- [CrossRef]
- Hesse, P.R., 1971. A textbook of soil chemical analysis.
- Gene expression profiling of plants under salt stress. CRC. Crit. Rev. Plant Sci.. 2011;30:435-458.
- [Google Scholar]
- Effect of different nitrogen and irrigation treatments on yield and nitrate leaching of summer maize (Zea mays L.) under lysimeter conditions. Agric. Water Manag.. 2014;137:92-103.
- [Google Scholar]
- Groundwater Sampling Desk Reference. Wisconsin Department of Natural Resources, Bureau of Drinking Water and …; 1996.
- Nitrogen fertilizer management effects on soil nitrate leaching, grain yield and economic benefit of summer maize in Northwest China. Agric. Water Manag.. 2021;247:106739
- [Google Scholar]
- Messina, P., 2019. Koppen climate classification system. doi: 10.1036/1097-8542.800280.
- Effect of increasing nitrogen fertilization on soil nitrous oxide emissions and nitrate leaching in a young date palm (Phoenix dactylifera L., cv. Medjool) orchard. Agr. Ecosyst. Environ.. 2021;319:107569
- [Google Scholar]
- Effect of exogenous proline application on maize yield and the optimum rate of mineral nitrogen under salinity stress. J. Plant Nutr.. 2020;43:354-370.
- [CrossRef] [Google Scholar]
- Nitrate contamination in water resources, human health risks and its remediation through adsorption: a focused review. Environ. Sci. Pollut. Res.. 2022;29:69137-69152.
- [CrossRef] [Google Scholar]
- Quantifying nitrate leaching to groundwater from a corn-peanut rotation under a variety of irrigation and nutrient management practices in the Suwannee River Basin, Florida. Agric. Water Manag.. 2021;246:106634
- [Google Scholar]
- Bacterial community composition is shaped by soil secondary salinization and acidification brought on by high nitrogen fertilization rates. Appl. Soil Ecol.. 2016;108:76-83.
- [CrossRef] [Google Scholar]
- Statistical Methods (Eighth ed.). Ames: Iowa State University Press; 1989.
- Methods of Soil Analysis, Part 3: Chemical Methods. John Wiley & Sons; 2020.
- Oxygen effects on methane production and oxidation in humid tropical forest soils. Glob. Chang. Biol.. 2005;11:1283-1297.
- [Google Scholar]
- USDA, F.A.S., 2017. World agricultural production. Bange, G., USDA World Agric. Outlook Board 1–9.
- Estimating soil nitrate leaching of nitrogen fertilizer from global meta-analysis. Sci. Total Environ.. 2019;657:96-102.
- [Google Scholar]
- Minimizing soil nitrogen leaching by changing furrow irrigation into sprinkler fertigation in potato fields in the Northwestern China Plain. Water. 2020;12:2229.
- [Google Scholar]


