

Translate this page into:
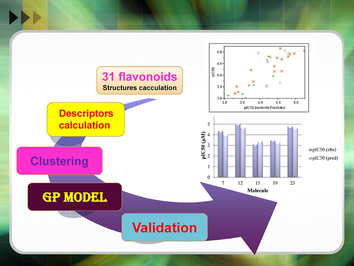
QSAR modeling using the Gaussian process applied for a series of flavonoids as potential antioxidants
⁎Corresponding authors. s.belaidi@univ-biskra.dz (Salah Belaidi), mmogren@ksu.edu.sa (Muneerah Mogren AlMogren),
-
Received: ,
Accepted: ,
This article was originally published by Elsevier and was migrated to Scientific Scholar after the change of Publisher.
Peer review under responsibility of King Saud University.
Abstract
Abstract
Flavonoids have been the subject of several studies for many years, particularly due to their high antioxidant activity. However, understanding the structure–activity relationships (SAR) of flavonoids is crucial for optimizing their properties and designing new derivatives with enhanced activities. In this study, we employed Quantitative Structure-Activity Relationship (QSAR) methods to analyze a group of 31 flavonoids with known biological activity. The Gaussian program was used to calculate the molecular descriptors. Using statistical modeling techniques, such as multiple linear regression, we developed QSAR models to correlate the molecular descriptors with the activity values. The models were rigorously validated using appropriate procedures to ensure their reliability and predictive power with a correlation coefficient R2pred = 0.86, and an absolute average relative error (AARE pred) of 0.06 for the test set.
Keywords
Flavonoids
Antioxidant
QSAR
Gaussian process
PCA
HCA

1 Introduction
Chemical pesticides are used to combat pathogens in plants. Whereas, plants can establish their means of defense through the synthesis of secondary metabolites such as alkaloids, flavonoids, andphenolics (Zaynab et al.,2018).
The structure of flavonoids is based on a flavan core, consisting of two benzene rings and a pyran ring(Dragan et al., 2007).The majority of flavonoids are classified as a function of saturation and oxidation of the pyran ring; their major sub-classes are flavanols, flavonols, flavanonols, flavanones, flavones, isoflavones, chalcones, and anthocyanidins (Banjarnahor et al., 2014; Dragan et al., 2007)(Fig. 1).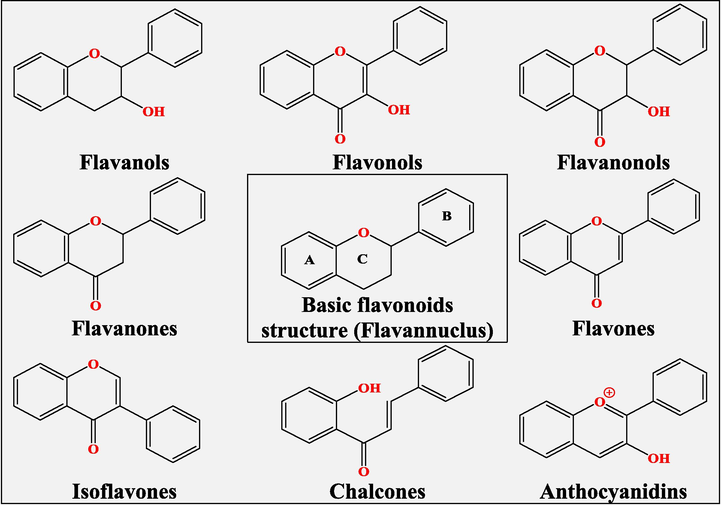
Sub-classes of flavonoids (Banjarnahor et al., 2014; Dragan et al., 2007).
Flavonoids are found mainly in the pigments of plants, that is why a colored plate is a very healthy plate. They are abundant in spinach, turmeric, apples, carrots, green beans, onion, and garlic(Murphy et al., 2019).Honey also contains large varieties of flavonoid glycosides (Truchadoet al., 2011).
Flavonoids have several biological activities, theyare used as anticancer (Veeramuthu et al., 2017), antioxidant (Daset al., 2014), antileishmanial (Tasdemir et al., 2006), anti-inflammatory(Chenet al., 2017), and antiaging compounds(Lumbinyet al.,2013). However, current researches are very much interested in antioxidant activity of flavonoids (Kruzlicova et al., 2012) since oxidative stress is strongly related to several diseases (Peeret al., 2006). Antioxidants act principally by delaying,preventing or suppressing harmful effects on a target. Here are the main modes of action of flavonoids:
-
The majority of flavonoids have a potential for chelating trace metal ions such as Fe2 + and Cu2 + that play a decisive role in the formation of free radicals (Maleśevet al., 2007),
-
The radical molecule will receive the hydrogen atom from the labile hydroxyl group of flavonoids, and then a stabilized flavonoid phenoxy radical will be generated (Bubols et al., 2013).
-
Flavonoids may act as an intracellular antioxidants by inhibiting enzymes generating free radicals such as lipoxygenase, cyclooxygenase, mitochondrial succinoxidase, and nicotinamide adenine dinucleotide phosphate hydrogen(NADPH) oxidase.
Another potential mechanism by which flavonoids apply their antioxidant activities is the induction of internal antioxidant enzymes(Procházková et al., 2011).
There are several in silico methods to assess biological activity and establish a qualitative or quantitative relationship between structure and activity. Among these methods, we cite Drug-likeness scoring, the QSAR method, molecular docking, and finally molecular dynamics(Ansaria et al., 2022; Sarkaret al., 2023, (M. Lahyaoui et al. 2023; Mouad Lahyaoui et al. 2023)).In this study, we have chosen to elaborate a quantitative structure–antioxidant activity relationship (QSAR)using astatistical method called the Gaussian process (GP).The main advantage of this methodcompared to other techniques currently used in QSAR studies is that it does not increase the complexity of learning tests[18] (Dallaire et al., 2010).
The supervised learning method has the particularity of being a probability distribution in the space of functions. This property is principally interesting because it opens the door to a Bayesian treatment of uncertainty on unknown functions.
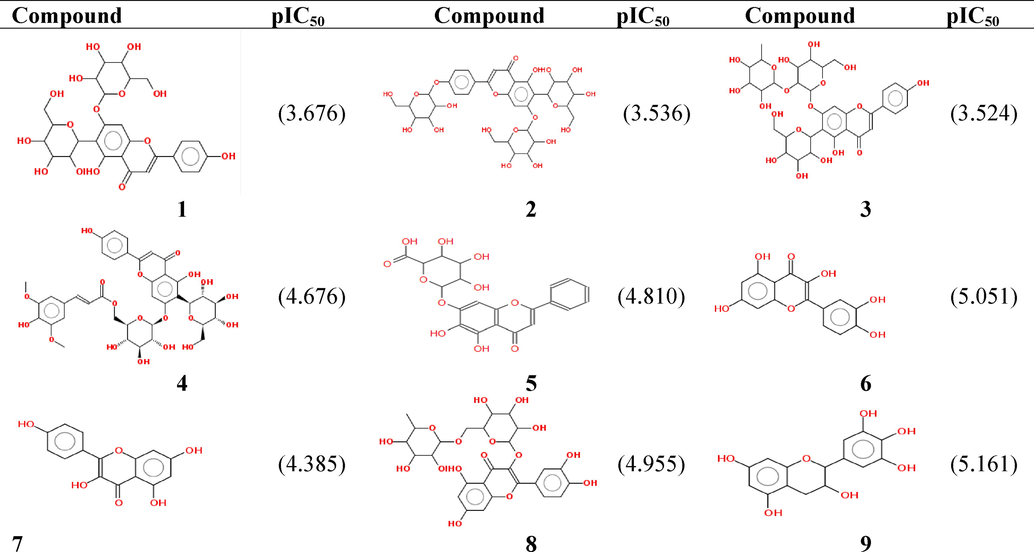
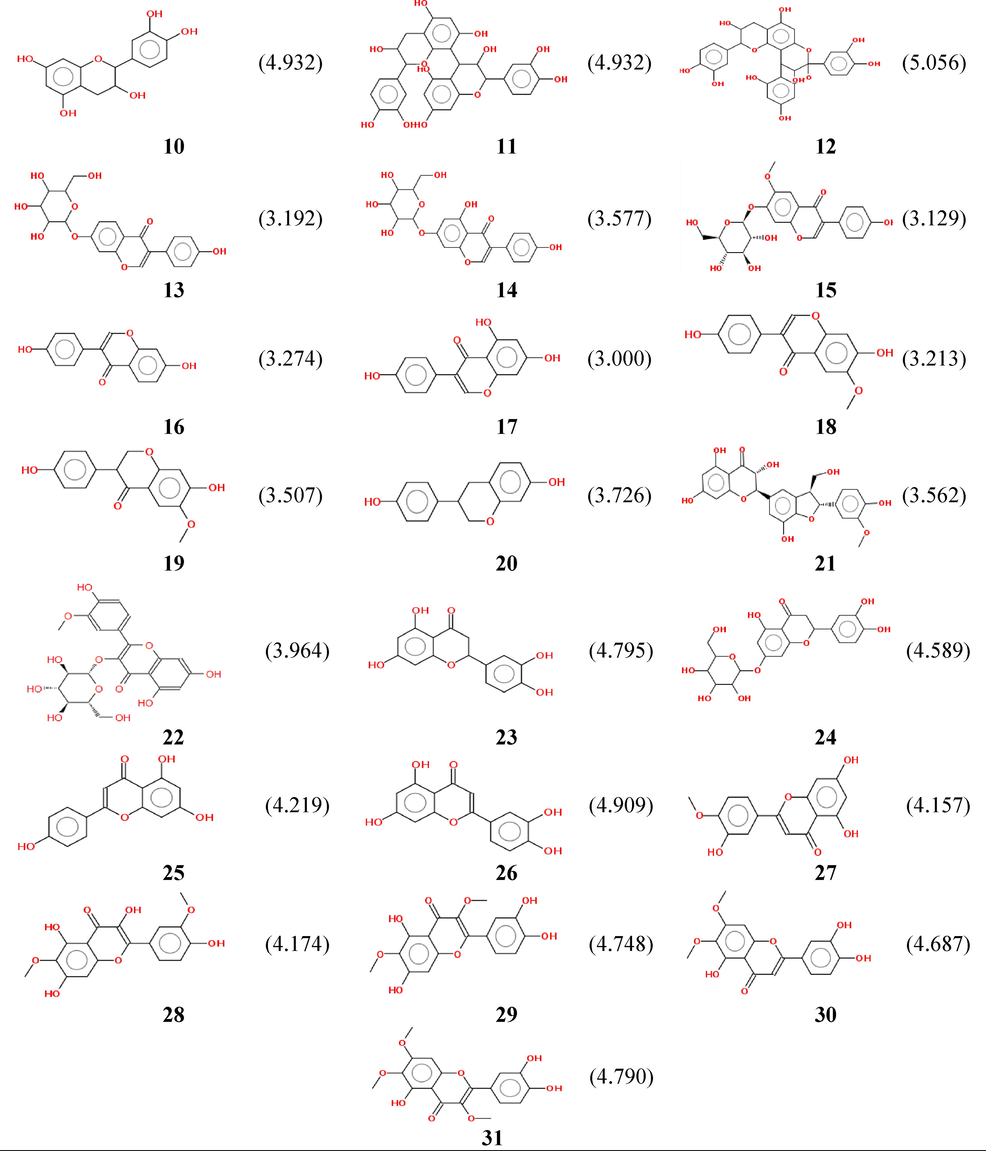
The antioxidant activity of the studied compounds (Table 1) was measured by using the 2, 2-diphenyl 1-picrylhydrazyl (DPPH) radical scavenging method (Okawa et al., 2001; Hu et al., 2017).
2 Computational methods
2.1 Descriptors calculation
Our approach consists in performing calculations on the studied series, we have demonstrated that this approach provides a good balance between precision and calculation time when describing the properties of flavonoids. (Al Mogren et al., 2020;Almi et al., 2015; Belaidi et al., 2013).
The molecular structures have been pre-optimized by molecular mechanics (Kerassa et al., 2016), with a force field (MM + ), the latter is an extension of MM2, which was designed by Allingerand coworkersand was further optimizedby the PM3 semi-empirical method implanted in the HyperChem, release 8.0.8 (HyperChem 8, 2009).In addition, we have reoptimized the structures with the DFT method in order to calculate quantum descriptors used in the QSAR studies.
The molecular descriptor is either the outcome of somestandardized experimentsor a mathematical technique that transforms the encoded chemical data that symbolically represents the molecule into a useful number.
Establishing models using a mathematical relationship between the structures of molecules and biological activity (quantitative structure–activity relationships, QSARs) is important for analyzing chemical properties.
We have defined and calculated the following molecular descriptors; heat of formation (HF), energy of hydration (HE), molar weight (MW), coefficient ofoctanol-water partition (log P), and volume (V).
After comparing the calculated data with the experimental parameters of quercetin structure, we found that the Density Functional Theory (DFT) method at the three parameter Becke, Lee-Yang-Parr (B3-LYP) functional including the 6-31G basis sets is the most suitable method to predict the structure equilibrium of quercetin. To calculate the quantum descriptors of the flavonoids derivatives, as the dipolar moment (DM), the lowest unoccupied molecular orbital (LUMO), and the highest occupied molecular orbital (HOMO), we used Gaussian program 09 (Frisch et al., 2009) at B3LYP/6-31G level.
Finally, MarvinSketch software (MarvinSketch, Chemaxon, 2020, https://www.chemaxon.com)was used to calculate the hydrogen bond donors (HD), the Hydrogen bond acceptors (HA), the topological polar surface (TPSA), and the number of rotatable bonds (RB).
2.2 Statistical analysis
2.2.1 Principal component analysis(PCA)
The principal component analysis (PCA) is a statistical technique,which is very useful when there is a sum of quantitative data to be processed and interpreted(Boudergua, 2020; Jolliffe, 2002; Nielsen, 2016).It is used to describe a dataset with many individuals and quantitative variables. The analysis enables the extractionof pertinent information and synthesizes it into principal components or new axes to describe the dataset.
When representing a dataset variation, it is preferable to lower the number of original variables (Granato et al., 2018); PCA is based on the principle of maximizing the value of the variance of the combinations between variables of a set of data. In fact, PCA refers to get the eigenvectors and eigenvalues of the covariance matrix (Gatignon, 2014).
Thus, the aim of this procedure is to project the dataset into a new space where its components aredecorrelatedas possible. The number of the PCs is determined using various criterions,as:
-
Selected PCs cover 80% or 90% of the data variation (Jolliffe, 2002).
-
Kaiser’s rule (Kaiser, 1960) suggests preserving only PCs with variances greater than 1.
-
The number of PCs represents the elbow point in the scree plot.
PCA is considerably used as one of cluster analysis techniques requiring a measure of similarity between each pair of observations (Jolliffe, 2002).
2.2.2 Hierarchical cluster analysis (HCA)
Hierarchical cluster analysis (HCA)is one of the most common multivariate techniques of data analysis. It helps to simplify the data on the base of its clusters and models (Ferreira,2002). The hierarchical clustering assembles the samples into nested groups (Dash et al., 2003). It is based on the rule of similarity between samples (Ferreira, 2002).
2.2.3 Gaussian process (GP)
Due to its notable theoretical properties, Gaussian probability distribution is one of the most commonly used probability laws in applied sciences. A Gaussian process (GP)is resulting from Gaussian probability distribution with the difference that Gaussian probability describes and studies random variables, but the Gaussian process deals with a family of random variables.
GP is a nonparametric Bayesian simulation technique, so it is a stochastic method (PoloskovandSoize, 2018), such that every finite number of random variables collections has a joint Gaussian distribution with a covariance function (K) and a mean function (µ). Generally, µ equals zero and K is a kernel matrix (with hyper-parameter θ). The hyperparameter is optimized during the training step (He et al., 2013).GP is used in many applications as regression, classification as well as clustering (Boudergua, 2020;Rasmussen and Williams, 2006).
Since the JMP 8.0.2 software (JMP 8.0.2, SAS Institute Inc., 2009) allows users to research and explore data, we choose it to perform PCA, HCA, and GP.
3 Results, analysis, and discussion
The main goal of our project consists of carrying out a mathematical analysis based on the following methods:PCA, HCA, and GP. We have chosen several steps to accomplish this project as follows:
3.1 Benchmarks on quercetin
Quercetin (Fig. 2), also called vitamin P, is considered the most beneficial flavonoid for human health.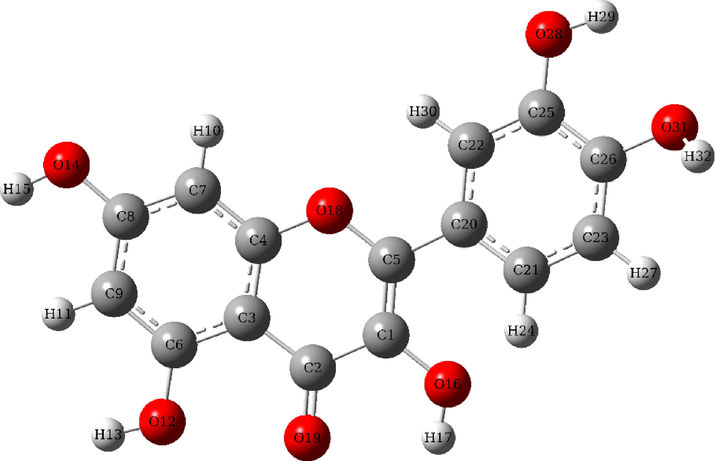
3D Structure of Quercetin.
In this part, we approached our research by optimizing the equilibrium structure of quercetin, takenas an analogy to the studied data set, in order to define the most appropriate prediction method for the rest of our calculations.
By comparing experimental findings with the computational approach from the data listed in Table 2, we noticed that the DFT method at the level of the B3LYP hybrid functional and the HF method both show a good correlation with the experimental values, but the first is better, so we applied this method to calculate the quantum descriptors.
Bond length (angstrom)
Angle(degree)
HF
(6-31G)
DFT/B3LYP
(6-31G)
Exp.a
HF
(6-31G)
DFT/B3LYP
(6-31G)
Exp.a
(1,2)
1.38
1.40
1.36
(1–2-3)
118.21
118.17
121.26
(1,6)
1.36
1.39
1.37
(1–2-11)
112.13
112.54
110.97
(2,3)
1.34
1.37
1.36
(3–2-11)
129.66
129.29
127.75
(2,11)
1.46
1.46
1.48
(2–3-18)
122.38
122.86
122.25
(3,4)
1.45
1.44
1.45
(4–3-18)
115.60
114.93
117.34
(3,18)
1.37
1.38
1.35
(3–4-5)
117.28
117.68
116.79
(4,5)
1.44
1.43
1.42
(5–4-17)
123.64
123.79
122.82
(4,17)
1.25
1.29
1.27
(4–5-10)
122.76
121.99
122.83
(5,6)
1.40
1.41
1.39
(6–5-10)
118.12
118.43
116.96
(5,10)
1.41
1.42
1.42
(1–6-7)
117.96
117.82
116.79
(6,7)
1.38
1.39
1.40
(5–6-7)
122.70
122.44
122.79
(7,8)
1.39
1.40
1.39
(6–7-8)
117.47
117.53
117.08
(7,23)
1.07
1.68
1.02
(6–7-8)
117.47
117.53
117.08
(8,9)
1.39
1.40
1.40
(8–7-23)
120.92
120.79
122.71
(8,20)
1.36
1.38
1.36
(7–8-20)
116.36
116.07
117.66
(9,10)
1.38
1.39
1.36
(9–8-20)
121.53
121.70
119.84
(9,24)
1.07
1.08
1.01
(8–9-24)
121.88
121.82
120.44
(10,19)
1.35
1.36
1.38
(5–10-9)
120.26
120.03
122.14
(11,12)
1.40
1.41
1.39
(5–10-19)
121.67
120.42
118.45
(11,16)
1.40
1.42
1.40
(9–10-19)
118.07
119.55
119.37
(12,13)
1.39
1.40
1.39
(2–11-12)
122.19
121.81
121.34
(12,25)
1.07
1.08
1.00
(2–11-16)
118.97
119.38
119.34
(13,14)
1.38
1.39
1.39
(11–12-13)
120.42
120.54
121.02
(13,26)
1.07
1.08
1.01
(11–12-25)
119.98
119.53
119.35
(14,15)
1.39
1.41
1.38
(13–12-25)
119.60
119.93
119.62
(14,22)
1.36
1.38
1.40
(12–13-14)
120.31
120.30
118.84
(15,16)
0.37
1.38
1.40
(15–14-22)
120.68
120.24
118.33
(15,21)
0.38
1.40
1.37
(14–15-21)
114.66
113.88
118.52
(16,27)
1.07
1.08
1.01
(16–15-21)
124.37
125.01
121.40
(18,28)
0.96
0.99
0.91
(3–18-28)
110.96
106.28
110.29
(19,29)
0.96
1.00
0.95
(10–19-29)
113.86
109.35
101.93
(20,30)
0.95
0.98
0.91
(8–20-30)
115.44
112.13
113.42
(21,31)
0.95
0.97
0.99
(15–21-31)
115.54
112.83
112.59
(22,32)
0.95
0.98
0.98
(14–22-32)
113.10
109.68
101.87
3.2 Generation of Molecular Descriptors
Our calculations are applied to thirty-one flavonoids, which are characterized by thirteen descriptors correlated with theirbiological activities (pIC50).The objective of a QSAR study is to use a mathematical model for the prediction of the antioxidant activities of newly synthesized analogous molecules and to sort out the promising molecules before going to the experimental stage.Table 3 collects all the computed descriptors of the thirty-oneflavonoids.
No
Vol.
HE
log P
Pol.
MW
HF
EHOMO
ELUMO
DM
RB
HD
HA
TPSA
1
1442.92
−47.61
−5.72
54.11
594.53
−553.82
−0.27308
−0.04987
7.80
6
10
15
256.29
2
1801.56
−57.78
−7.18
67.53
756.67
−759.21
−0.26527
−0.04146
6.21
9
13
20
335.44
3
1743.13
−51.53
−6.15
66.89
740.67
−710.11
−0.22100
0.00175
8.27
8
12
19
315.21
4
1817.18
−43.72
−7.04
74.75
800.72
−655.39
−0.14423
−0.14108
14.77
12
10
18
301.05
5
1112.70
−34.05
−3.44
40.77
446.37
−376.39
−0.22794
−0.04651
7.55
4
6
11
183.21
6
755.02
–32.68
−4.01
28.54
302.24
−225.02
−0.25302
−0.04606
4.26
1
5
7
127.45
7
737.08
−27.04
−2.99
27.90
286.24
−181.97
−0.25454
−0.04463
3.76
1
4
6
107.22
8
1480.17
−53.11
−5.91
54.75
610.53
−594.10
−0.26526
−0.03515
5.46
6
10
16
265.52
9
796.96
−35.31
−4.14
29.28
306.27
−251.56
−0.24548
0.01728
4.00
1
6
7
130.61
10
779.09
−31.10
−3.12
28.65
290.27
−209.06
−0.25234
0.00795
3.20
1
5
6
110.38
11
1393.96
−52.08
−6.97
56.52
578.53
−406.53
−0.23910
−0.00041
6.39
3
10
12
220.76
12
1353.53
−50.33
−6.27
55.75
576.51
−396.04
−0.24712
0.00521
4.17
2
9
12
209.76
13
1077.51
−31.80
−2.49
40.05
416.38
−298.59
−0.24421
−0.01044
6.91
4
5
9
145.91
14
1096.72
−35.65
−3.52
40.69
432.38
−340.25
−0.23790
−0.00567
4.37
4
6
10
166.14
15
1154.98
–32.24
−3.49
42.52
446.41
–332.21
−0.24770
−0.01768
3.30
5
5
10
155.14
16
695.89
−19.27
−1.03
26.63
254.24
−91.86
−0.24242
−0.00687
5.33
1
2
4
66.76
17
709.90
−24.68
−2.05
27.27
270.24
−141.38
−0.24776
−0.03413
3.26
1
3
5
86.99
18
773.34
−19.97
−2.02
29.10
284.27
−127.56
−0.24124
−0.00586
1.77
2
2
5
75.99
19
797.68
−19.11
−1.60
29.29
286.28
−147.23
−0.24342
−0.00751
2.77
2
2
5
75.99
20
718.51
−17.37
−0.53
26.74
242.27
−84.41
−0.24625
0.01462
3.54
1
2
3
49.69
21
1206.15
−37.98
−4.95
46.87
482.44
−328.56
−0.24934
−0.05253
3.76
4
6
10
166.14
22
1178.42
−41.82
−5.44
43.80
478.41
−424.64
−0.26574
−0.04158
9.53
5
7
12
195.60
23
746.42
−28.66
−2.59
28.10
288.26
−202.56
−0.25682
−0.03066
3.92
1
4
6
107.22
24
1145.30
−39.96
−4.05
41.52
450.40
−404.53
−0.24626
−0.00343
5.94
4
7
11
186.37
25
721.73
–23.85
−2.09
27.27
270.24
−142.79
−0.26369
−0.02437
5.16
1
3
5
86.99
26
740.32
−29.49
−3.11
27.90
286.24
−185.85
−0.26617
−0.02590
4.86
1
4
6
107.22
27
797.46
–23.32
−3.08
29.74
300.27
−176.55
−0.26297
−0.02516
5.05
2
3
6
96.22
28
886.63
−26.81
−4.97
32.85
346.29
−252.05
−0.25055
−0.04583
3.80
3
4
8
125.68
29
883.77
−29.04
−4.97
32.85
346.29
−249.37
−0.25355
−0.03643
3.74
3
4
8
125.68
30
872.01
–23.24
−4.07
32.21
330.29
−208.74
−0.26586
−0.02684
4.44
3
3
7
105.45
31
942.11
–23.86
−4.94
34.68
360.32
−238.54
−0.25358
−0.03559
3.63
4
3
8
114.68
Volume (Vol, Å3), hydration energy (HE, kcal/mol), octanol–water partition coefficient (log P),polarizability (P, Å3), molar weight (MW, amu), Heat of formation (HF, kcal/mol), HOMOenergies(EHOMO, au) and LUMO energies (ELUMO, au), dipole moment (DM, Debye), number of rotatable bonds(RB), hydrogen bond donors (HD), hydrogen bond acceptors (HA), and topological polar surface area(TPSA,Å2).
3.3 Hierarchical clustering (HC)and principal component analysis (PCA)
The main step of principal component analysis is to select the most influential components. For this reason, we have used the cumulative percentage (Cum Percent) of the total variation as the most significant criterion, which must go beyond 80% (Jolliffe, 2002) (From the point of view of inertia or variance, n first axes of the principal component analysis are a better option to compress a set of N random variables). According to Table 4, the two first main components hold 83.06 % of all the information.Thus, we can ignore or removethe other components of PCA representation, which facilitatesdataset compression.
Number
Percent
Eigenvalue
Cum Percent
1
71.656
10.0318
71.656
2
11.400
1.5960
83.056
3
8.399
1.1758
91.454
4
4.158
0.5822
95.613
5
2.116
0.2962
97.728
6
0.981
0.1374
98.710
7
0.774
0.1083
99.483
8
0.363
0.0509
99.847
9
0.085
0.0119
99.932
10
0.058
0.0081
99.990
11
0.005
0.0007
99.995
12
0.004
0.0006
99.999
13
0.001
0.0001
100.000
We have illustrated the loading diagrams as shown in Fig. 3, to better understand the corollary relationship between the different variables.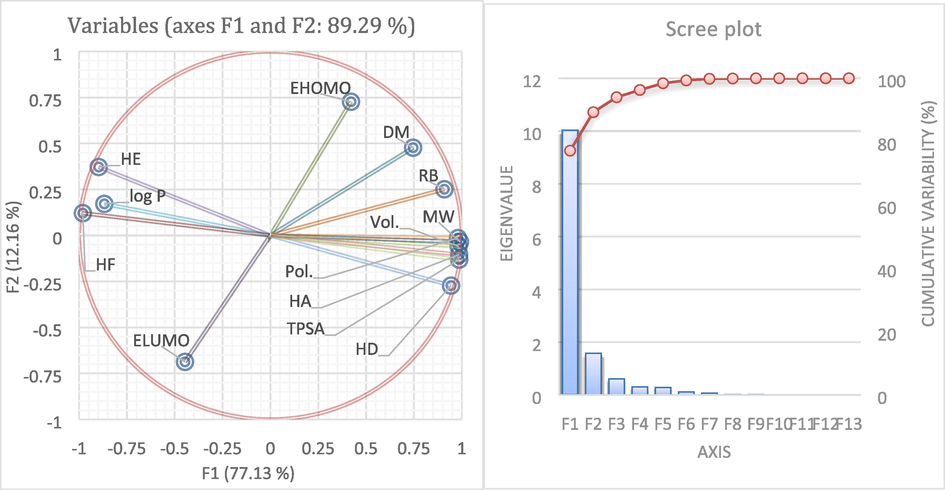
Correlation circle of different descriptors and biplot PCA scores.
As long as the load diagram has a higher absolute value, its influence on the PCA/model is more significant(Yoo and Shahlaei, 2018). The circle of correlation helps to get the relations between the variables. We explore the existence of groups of reliable variables that are well correlated. If these groups have a real existence,therefore all the variables of a designated group have the chance to be synthesized by a well-determined variable.
By analyzing the circle of correlation, we notice that:
-
TPSA, HD, HA, Pol, MW, and V constitute a strongly correlated subgroup because their corresponding vectors largely overlap.
-
The topological parameters on the first axis are negatively related to the energies of HF and HE.
-
Second factorial axis mainly depends on ELUMO and EHOMO energies.
To define the sub-classes of our dataset, we have established a hierarchical grouping;it is a multivariate technique that leads to assembling very close findings. Well-defined clusters share close descriptors values(SAS Institute Inc, 2017).
Fig. 4 indicates that the data is divided into four distinct groups.We can differentiate them into the following groups:
-
Group 1: assembles the molecules: 1, 2, 3, 8, 11, and 12. These molecules have a similarity of having aweight that exceeds 575 amu and containing a group of glycosides.
-
Group 2: encompasses a single molecule, which carries the number 4. It is the only drift, which has a synapoyle group.
-
Group 3: contains the following molecules: 5, 13, 14, 15, 21, 22 and 24. These compounds enclose a glycoside group as the first cluster, but they have a weight well below 500 amu.
-
Group 4:gathers the remaining molecules. These are molecules of simple structures whose weight is less than 500amu.
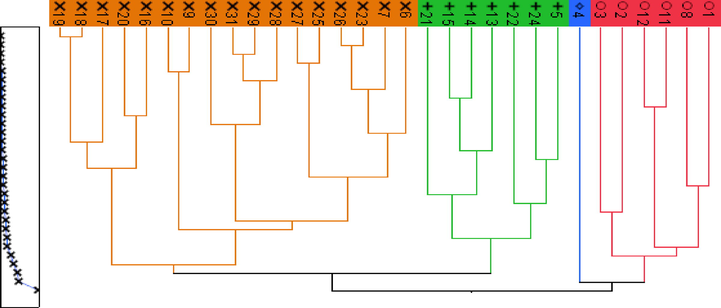
- Scheme ofHierarchical Classification.
In order to illustrate the distribution of the molecules within the two principal components, a score plot is given in the Fig. 5.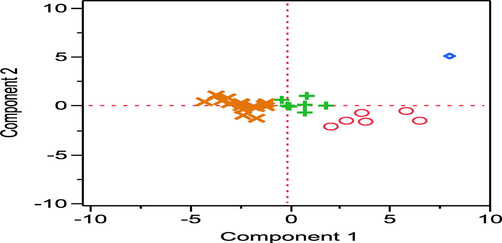
Scoring plot.
3.4 Construction of a QSAR model by applying the Gaussian process
The aim of regression is to pattern the relationship between input data and real-valued output data. This section shows how to take advantage of the qualities of Gaussian processes in order to solve these regression problems. Due to their random nature, Gaussian processes can serve as a probability distribution over a space of functions. Therefore, it is conceivable to use them as a probability distribution in the context of Bayesian inference.
Prediction is usually the primary goal of a regression, where an input × is passed to the learning algorithm for it to subsequently provide an estimate of the output value Y. In the regression by Gaussian process, it is from the posterior distribution over the space of functions that the predictions are made. From a probabilistic point of view, calculating this distribution is a relatively simple operation.
The data set is split into two sets, the test, and the training one. The test set was randomly swept among the three most dominant groups 1, 3, and 4 with a ratio of approximately 1:5. Molecules used for the test set are 7, 12, 15, 1, 9, and 23.
Through the GP model, we confirm that the value of the HOMO energy is the factor that clearly dominates the antioxidant activity with a relative contribution of 27.03% (SAS Institute Inc,2018).
Naturally, the GP processes perfectly interpolate the data. They can deal with models with an error term equalto zero, where there is a similarity between input and output values. This similarity can be shown by calculating the coefficient ofcorrelation (R2) (Mouhibi et al., 2013)and the absolute average relative error (AARE) (Darnag et al., 2017)forthe training set. A good correlation is obtained with a higher value of R2 and a lower value of AARE.
and
- is the experimental output,
- is the predicted output,
- is the mean of dependant variable,
-N is the number of the molecules in the data set.
In order to check the prediction capacity of our model (Fig. 6.); an external validation was established using the predictive R2(R2pred)(Muhammad et al., 2018), and AARE pred on the test set (Darnag et al., 2017).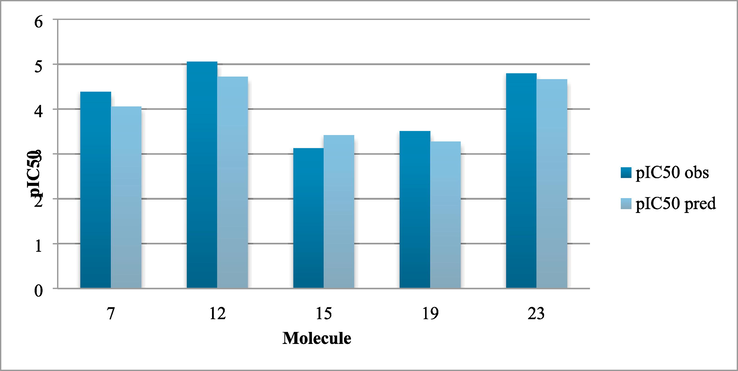
Comparison in the test set between observed and predicted pIC50.
The values of the statistical parameters are given as follows:
-
We have validated the training set with: R2 = 0.99 and AARE = 0.01.
-
We have validated the test set: R2pred = 0.86 and AAREpred = 0.06.
It can be deduced that the model is predictive and reliable withR2pred = 0.86, so it is much higher than the reference value of 0.6 (Tropsha, 2010).
4 Conclusion
Typical QSAR studies use common techniques such as the artificial neural method, multiple linear regression, and partial least squares regression. The aim of this work was to use a statistical technique little known in pharmaceutical chemistry, the Gaussian process regression which is rarely used to build a QSAR model. In our study, we have also demonstrated that GP is reliable and capable of predicting antioxidant activity with a respectable record (R2pred) which is equal to 0.86, so it is much higher than the reference value of 0.6. Therefore, we estimate that this reliable model can be used to predict the antioxidant activity ofa series of new molecules. Also, based on the HC results, our set was divided into four separate clusters according to the presence of glycosides and the molar weight of the flavonoids.
Declaration of Competing Interest
The authors declare that they have no known competing financial interests or personal relationships that could have appeared to influence the work reported in this paper.
References
- Molecular Structure, Drug Likeness and QSAR modeling of 1,2-Diazole Derivatives as Inhibitors of Enoyl-acyl carrier protein reductase. J. King Saud Univ. Sci.. 2020;32:2301-2310.
- [Google Scholar]
- Structural exploration and quantitative structure-activity relationships properties for 1.2. 5-oxadiazole derivatives. Rev. Theor. Sci.. 2015;3:264-272.
- [Google Scholar]
- Docking and 2D-structure-activity relationship and ADMET studies of acetylcholinesterase inhibitors. Phys. Chem. Res.. 2022;10:31-44.
- [Google Scholar]
- Electronic structure and physico-chemical property relationship for thiazole derivatives. Asian J. Chem.. 2013;25:9241.
- [Google Scholar]
- Virtual screening and QSAR modeling for antioxidant activity of benzofurans and flavonoids. Algeria: University Mohamed Khider, Biskra; 2020. PhD thesis
- The antioxidant activity of coumarins and flavonoids. Mini Rev. Med. Chem.. 2013;13:318-334.
- [Google Scholar]
- Flavonoid composition of orange peel and its association with antioxidant and anti-inflammatory activities. Food Chem.. 2017;218:15-21.
- [Google Scholar]
- Bayesian Reinforcement Learning of Partially Observable Markov Decision Processes: An Approach Based on Gaussian Processes. Canada: University of Laval, Quebec; 2010. PhD thesis
- QSAR models for prediction study of HIV protease inhibitors using support vector machines, neural networks and multiple linear regression. Arab. J. Chem.. 2017;10:S604.
- [Google Scholar]
- Design, synthesis and exploring the quantitative structure–activity relationship of some antioxidant flavonoid analogues. Bioorg. Med. Chem. Lett.. 2014;24:5050-5054.
- [Google Scholar]
- Fast hierarchical clustering and its validation. Data Knowl. Eng.. 2003;44:109-138.
- [Google Scholar]
- SAR and QSAR of the antioxidant activity of flavonoids. Curr. Med. Chem.. 2007;14:827-845.
- [Google Scholar]
- Frisch, M.J., Trucks, G.W., Schlegel, H.B., Scuseria, G.E., Robb, M.A., Cheeseman, J.R., Scalmani, G., Barone, V., Mennucci, B., Petersson, G.A., Nakatsuji, H., Caricato, M., Li, X., Hratchian, H.P., Izmaylov, A.F., Bloino, J., Zheng, G., Sonnenberg, J.L., Had, M., Ehara, M., Toyota, K., Fukud, R., Hasegawa , J., Ishida, M., Nakajima, T., Honda, Y., Kitao, Y., Nakai, H., Vreven, T., Montgomery, J.A., Peralta, J.E., Ogliaro, F., Bearpark, M. , Heyd, J.J., Brothers, E., Kudin, K.N., Staroverov, V.N., Keith, T., Kobayashi, R., Normand, J., Raghavachari, K., Rendell, A., Burant, J. C., Iyengar, S.S., Tomasi, J., Cossi, M., Rega, N., Millam, J.M., Klene, M. , Knox, J.E., Cross, J.B., Bakken, V., Adamo, C., Jaramillo, J., Gomperts, R., Stratmann, R.E., Yazyev, O., Austin, A.J., Cammi, R. G.A., Pomelli, C., Ochterski, J.W., Martin, R.L., Morokuma, K., Zakrzewski, V.G., Salvador, P., Dannenberg, J.J., Dapprich, S., Daniels, A.D., Farkas, O., Foresman, J.B., Ortiz, J.V., Cioslowski, J., Fox, D.J., Gaussian 09, Gaussian, Inc., Wallingford, CT, 2009.
- Statistical analysis of management data. New York: Springer Science; 2014.
- Use of principal component analysis (PCA) and hierarchical cluster analysis (HCA) for multivariate association between bioactive compounds and functional properties in foods: a critical perspective. Trends Food Sci. Technol.. 2018;72:83-90.
- [Google Scholar]
- He, Z., Liu, G., Zhao, X., Yang, J., 2013. Temperature model for FOG Zero-Bias using Gaussian process regression In: Intelligence computation and evolutionary computation, Ed., Springer-Verlag: Berlin Heidelberg.
- Antioxidant and anti-inflammatory flavonoids from the flowers of chuju, a Medical Cultivar of Chrysanthemum morifolim Ramat. J. Mex. Chem. Soc.. 2017;61:282-289.
- [Google Scholar]
- HyperChem release 8.09, molecular modeling system, Hypercube Inc., 1115 NW 4th Street, Gainesville, FL 32601, USA, 2009.
- JMP 8.0.2, SAS Institute Inc., 2009.
- Principal component analysis (2nd Edition,). New York: Library of Gongress Cataloging-in- Publication Data, Springer –Verglas; 2002.
- The application of electronic computers to factor analysis. Educ. Psychol. Meas.. 1960;20:141-151.
- [Google Scholar]
- Investigations on Molecular Structure, Electronic Properties, NLO Properties and Comparison of Drug-Likeness of Triazolothiadiazole Derivatives by Quantum Methods and QSAR Analysis. Rev. Theor. Sci.. 2016;4:85-96.
- [Google Scholar]
- Quantitative structure-antioxidant activity relationship of quercetin and its new synthetised derivatives. Nova Biotechnol. Chim.. 2012;11:37-44.
- [Google Scholar]
- QSAR Modeling and Molecular Docking Studies of 2-Oxo-1, 2-Dihydroquinoline-4- Carboxylic Acid Derivatives as p-Glycoprotein Inhibitors for Combating Cancer Multidrug Resistance. Heliyon. 2023;9(1):e13020.
- [Google Scholar]
- QSAR Modeling, Molecular Docking and Molecular Dynamic Simulation of Phosphorus-Substituted Quinoline Derivatives as Topoisomerase I Inhibitors. Arab. J. Chem.. 2023;16(6):104783
- [CrossRef] [Google Scholar]
- Antiaging, antioxidant flavonoids, synthesis, antimicrobial screening as well as 3D QSAR CoMFA models for the prediction of biological activity. J. Asiat. Soc. Bangladesh Sci.. 2013;39:191.
- [Google Scholar]
- Investigation of metal-flavonoid chelates and the determination of flavonoids via metal flavonoid complexing reactions. J. Serb. Chem. Soc.. 2007;72:921-939.
- [Google Scholar]
- MarvinSketch, Chemaxon, 2020, http://www.chemaxon.com.
- Using multiple linear regression and artificial neural network techniques for predicting CCR5 binding affinity of substituted 1-(3, 3-diphenylpropyl)-piperidinyl amides and ureas. Open J. Med. Chem.. 2013;3:7-15.
- [Google Scholar]
- Review on: quantitative structure activity relationship (QSAR) modeling. J. Anal. Pharm. Res.. 2018;7:240-242.
- [Google Scholar]
- Estimation of daily intake of flavonoids and major food sources in middle-aged Australian men and women. Nutr. Res.. 2019;61:64-81.
- [Google Scholar]
- Hierarchical clustering. New York, USA: Springer Verlag; 2016.
- DPPH (1,1-diphenyl-2-picrylhydrazyl) radical scavenging activity of flavonoids obtained from some medicinal plants. Biol. Pharm. Bull.. 2001;24:1202-1205.
- [Google Scholar]
- Peer, W.A., Murphy, A.S., Flavonoids as signal molecules: Targets of flavonoid action In: The science of flavonoids. Erich Grotewold Ed., Springer: USA, 2006.
- Symbolic and numeric scheme for solution of linear integro-differential equations with random parameter uncertainties and Gaussian stochastic process input. App. Math. Model.. 2018;56:15-31.
- [Google Scholar]
- Gaussian processes for machine learning. USA: MIT Press; 2006.
- The crystal and molecular structure of quercetin: A biologically active and naturally occurring flavonoids. Bioorg. Chem.. 1986;14:55-69.
- [Google Scholar]
- A comparative study through DFT investigation and molecular docking studies of potential dietary phytochemicals against cancer target-DNA topoisomerase III. Phys. Chem. Res.. 2023;11:391-408.
- [Google Scholar]
- Antitrypanosomal and antileishmanial activities of flavonoids and their analogues: in vitro, in vivo, structure-activity relationship, and quantitative structure-activity relationship studies. Antimicrob. Agents Chemother.. 2006;50:1352-1364.
- [Google Scholar]
- Best practices for QSAR model development, validation, and exploitation. Mol. Inf.. 2010;29:476-488.
- [Google Scholar]
- Liquid chromatography-tandem mass spectrometry analysis allows the simultaneous characterization of C-glycosyl and O-glycosyl flavonoids in stingless bee honeys. J. Chromatogr. A. 2011;1218:7601-7607.
- [Google Scholar]
- Veeramuthu, D., Raja, W. R. T., Al-Dhabi, N. A., Savarimuthu, I., Flavonoids: Anticancer properties. Gonçalo Justino Ed., IntechOpen: London, 2017.
- The applications of PCA in QSAR studies: A case study on CCR5 antagonists. Chem. Biol. Drug Des.. 2018;91:137-152.
- [Google Scholar]
- Role of secondary metabolites in plant defense against pathogens. Microb. Pathog.. 2018;124:198-202.
- [Google Scholar]


