

Translate this page into:
Production of proinflammatory cytokines by expressing Newcastle disease vaccine candidates in corn
⁎Corresponding authors at: Centre of Excellence in Molecular Biology, University of the Punjab, Lahore, Pakistan ( A.Q. Rao and N. Shahid) naila.shahid@cemb.edu.pk (Naila Shahid), qayyum.cemb@pu.edu.pk (Abdul Qayyum Rao)
-
Received: ,
Accepted: ,
This article was originally published by Elsevier and was migrated to Scientific Scholar after the change of Publisher.
Peer review under responsibility of King Saud University.
Abstract
The efficacy of a plant-based edible vaccine produced in maize by expression of F and HN immunogenic proteins under a seed-specific promoter against Newcastle disease virus (NDV) genotype VII was assessed using cytokine-mediated cellular immune responses in chickens. Using real-time PCR, the mRNA expression of transgenic maize plants was compared to non-transgenic control plants on a relative basis. F and HN genes mRNA expression was found to be 20 and 60 times higher in corn seeds than in leaves, respectively. In maize seeds, 35 µg ml−1 of F protein, or 0.6 percent of total protein, and 41 µg ml−1 of HN protein, or 0.85 percent of total protein, were found using ELISA. The boost in cell-mediated immune response was evaluated in chickens fed with transgenic corn seeds in comparison with control groups. The qPCR analysis showed an increase in the expression of IL-1 (Interleukin-1), IL-2 (Interleukin-2), IL-6 (Interleukin-6), IL-8 (Interleukin-8), IL-10 (Interleukin-10), IL-15 (interleukin-15), Interferon-α, Interferon-β, Interferon-γ, and CCL3 when evaluated at 0, 7th, 14th, 21st, 28th and 35th day in chickens receiving transgenic diet as compared to group 1 receiving non-transgenic diet. The increase in cytokines production was comparable with group 3 immunized with conventional market vaccine. Furthermore, anti-NDV antibodies were also found in the serum of chickens given maize containing immunogenic proteins, but not in the serum of chickens given a regular normal diet, illustrating the antibodies’ specificity produced after feeding. The results demonstrate that transgenic maize consumed orally strongly stimulates the expression of cytokine genes related to cell-mediated immunity, just like commercial vaccines. These results further suggest that these cytokines may be important in initiating cellular immune responses in response to NDV infection.
Keywords
Newcastle disease virus
Plant-based edible vaccine
Infectious diseases
Poultry
Poultry vaccine
Immunoassay
Cytokines
Interferon
Maize
Plant transformation
Antibodies

1 Introduction
For a long time, Newcastle disease has plagued the chicken business. It is considered a threat to avian species, particularly chickens (Behboudi and Hamidi Sofiani, 2021). Poultry, being the largest livestock group, plays a critical role in the production of more than 30 % of animal proteins. The poultry industry is significant in developing countries because it helps people raise home flocks, which adds to large-scale animal production and provides a source of income in rural areas. However, because of lax biosecurity, it is more vulnerable to infectious diseases such as Newcastle disease (ND) or highly pathogenic avian influenza (HPAI). Since 1926, when the first case of Newcastle disease virus (NDV) was recorded worldwide, Pakistan has been endemic to the virus. NDV has a significant impact on the poultry sector, and the economy of a country like Pakistan bears the weight of this deadly disease. According to reports, Punjab, Pakistan's province, lost 6 billion PKR in 2012 (Rehan et al., 2019). During 2011–2013 it has caused an economic loss of USD 200 million (Siddique et al., 2013).
S. No.
Primers
Primers Sequences
Tm (0C)
Annealing Temperature (0C)
Product Sizes
Accession Numbers
1
IL-2 F1
GTGTTACCTGGGAGAAGTGGTT
55.9
59
117
AY510091.1
IL-2 R1
CCCGTAAGACTCTTGAGGTTCT
55.3
2
IL-6 F2
CCTCCTCGCCAATCTGAAGTCA
58.1
63
102
HM179640.1
IL-6 R2
GCCCTCACGGTCTTCTCCATAA
57.9
3
IL-8 F1
GCTGCTCTGTCGCAAGGTAGGA
60.6
61
123
HM179639.1
IL-8 R1
GCTTGGCGTCAGCTTCACATCT
59.8
4
IL-10 F1
GGAGCAAAGCCATCAAGCAGAT
57.6
60
137
EF554720.1
IL-10 R1
GGCTCACTTCCTCCTCCTCATC
57.9
5
IL-15 F1
ACTGTAAGTGGTCAGACGTTCT
55.1
61
122
HQ005358.1
IL-15 R1
TCTCATTACAGGTTCCTGGCAT
55.2
6
CCL3 F2
GGGTTGGATGTGTGATGGGAGA
58
62
122
EU999777.1
CCL3 R2
CGTAGGACAAGCAGCAGGTTGA
58.9
7
INF-α F1
CGCAACCTTCACCTCACCATCA
59.2
62
120
EU367971.1
INF-α R1
CAGGAACCAGGCACGAGCTT
58.3
8
INF-β F1
TCGTCACCAGGATGCCAACTTC
58.9
63
148
GU119897.1
INF-β R1
GGCTGCTTGCTTCTTGTCCTTG
58.7
9
INF-γ F1
AGATGTAGCTGACGGTGGACCT
58.9
60
150
AY163160.1
INF-γ R1
ATGTGTTTGGTGTGCGGCTTTG
59.1
10
IL-1 F1
CAGAAGAAGCCTCGCCTGGATT
58.7
60
132
HQ008778.1
IL-1 R1
CCTCCGCAGCAGTTTGGTCAT
59.1
ND is caused by the noxious virus that infects domestic chickens as well as other bird species. Epizootics of ND show the disease's prevalence across Central and South America, Africa, Asia, and, to a smaller extent, Europe. NDV the leading cause, is a paramyxovirus categorized as avian orthoavulavirus 1, formerly known as APMV-1 (avian paramyxovirus 1) (da Silva et al., 2020). The NDV genome size is approximately 15.2 kb in length. It encodes for six important structural proteins i.e., P (phosphoprotein); NP (nucleocapsid protein); M (matrix protein); HN (hemagglutinin-neuraminidase); F (fusion protein), and an L (RNA-dependent RNA polymerase), as well as two non-structural proteins V and W (Munir et al., 2012; Brown and Bevins, 2017).
NDV is classified into four pathotypes based on the severity of the infection in chickens: avirulence (asymptomatic enteric), low virulence (lentogenic), mid virulence (mesogenic), and high virulence (velogenic) (Putri et al., 2017). NDV is endemic in Africa, Asia, and North and South America (Serbessa and Tucho, 2017). Aerosols, bird feces, polluted hatcheries, contaminated food and water, and exposure to infected birds are all potential sources of contamination. Signs of ND include sneezing, coughing, wing paralysis, rales, clonic spasm, etc. It has also been reported to cause conjunctivitis in humans (Abdisa and Tagesu, 2017).
Management measures and vaccination have been found to be important in limiting ND. Preventive measures, such as yard cleanliness and maintenance, quarantining diseased birds, and so on, are included in management strategies. Vaccination, on the other hand, is the most effective strategy to treat and prevent ND in birds since it creates immunity. Several vaccinations, including live attenuated vaccines, killed vaccines, subunit vaccines, and recombinant vaccines, are used to combat numerous chicken diseases. In the field of bio farming, new breakthroughs are being made in the development of plant-based edible vaccinations (Rybicki, 2014).
Plant-based vaccines have numerous advantages. Antigens developed from them are stable and may be stored for longer periods of time, while they can be made in large quantities at a low cost. Patients rapidly absorb carrier plants such as potatoes and maize, and antigens generated from them are stable and can be preserved for long periods of time. They have overcome the drawbacks of traditional vaccines, such as the need for maintenance and storage. In the case of plant-based vaccines, chloroplast expression is strong, and high output can be attained. The use of crop plants that are edible to the host, such as banana, rice, alfalfa, maize, and so on, is one of the greatest attributes (Shahid and Daniell, 2016, Sahoo et al., 2020).
In the expression of the protein, there are three multiple techniques or systems that are regarded as crucial. The first choice is biolistic transformation which enable for the direct incorporation of foreign DNA or RNA into plant cells after coating with gold or tungsten. High-pressure helium gas is used to fire the particles from a gene gun, which then penetrate the host cell wall directly. The second option is Agrobacterium-mediated transformation to continue with stable gene integration, while the third option is to express the gene transiently for temporary expression of genes (Shahid and Daniell, 2016). Plant-based edible vaccines can trigger both mucosal and systemic immunity (Kurup and Thomas, 2020). IgA and IgG have been discovered to have an important function in the immune response. T-cells, B-cells, and specific cytokines such as IL-4, IL-10, and others all play a part in the mucosal immune response. Cholera toxin beta subunit (CTB) and heat-labile enterotoxin B (LTB), two transmucosal carrier proteins that bind to gut receptors, play a critical role in antigen translocation through mucous membranes. Bioencapsulation allows for antigen administration that is both safe and effective (Wang et al., 2015).
The effectiveness of edible vaccinations is still hampered by dosage management and oral tolerance. Several plant-based vaccinations against various viral and bacterial illnesses have been created in the past, either for veterinary or human use (Parvathy, 2020). Regulatory approval is still a major constraint that is hindering the commercialization of plant-based oral vaccines. Apart from this a lot of advancements are still required in the delivery system, immunization techniques, and strategies to make this vaccine more effective and set free from controversies (Pantazica et al., 2021). Only two milestones in the form of vaccines have been licensed thus far, namely a plant-based scFV mAB vaccine against HBV and an edible vaccine against NDV, indicating that there is still a lot of work to be done in this domain. The US Department of Agriculture's (USDA) Centre for Veterinary Biologics permitted the first vaccine against NDV that was prepared in plant suspension cells. After the challenge assay, strong evidence suggested that chickens had a 90 % efficient immune response. Despite this, the concept has yet to be marketed, and no vaccine is currently available (Laere et al., 2016; Shahid et al., 2020). However, for human trials, the idea is tantalizing as it requires standardization of vaccine doses (Rybicki, 2014).
The present work examined the cytokine expression pattern of the chickens fed with transgenic corn compared to chickens immunized with commercially available vaccine. These results further suggest that these cytokines may be important in initiating cellular immune responses in response to NDV infection.
2 Methodology
2.1 Bacterial strains and drugs
E. coli strain (Top 10) was used for plasmid transformation. Bacteria were grown in Luria Bertani media along with 100 mg l−1 ampicillin or 50 mg l−1 kanamycin or 100 mg l−1 Tetracycline concentrations based on the antibiotic resistance gene in the construct. Agrobacterium strain LBA4404 was grown in yeast extract peptone agar (YEP) supplemented with 50 mg l−1 rifampicin concentration.
2.2 Construction of expression vector
The coding DNA sequence of F and HN genes of NDV genotype VII submitted on NCBI (GenBank: AJR19275.1; GenBank: AJR19275.1) was codon optimized according to maize genome using IDT (Integrated DNA Technologies) the online available tool. The gene cassette was chemically synthesized in 5′ to 3′ direction containing CTB Zea mays globulin-1 gene, promoter region, F gene, HN gene and Nos in PUC 57 vector. The synthetic construct flanked by Sal1 and BamH1 was introduced in pCAMBIA 1302 plant expression vector to produce pCAMBIA F + HN. The recombinant plasmid pCAMBIA F + HN was afterward transformed into E. coli-Top10 strain. The transformed cells were then spread on LB agar plates having drugs (50 µg ml−1 kanamycin and 50 µg ml−1 tetracycline). The presence of synthetic genes was confirmed in plant expression vector through polymerase chain reaction (PCR) and restriction digestion.
2.3 Maize transformation
Maize cobs with immature embryos were acquired from the greenhouse of the CEMB, University of the Punjab, Lahore, Pakistan. Previously established CEMB shoot cut method with some modifications was used for the maize transformation. The newly emergent embryos were isolated and cut at specific locations with a surgical razor. The embryos were co-cultured with Agrobacterium suspension having HN and F gene and incubated at 28 °C for 30–45 min. After 1-hour embryos were dried on an autoclaved filter paper and planted on MS media plates containing cefotaxime (100 µg ml−1) followed by incubation at 28 °C for 16 h under fluorescent tube light and 8 h dark period. After 5–6 days, freshly grown plants were shifted in MS media tubes having cefotaxime (100 µg ml−1) and vitamin B5 (1 ml/IL), hygromycin (50 µg ml−1) shooting and rooting hormones, kinetin (1 mg ml−1), cytokinin (1 mg ml−1) for better rooting and shooting of the transgenic plants. Depending upon the survival of transgenic plants on selection media, after every 10 days their transformation efficiency was calculated. To transfer the plantlets, soil mixture was prepared by filling pots with an equal amount of sand and clay. Plants were properly acclimatized and finally, transferred to the greenhouse.
2.4 Molecular analysis
Genomic DNA was isolated from the transgenic plants. PCR analyses were carried out with gene-specific-primers by using Thermo Scientific™ PCR Master Mix (2X) (Catalogue# K0171). For the amplification of F gene of 587 bp [reverse 5′-TTTCCGTGTTGTTTTCTGCG-3′ and forward 5′-GAGCGACTTGGACTGTATTG-3′] and 567 bp of HN gene [reverse 5′-CTTGGTATGTGTAATCCCCGC − 3′ and forward 5′-ACTATCCTGGTGTCGGTGGT-3′] primers were utilized. Amplification parameters were maintained as: initial denaturation (95 °C for 5 min), followed by 35 cycles (95 °C for 45 sec, 59 °C for 45 sec, 72 ˚C for 1 min) and final extension (72 °C for 10 min). The obtained PCR products were examined using 1 % agarose gel and visualized under UV illuminator, for detection of both genes.
2.5 Generation advancement of maize expressing NDV (F + HN) antigens
Putative transgenic maize seeds having NDV genotype VII (F + HN) antigens from T0 generation were collected from CEMB, University of the Punjab, Lahore, Pakistan. Seeds from 11 putative cobs were collected and sown directly into the field for T1 generation. The plants were self-pollinated as the cobs grew after 3–4 months. When the cobs were fully matured, they were harvested. Seeds were collected after drying the cobs at room temperature. The genomic DNA was extracted, and PCR was executed for the confirmation of the presence of transgene in advanced lines.
2.6 mRNA expression studies of genetically modified maize plants
To study the mRNA expression of genetically modified maize having HN and F genes, transgenic maize plants were utilized for the total RNA isolation from the leaves and seeds, as per manufacturer’s instructions by (Pei et al., 2011). cDNA synthesis was done by cDNA synthesis kit as per protocol (Thermo Scientific, K1622). The transcriptional expression of the genes was measured by using Real Time PCR. For data normalization, Glyceraldehyde 3-phosphate dehydrogenase (GAPDH) was used as an internal control reference gene. In quantitative RT-PCR (qPCR), cDNA was used as template to amplify F gene of 149 bp [forward 5′-AACCCTGACTACGCTCCTCACC-3′, reverse 5′-TGCTGCTGCCGCTGTTATCTG-3′] and HN gene of 150 bp [forward 5′-TTCACCTTCGGACACGGCTCAA-3′, reverse 5′-ATCGCTTGTTGGACCCGCTTTC-3′], using gene specific primers. Thermal cycling parameters were programmed with initial denaturation (94 °C for 4 min), followed by 35 cycles (maintained at 94 °C for 60 sec, 62 °C for 30 sec, 72 °C for 30 sec) and final extension (72 °C for 10 min) respectively. A melting curve was obtained from multiple transgenic maize plants, detecting the specificity of the amplification process. Using StepOne software version 2.3, the CT values of genes obtained from different primers were statistically evaluated and standardised with the housekeeping GAPDH relative control.
2.7 Qualitative detection of NDV antigens in plants through Enzyme-linked immunosorbent assay (ELISA)
NDV antigen detection was done through the chicken NDV ELISA Kit (Catalogue# abx055552). Corn seeds were used to extract crude protein through chill Plant Extraction Buffer comprising of [NaCl (100 mM), EDTA (10 mM), Tris HCL (200 mM; pH 8.0), SDS (0.1 %), BME (14 mM), Sucrose (200 mM), PMSF (2 mM), DTT (100 mM), and Tween-20 (0.05 % v/v)]. Seeds were ground in liquid nitrogen and 800 μl of PEB was added. Samples were vortexed to mix the constituents effectively. After that incubation of samples was achieved at 4 °C for overnight. Samples were vortexed for 2–3 min, afterwards. After that centrifugation of samples was executed with a speed of 13,000 g for 10 min. The supernatant was separated and diluted 1/5 according to the standard protocol of the ELISA kit. Total 50 μl of positive control, negative control, and samples were aliquot in the set wells. One blank well as zero control was also allocated. Samples’ plate was wrapped with a cover and kept for 30 min at 37 °C. Solutions were then discarded and wells were washed with 1X wash buffer 5 times to ensure the complete removal of the solutions. Wells were then bloated against clean absorbent paper towels. After that 50 μl of HRP conjugate was added to the bottom of the sample wells not including the blank well. The plate was again kept for 30 min at 37 °C; followed by discarding of solution and washing as explained earlier. Afterwards, 50 μl of TMB solutions were added to the wells. The plate was then vortexed gently for 30 sec and kept in dark for 15 min. Afterwards, in each well, 50 μl of stop solution was added to stop the enzyme reaction. After that absorbance of every well was immediately measured at 450 nm through BMG LABTECH SPECTROstar Nano Microplate Reader.
2.8 Quantitative detection of proteins
The ELISA and western blot analysis were conducted in accordance with the procedure specified by (Shahid et al., 2020 Optical density was calculated at 450 nm with reference to different standards of known concentration for quantification of F and HN proteins. The percentage of total soluble F and HN proteins were calculated by using formula % of TSP = TP/TSPx100, where TP is the ELISA protein concentration and TSP is the Bradford assay protein concentration.
2.9 Detection of HN and F protein through western blot analysis
On 12 % SDS PAGE, 100 μg of freshly extracted proteins from seeds of transgenic maize plants were resolved. The gel was run at 85 V before being moved to the resolving gel, after which the voltage was increased to 120 V. The obtained protein then was moved to a nitrocellulose membrane for western blot analysis using a trans-blotter (Mini transblot cell BIORAD). The specificity of both proteins was validated through specific antibodies. (Polyclonal anti-F antibody and anti-chick IgY secondary antibody for F protein; monoclonal HN primary antibody (200 g/ml: Santacruze) and anti-mouse secondary antibody for HN protein).
2.10 Animal acclimatization and collection of data
To study the cell mediated immune response broiler chicks (aged 13 days) that had not received NDV vaccination were purchased from a poultry hatchery and housed in animal house conditions for three days. The study was approved by the institution's ethical committee (CEMB), University of Punjab, Lahore. The deep litter animal management system was used to house the animals in groups, with an optimum temperature of 23 °C +/− 3 °C, relative humidity of 50–60 %, and a 12-hour light and 12-hour dark cycle. As a result, each chick's age was similar (i.e., 13 days old). Following a three-day acclimation period, all chicks in all groups were immunized at the same time, at the age of 16 days (Supplementary 3). All the chickens were maintained without food for four to five hours prior to inoculation and for one to two hours afterward. Chickens were then divided into three groups based on the type of diet or vaccine intake. Each group contained 5 birds. Chickens receiving normal diet were named as group 1. Chickens receiving a transgenic diet from line 6 after its generation advancement were termed group 2, while chickens receiving commercial vaccines were named group 3. Transgenic maize seeds were ground and fed to the group 2 chickens for 5 weeks i.e., 500 µg twice a week after depriving them of food for 3 hrs. Group 1 and group 3 were given the normal diet. Group3 was immunized with commercially available LaSota vaccine through drinking water on the 0 day and 14th day. The weight and blood of chickens from brachial wing vein were collected on 0, 7th, 14th, 21st, 28th, and 35th day (Supplementary 5). Weight data was recorded in tabular form and analyzed in the form of graphs through GraphPad Prism version 7.
2.11 Evaluation of cytokine-mediated cellular response through real time PCR
The cytokine-mediated cellular immune response was studied in chickens after immunization with transgenic diet. The sequence of immune specific cytokines from NCBI was used to design pairs of primers through Primer 3 software (Table 1). The mRNA expression analysis of 10 different cytokines was done by utilizing Maxima SYBR Green/ROX qPCR Master Mix (2X) (Thermo Scientific, K0221) through Applied Biosystem Step One Real Time PCR machine. Glyceraldehyde 3-phosphate dehydrogenase (GAPDH) was used for data normalization, as an internal control housekeeping gene. As a template 200 ng of cDNA was used in qPCR. The reaction conditions of q-PCR were set at different annealing temperatures to evaluate the mRNA expression of 10 cytokines genes in blood. qRT-PCR for each cytokine was done by using the given cycling conditions: initial denaturation (95 ˚C for 5 min), followed by 40 cycles of amplification (95 ˚C for 30 sec, annealing temperature for 30 sec, and 72 ˚C for 30 sec) to amplify the gene through gene specific primers. Forward and reverse primers sequences and their respective annealing temperatures are shown in Table 1. Using StepOne software version 2.3, the CT values of genes obtained from different primers were statistically evaluated and standardized with the housekeeping GAPDH relative control.
2.12 Detection of chicken's antibody titer against NDV through haemagglutination inhibition test
Chicken's antibodies titer was assessed through haemagglutination inhibition test as described by OIE manual 2015 using 4 Haemagglutinin Units (HAU) of NDV antigens. Blood samples from control, transgenic, and commercial vaccine group chickens were collected in a tube on the 21st day, 28th day, and 35th day. Samples after incubation at room temperature for 15–30 were centrifuged at 3000X for 5 mins to separate the serum. Serum samples were then processed for the microplate HI test. Total 25 µl PBS was distributed into each well of the V-bottomed shape HI microtiter plate. In the first well of the plate, 25 µl of serum was added. Then two folds dilution of 25 µl of serum was added in the plate. After that 4 HAU virus/antigen in 25 µl was added to each well. Then the plate was kept at 20 ˚C for 30 min. Later 25 µl of 1 % (v/v) chicken's RBCs were added to each well and then subjected to mild mixing. After that plate was kept at room temperature i.e., at 20 °C for 40 mins to settle down RBCs properly. The highest dilution of sera inhibiting the hemagglutination was classified as HI positive. The plate was tilted to examine the agglutination. Inhibition was found in wells when RBCs flowed at the same rate as controls (virus/antigen, positive serum, and PBS controls). The test's validity was evaluated in comparison to negative and positive control serum. The log2 value of the reciprocal of the highest dilution inducing inhibition of hemagglutination is used to calculate HI titers.
2.13 Statistical analysis
A statistical analysis software, GraphPad Prism version 7 for Windows, was used to analyze the data using analysis of variance (ANOVA). Tukey's multiple comparison test was performed to compare the means of all treatments to check whether there were any statistically significant differences. P < 0.05 was used to determine whether or not a difference was significant.
3 Results
3.1 Confirmation of recombinant clones
The whole cassette encompassing F and HN genes joined with CTB and seed specific promoter was ligated in pCAMBIA1302 using Xba1 and BamH1, yielding recombinant pCAM CTB F-HN plasmid. Amplified PCR fragments of (∼587 bp) and (∼567 bp) HN and F genes respectively and removal of 6073 bp fragment (CTB fused F and HN + seed specific promoter) from 11837 bp pCAMBIA 1302 vector validated the confirmatory ligation of both genes in the pCAMBIA 1302 (Supplementary Fig. 1a, 1b and 1c).
3.2 Development of transgenic maize
The competent cells of Agrobacterium tumefaciens were transformed with recombinant pCAM CTB F + HN plasmid. The Positive clones were observed on YEP plates with kanamycin (50 µg ml−1) and Rifampicin (50 µg ml−1) selection after 48 h. To transform maize inbred line embryos, Agrobacterium-mediated transformation was used. For six days, embryos were managed to grow on MS media. The survived plants were shifted into tubes containing MS media. After 12 days, plants in tubes were transferred to pots. Only 12 plants were able to survived after acclimatization, followed by shifting into the greenhouse (Supplementary 2) and seven of these plants were found to be positive for recombinant plasmid pCAM CTB F-HN in transgenic maize. Seeds from six confirmed transgenic cobs were collected and sown directly into the field for T1 generation. The plants were self-pollinated as the cobs grew after 3–4 months. The presence of 587 bp fragment for F gene and 567 bp fragment for HN gene in genetically modified maize was confirmed by amplification using gene specific primers for HN and F genes in advanced lines (Fig. 1a-1b).
(a) Diagrammatic illustration of F + HN gene along with seed specific promoter. The immunogenic F and HN gene were cloned in Xba1 and BamH1 site under the regulation Cauliflower mosaic virus (CaMV) 35S promoter of multiple cloning sites with seed specific promoter. (b) Confirmation of 587 bp F gene in T1 putative maize plants through PCR using gene specific detection primer. Lane 4–8, 10, 11 amplified 587 bp F gene, Lane 3 positive control, Lane 2 negative control (c) Confirmation of 567 bp HN gene in T1 putative maize plants through PCR using gene specific detection primer. Lane 8–10, 11, 12, 16 amplified 567 bp HN gene, Lane 4 positive control, and Lane 2 negative control.
3.3 Analysis of transgene expression in genetically modified maize
Using GAPDH as a housekeeping gene, qRT-PCR analysis demonstrated an increase in relative mRNA expression in all genetically modified lines compared to non-transgenic controls. However, the increase in expression was greater in seeds as compared to the leaves. Line 6 and line 4 were found to have 25-fold higher mRNA expression for HN and F genes in leaves (Fig. 2a and 2b). While line 2,5 and 6 revealed almost 15 to 20-folds higher mRNA expression of F gene in seeds. Similarly, the line 1 and 2 were found to have 15-and 30-folds higher expression as compared to line 6 which showed to have almost 60-fold elevation in expression of HN gene in seeds (Fig. 2c and 2d).
Expression analysis of F and HN genes in maize leaves and seeds. cDNA was synthesized from transgenic maize leaves and seeds. The expression of F and HN genes was studied at transcription level in both leaves and seeds. (a, c) The maximum expression for F gene was observed in corn seeds i.e., 17-fold in F-S-5 and F-S-6;16-fold in F-S-2 and 10-fold in F-S-1 as compared to corn leaves where 28-folds was observed only in F-6. (b, d) Similarly, the maximum expression for HN gene was observed in corn seeds i.e. 58-fold in S-HN-6; 28-fold in S-HN-2, 18-fold in S-HN-1 and 17-fold in S-HN-3 as compared to corn leaves where 28-folds was observed only in HN-4. The figures depict the average SD of three biological replicates. One-way ANOVA is used to determine the significance of the data, and p 0.0001 is denoted by “ ****” and p 0.001 is indicated by “***” above bars.
3.4 Qualitative and quantitative detection of HN and F protein
Seeds of T1 generation from six lines (line 1, line 2, line 3, line 4, line 5 and line 6) at harvesting stage were used to detect NDV antigen qualitatively. Data was recorded as per standard protocol and analyzed through bar graph. All plants showed significant results and considered positive when compared with positive and negative controls (Fig. 3). TSP concentrations (F + HN) were reported 0.6 and 0.7 %, respectively. The presence of 67 and 69 kDa bands of F and HN after a nitrocellulose membrane colour reaction validated the specificity of the protein tested, respectively. (Fig. 4).
Qualitative detection of F and HN antigen in transgenic maize seeds through ELISA. L1, L2, L3 L4, L5 and L6 maize seeds were observed to be positive and comparable to positive control.
Western blot analysis demonstrating the expression of F and HN protein in transgenic plants. Total soluble protein extracted from transgenic maize seeds (a) 67 kDa protein band was obtained by western blot from transgenic maize seeds confirms the expression of F protein in seeds. Lanes 1–3, TSP from transgenic plants showing 67 kDa F protein; lane 4, protein marker (b) Similarly, 69 kDa protein band was obtained by western blot from transgenic maize seeds confirms the expression of HN protein in seeds. Lane 1, protein marker; Lanes 2–4, TSP from transgenic seeds showing 69 kDa HN protein.
3.5 Comparative analysis of animals based on weight
The weight of all the birds increased gradually, for example, the average weight of group 1 chickens at 0 day was 425.2 g, which increased to 531.2 g by the 7th day. It was 673.2 g on the 14th day, elevated to 841.2 g on the 21st day, 1045.2 g on the 28th day, and 1230 g on the 35th day. The average weight of group 2 chickens at 0 day was 424.2 g, which rose to 576.8 g by the 7th day. It was found to be 851.4 g on the 14th day, 944.4 g on the 21st day, 836.2 g on the 28thday, and 863.4 g on the 35th day. At 0 day, the average weight of group 3 chickens was 423.6 g, which rose to 564.8.2 g by the 7th day. It was found to be 880.6 g on the 14th day, 991.2 g on the 21st day, 1160 g on the 28th day, and 1302.4 g on the 35th day (Supplementary 4).
3.6 Comparative analysis of cytokines in chickens
Expression of all 10 cytokines (IL-1, IL-2, IL-6, 1L-8, IL-10, IL-15, Interferon-α, Interferon-β, Interferon-γ, and CCL3) was analyzed through Applied Biosystem StepOne RT-PCR and graphs were plotted by using GraphPad Prism version 7. Data shows increase in levels of cytokines from 0-day to 35th day, after intake of transgenic diet. Group 2 chickens fed with transgenic diet have shown an increase of 9-fold, 8-fold, and 12-fold in expression of IL-1 gene at 7th, 14th, and 35th day, respectively as compared to respective control. While group 3 chickens immunized with commercial vaccine have shown an increase of 2-fold, decreased back to 0.5-fold, and then increased to 10-fold at 7th, 14th, and 35th day respectively as compared to respective control. Total 4.2-fold higher expression at 14th day was observed as compared to 0 day, for IL-2 followed by decreased below to 1.8-fold (21st day), and elevation up to 2.2-fold (28th day) and finally decreased to 1.2-fold (35th day). Same pattern of expression of IL-2 was recorded for group 3 chickens where it was first increased to 1.6-fold at 14th day and then gradually decreased to 0.8-fold at 35th day. Gradual increase in expression of IL-6 have also been assessed at 7th day (0.2-fold), 14th day (0.9-fold), 21st day (1.4-fold), 28th day (1-fold) and 35th day (1.5-fold) as compared to 0 day in group 2. While in group 3 IL-6 expression increased to 3.8-fold at 7th day and then slipped downwards. After booster dose it showed an increase of 1-fold at 21st day and gradually decreased at 35th day. Expression of IL-8 increased significantly up to 8-fold (group 2) and 9-fold (group 3) at 28th day; and 18-fold (group 2) and 17-fold (group 3) at 35th day as compared to 0 day. Group 2 and group 3 chickens showed 3.4-fold and 2.8-fold expression of IL-10 at 7th day. For group 2, IL-10 expression decreased to 2.8-fold at 35th day while for group 3, IL-10 expression after booster dose was found to be decreased up to 0.4-fold. Increase in expression of IL-15 was also observed at 7th day (3-fold), 14th day (4-fold), 28th day (7-fold) and 35th day (12- fold) in group2 chicken as compared to control. In group3, increase in IL-15 expression was recorded at 7th day (4.5-fold), 14th day (4-fold), 28th day (8-fold) and 35th day (11-fold). In group 2, INF-α expression gradually increased from 3.5-fold (7th day) to 6.5-fold (14th day). In group 3, expression of INF-α increased to 3.8-fold at 7th day. After booster dose it was found to be increased gradually from 0.5-fold at 21st day, to 2.5-fold at 35th day. Improvement in level of INF-β expression was observed in group 2 at 7th day (4.2-fold) as compared to 0 day. It was found to be decreased back to 0.8-fold at 14th day and then gradually increased to 2.8-fold at 35th day. In group 3, INF-β expression was found to be increased up to 3.8-fold at 7th day. After booster dose it started increasing gradually up to 3-fold at 35th day. Increase in expression of INF-γ was observed up to 11-fold and 8-fold at 21st day; while 6-fold and 3-fold at 35th day, for group 2 and group 3, respectively. CCL3 expression observed to be 4.2-fold, 2.2-fold and 3.8-fold at 7th day, 14th day and 35th day, respectively, for group 2 as compared to 0 day. In group 3, CCL3 gene expression increased to be 1.2-fold at 7th day and decreased back to 0 at 14th day. After second dose of LaSota it was found to be increased back from 0.8-fold at 21st day to 1.4-fold at 35th day. Overall, all the cytokines expression in group 2 manifested comparable results in terms of fold change with respect to group 3 and improvement in levels of expression as compared to control and 0 day (Fig. 5).
Graphical illustration of cell mediated immune response in group 1 (control group), group 2 (transgenic group), and (group 3) commercial vaccine group chickens (a) Expression analysis of IL-1 shows 12-fold increase at 35th day as compared to control and commercial vaccine group. (b) Expression analysis of IL-2 shows 4.2-fold higher expression at 14th day as compared to1.6-fold increase in group 3. (c) Expression analysis of IL-6 shows 1.5-fold increase at 35th day as compared to control and commercialvaccine group respectively. (d) Expression analysis of IL-8 in group 2 and group 3 shows 18-fold and 17-fold increase at 35th day as compared to 0 day. (e) Expression analysis of IL-10 shows 2.8-fold increase at 35th day in group2 and group 3 as compared to group 1. (f) Expression analysis of IL-15 shows 12-fold higher expression at 35th day in group 2 as compared to 0 day and group 1 and group 3. (g) Variable Expression of INF-α was observed. Maximum expression was recorded to be 6.5-fold at 14th day in group 2. (h) Expression analysis of INF-β shows maximum 4.2-fold increase at 7th day as compared to group 1 and group 3. (i) Expression analysis of INF-γ shows 11-fold increase in group 2 at 21st day as compared to group 1 and group 3. (j) Expression analysis of CCL3 shows maximum 4.2-fold increase at 7th day as compared to 0 day. Data shown are average ± SD of three biological replicates. The significance of the data is determined by one-way ANOVA and p < 0.0001 is indicated by ‘’ ****’’ and p < 0.001 is indicated by “***“above bars.
3.7 Antibody titers
HI titer obtained indicates the immune status of chickens. According to OIE regulations, HI titer ≥ 4 log2 was identified as positive for NDV antibody. Maximum level of HI titer of commercial vaccine group chickens and transgenic group chickens at 35th day were recorded 7 log2, 6 log2 as compared to control group chicken 2 log2, respectively (Fig. 6).
Graphical illustration of antibody titer against NDV in chickens. The antibody titer was recorded 7 log2 for commercial; 6 log2 for transgenic, and 2 log2 for control group at 35th day. Data shown are average ± SD of three biological replicates. The significance of the data is determined by one-way ANOVA and p < 0.0001 is indicated by ‘’ ****’’ and p < 0.001 is indicated by “***“above bars.
4 Discussion
ND is a deadly disease in the poultry industry, causing millions of dollars in losses each year. To address viral infections in poultry, several vaccinations have been developed, including live virus vaccines, inactive virus vaccines, vector vaccines, and subunit vaccines, and others (Alexander et al., 2012). All these vaccines require time-consuming purifying procedures and are difficult to keep up with. They necessitate adequate cold storage, as well as skilled personnel to give these vaccines (Aswathi et al., 2014). These limitations lead to a more effective vaccination strategy that can overcome all these restrictions. As a result, oral delivery of plant-based vaccine can be recognized as an effective way to combat infectious diseases in poultry (Guerrero-Andrade et al., 2006). The present study is an attempt to develop oral edible vaccine against NDV to control ND at poultry farms. Codon optimized gene with seed specific zein promoter was utilized to have expression of protein in seeds (Shahid et al., 2020). Agrobacterium-mediated transformation has been achieved to transform HN and F gene in tobacco (Hahn et al., 2007; Ghaffar Shahriari et al., 2016). Corn was used as a host for vaccine production in this study; because of its importance as vital food and ease of administration by mixing in normal chicken diet. Moreover, seeds are considered as highly stable entity as compared to leaves; thus, it can be formulated after some delay in time too (Kurup and Thomas, 2020).
Successful transformation was confirmed through PCR for both F and HN genes as was done by (Ke et al., 2001; Shahriari et al., 2015). To ensure the stability of gene after T0, T1 generation was raised, and seeds were collected. Seeds were ground and fed to Group 2 chickens. Blood was collected after 7 days interval for cell mediated immune response analysis through RT-PCR. In this study, 10 different cytokines were selected for analysis i.e., IL-1, IL-2, IL-6, IL-8, IL-10, IL-15, INF-α, INF-β, INF-γ and CCL3. Cytokines are the key components for cell mediated immunity. T helper type 1 (Th1) activate cell-mediated immunity by releasing cytokines IL-1, IL-2 and interferon and, whereas Th2 stimulate humoral immunity and by releasing IL-6, and IL-10 (Kohut et al., 2001; Nemati et al., 2018). Interleukin 2 (IL-2) is an important cytokine. IL-2 is an important immune-regulatory molecule. It plays a vital role in proliferation and differentiation of T-lymphocytes and B-lymphocytes, respectively (Wu et al., 2020). It is activated by IFN-γ and produced by Natural Killer cells (NK-cells) and CD-4 + T-cells. It is regarded as pivotal in clearing viruses because of its ability to proliferate cytotoxic T- lymphocytes (CTL) and CD8 + T-cells. IFN-α and IFN-γ belongs to type-1 and type-2 interferons, respectively. IFN-α plays an important role in inhibition of viral replication (Martínez-Sobrido et al., 2006) whereas role of IFN-γ as an antivirus is weak (Diby and Lowenthal, 1995).
In this study, IL-2 expression in chickens after having transgenic diet was found to be increased. Data shows that at 14th day its expression was significantly higher and raised up to 4.2-fold as compared to 0 day. The increase in expression of INF-α and INF-γ was calculated to be 2-fold and 11-fold at 35th day and 21st day, respectively. Similar increase in expression of IL-2, INF-α and INF-γ was recorded in a study where chickens were infected with live and attenuated NDV virus and LaSota virus (Balenović et al., 2011; Liu et al., 2012). IL-15 is another important cytokine that resembles to IL-2. Functions of IL-15 are still not well reported. But it is known for its involvement in activity of NK cells, and mast cells. That’s why it is considered pivotal in coping bacterial and viral infections (Choi et al., 1999). In this experiment, it was recorded that IL-15 expression was increased in the chickens fed with transgenic diet. Graph shows that in comparison to 0 day, at 35th day IL-15 ratio was found to be increased gradually up to 12 folds. Similar type of reports has been presented in studies where IL-15 expression was recorded after LaSota infection and an increased expression up to many folds was the outcome (Liu et al., 2012).
The IL-6 was found to have up-regulated expression when chickens were infected with NDV (Rasoli et al., 2014; Xiang et al., 2018) the reason being considered to include as part of cell mediated immune response analysis. The IL-10, also known as anti-inflammatory cytokine, was supposed to have a very important role in cell-mediated immune response. It is found to evolve in crucial inflammatory responses during bacterial, viral, protozoan infections etc. It is produced by different immune cells e.g. dendritic cells, macrophages, B-cells and T-cells (Wu et al., 2016). Data from Real time expression analysis showed that the Group 2 chickens fed with transgenic diet, lead to stimulation of IL-10 the expression during 7th day but it gradually decreased at 35th day. IL-10′s role in chicken immunity to viruses is poorly understood, although new research suggests that, like in mammals, levels of IL-10 expression may be inversely correlated with resistance to infections (Abdul-Careem et al., 2007).
The IL-6 is a pro-inflammatory cytokine that modulates immune response. It is produced by different immune cells i.e., T –cells, B-cells, and hepatocytes etc. (Schneider et al., 2001). RT-PCR graphical data shows an increase in IL-6 expression. When chickens were fed with transgenic diet the expression of IL-6 was found to be up-regulated up to 1.5-fold at 35th day as compared to 0-day. A similar study has shown the increase in IL-6 expression in chickens when they were vaccinated by inactivated ND vaccine (Sedeik et al., 2019). The increase in expression level of IL-1, IL-2 and IL-6 was also evident when chickens were fed with fermented diet (Zhu et al., 2020).
Similarly, IL-8 which is a chemokine and act as a guiding factor that leads polymorphonuclear leukocytes especially neutrophils to the site of infection. Viral and bacterial infections trigger the expression of IL-8 (Liu et al., 2021). The level of IL-8 expression was also recorded to be significantly increased in group 2 chicken from 0-day to 35th (18-fold) day as shown in graph. Similar increase in IL-8 expression was reported in chickens infected with NDV (Rasoli et al., 2014).
The IFN-β like IFN-α plays a vital role in antiviral activity through a set of genes called interferon stimulated genes (ISGs) (Crosse et al., 2018). Significantly higher expression of IFN-β was recorded i.e 2.8-fold at 35th day as compared to 0 day. The IFN-β higher expression in correspondence to downregulation of NDV has been reported while checking the antiviral activity of Olea europaea leaves extract (Salih et al., 2017). The CCL3 (macrophage inflammatory protein 1α, or MIP-1α) is a chemokine that plays a pivotal role in differentiation of T-cells (Luther and Cyster, 2001). In present study, expression of CCL3 was found to be increased up to 4.2-fold and 3.8-fold at 7th and 35th day. Comparable results for the expression of CCL3 has been observed by (Melchjorsen et al., 2003).
An experiment designed with infectious bursal disease virus showed the kinetics of inflammatory and anti-inflammatory genes cytokines differed and were consistent in layer chicken (Xu et al., 2019). However, it has been observed that IL-10 downregulates the expression of IFN-γ. In another study carried out against Marek’s disease, presence of IL-10 and decrease in IFN-γ were found to be associated with vaccine failure (Rasoli et al., 2014). This suggests the effectiveness of plant based edible vaccine. It has been observed that difference in doses can affect the timings of expression of cytokine (Kapczynski et al., 2013). Pattern of expression of cytokines in group 3 is comparable to group 2 and signifies the effectiveness of plant-based vaccine. This reflects that it can be considered as an alternative to treat NDV especially in cases of emergency. Also, booster dose was required in group 3 to augment the cytokines expression as compared to plant-based vaccine. HI titer obtained indicates the immune status of chickens. HI titer ≥ 4 log2 was categorized as positive for NDV antibody, according to OIE standards (Fentie et al., 2014). It was constant in control as they were not taking antigen in the form of vaccine. As we have started giving vaccine to group 2 and 3 from day 0 that’s why HI titer start increasing in them. These findings, however, should be interpreted with caution, and more research through virus challenge assay is required to increase our understanding of the mechanisms involved. However, if the challenge infection experiment is carried out, the same humoral immune responses in groups 2 and 3 offer a hopeful indication of the protective efficiency.
5 Conclusion
Plant-based vaccines are found to be potential candidates against different diseases which can subjugate commercial conventional vaccines. The effectiveness in boosting different cytokines in correspondence to viral infection at different time intervals as interpreted in current study determined its mode to target specific antigen-presenting cells. Further dose-based assessment while being challenged with virus will be beneficial for the end users to prefer oral based vaccine despite of lot to deal with regulatory status. Therefore, a far better understanding of vaccinology and molecular farming can open avenues for animals and plant-based oral vaccines.
6 Research involving human participants and/or animals*a
All procedures in animal research were carried out in compliance with the ethical standards of the Centre of Excellence in Molecular Biology (CEMB) University of the Punjab, Lahore, Pakistan.
Acknowledgments
We thank the Higher Education Commission of Pakistan for financial support for Ph.D. students and CEMB, University of the Punjab for timely availability of research supplies to continue this investigation.
Declaration of Competing Interest
The authors declare that they have no known competing financial interests or personal relationships that could have appeared to influence the work reported in this paper.
References
- Review on Newcastle disease of poultry and its public health importance. J. Vet. Sci. Technol.. 2017;8(3):441.
- [Google Scholar]
- Cytokine gene expression patterns associated with immunization against Marek's disease in chickens. Vaccine. 2007;25(3):424-432.
- [Google Scholar]
- The long view: a selective review of 40 years of Newcastle disease research. Avian Pathol.. 2012;41(4):329-335.
- [Google Scholar]
- Plant based edible vaccines against poultry diseases: A review. Adv. Anim. Vet. Sci.. 2014;2(5):305-311.
- [Google Scholar]
- Abundance of IFN-α and IFN-γ gene transcripts and absence of IL-2 transcripts in the blood of chickens vaccinated with live or inactivated NDV. Acta Vet. Hung.. 2011;59(1):141-148.
- [Google Scholar]
- Immune responses to Newcastle disease virus as a minor zoonotic viral agent. J. Zoonotic Diseases.. 2021;5(4):12-23.
- [Google Scholar]
- A review of virulent Newcastle disease viruses in the United States and the role of wild birds in viral persistence and spread. Vet. Res.. 2017;48(1):1-15.
- [Google Scholar]
- Molecular and functional characterization of chickenIL-15. Dev. Comp. Immunol.. 1999;23(2):165-177.
- [Google Scholar]
- Interferon-stimulated genes as enhancers of antiviral innate immune signaling. J. Innate Immun.. 2018;10(2):85-93.
- [Google Scholar]
- Molecular characterization of Newcastle disease viruses isolated from chickens in Tanzania and Ghana. Viruses. 2020;12(9):916.
- [Google Scholar]
- Cloning and expression of the chicken interferon-γ gene. J. Interferon Cytokine Res.. 1995;15(11):939-945.
- [Google Scholar]
- Effect of vaccination on transmission characteristics of highly virulent Newcastle disease virus in experimentally infected chickens. Avian Pathol.. 2014;43(5):420-426.
- [Google Scholar]
- Expression of Hemagglutinin-Neuraminidase and fusion epitopes of Newcastle Disease Virus in transgenic tobacco. Electron. J. Biotechnol.. 2016;19(4):38-43.
- [Google Scholar]
- Expression of the Newcastle disease virus fusion protein in transgenic maize and immunological studies. Transgenic Res.. 2006;15(4):455-463.
- [Google Scholar]
- Expression of hemagglutinin-neuraminidase protein of Newcastle disease virus in transgenic tobacco. Plant Biotechnol. Reports.. 2007;1(2):85-92.
- [Google Scholar]
- Immune responses of poultry to Newcastle disease virus. Dev. Comp. Immunol.. 2013;41(3):447-453.
- [Google Scholar]
- Molecular characterization of Newcastle disease viruses isolated from recent outbreaks in Taiwan. J. Virol. Methods. 2001;97(1–2):1-11.
- [Google Scholar]
- Moderate exercise is associated with enhanced antigen-specific cytokine, but not IgM antibody production in aged mice. Mech. Ageing Dev.. 2001;122(11):1135-1150.
- [Google Scholar]
- The different expression of immune-related cytokine genes in response to velogenic and lentogenic Newcastle disease viruses infection in chicken peripheral blood. Mol. Biol. Rep.. 2012;39(4):3611-3618.
- [Google Scholar]
- Neutrophils in liver diseases: pathogenesis and therapeutic targets. Cell. Mol. Immunol.. 2021;18(1):38-44.
- [Google Scholar]
- Chemokines as regulators of T cell differentiation. Nat. Immunol.. 2001;2(2):102-107.
- [Google Scholar]
- Inhibition of the type I interferon response by the nucleoprotein of the prototypic arenavirus lymphocytic choriomeningitis virus. J. Virol.. 2006;80(18):9192-9199.
- [Google Scholar]
- Expression and function of chemokines during viral infections: from molecular mechanisms to in vivo function. J. Leukoc. Biol.. 2003;74(3):331-343.
- [Google Scholar]
- Sequencing and analysis of the complete genome of Newcastle disease virus isolated from a commercial poultry farm in 2010. Arch. Virol. 2012;157(4):765-768.
- [Google Scholar]
- Humoral and T cell–mediated immune response against trichomoniasis. Parasite Immunol.. 2018;40(3):e12510.
- [Google Scholar]
- Challenges and Prospects of Plant-Derived Oral Vaccines against Hepatitis B and C Viruses. Plants.. 2021;10(10):2037.
- [Google Scholar]
- Engineering plants as platforms for production of vaccines. Am. J. Plant Sci.. 2020;11(5):707-735.
- [Google Scholar]
- Comparison of three different methods for total RNA extraction from Fritillaria unibracteata, a rare Chinese medicinal plant. J. Med. Plants Res.. 2011;5(13):2835-2839.
- [Google Scholar]
- Pathotypic characterization of Newcastle disease virus isolated from vaccinated chicken in West Java, Indonesia. Veterinary world.. 2017;10(4):438.
- [Google Scholar]
- Alteration in lymphocyte responses, cytokine and chemokine profiles in chickens infected with genotype VII and VIII velogenic Newcastle disease virus. Comp. Immunol. Microbiol. Infect. Dis.. 2014;37(1):11-21.
- [Google Scholar]
- Potential economic impact of Newcastle disease virus isolated from wild birds on commercial poultry industry of Pakistan: A review. Hosts viruses.. 2019;6(1):1-15.
- [Google Scholar]
- A cross talk between the immunization and edible vaccine: Current challenges and future prospects. Life Sci.. 2020;261:118343.
- [Google Scholar]
- Antiviral effects of olea europaea leaves extract and interferon-beta on gene expression of newcastle disease virus. Adv Anim Vet Sci.. 2017;5(11):436-445.
- [Google Scholar]
- Chicken interleukin-6: cDNA structure and biological properties. Eur. J. Biochem.. 2001;268(15):4200-4206.
- [Google Scholar]
- Comparative efficacy of commercial inactivated Newcastle disease virus vaccines against Newcastle disease virus genotype VII in broiler chickens. Poult. Sci.. 2019;98(5):2000-2007.
- [Google Scholar]
- Review on Newcastle Disease in Poultry and its Public Health Importance. British J. Poultry Sci.. 2017;6(2):29-39.
- [Google Scholar]
- Plant-based oral vaccines against zoonotic and non-zoonotic diseases. Plant Biotechnol. J.. 2016;14(11):2079-2099.
- [Google Scholar]
- Early stage development of a Newcastle disease vaccine candidate in corn. Front. Veterinary Sci.. 2020;7:499.
- [Google Scholar]
- Cloning and expression of fusion (F) and haemagglutinin-neuraminidase (HN) epitopes in hairy roots of tobacco (Nicotiana tabaccum) as a step toward developing a candidate recombinant vaccine against Newcastle disease. J. Cell Mol. Res.. 2015;7(1):11-18.
- [Google Scholar]
- Sequence and phylogenetic analysis of virulent Newcastle disease virus isolates from Pakistan during 2009–2013 reveals circulation of new sub genotype. Virology. 2013;444(1–2):37-40.
- [Google Scholar]
- Plant-based oral tolerance to hemophilia therapy employs a complex immune regulatory response including LAP+ CD4+ T cells. Blood, J. Am Soc. Hematol.. 2015;125(15):2418-2427.
- [Google Scholar]
- Analysis of the function of IL-10 in chickens using specific neutralising antibodies and a sensitive capture ELISA. Dev. Comp. Immunol.. 2016;63:206-212.
- [Google Scholar]
- Low-dose Interleukin-2: Biology and therapeutic prospects in rheumatoid arthritis. Autoimmun. Rev.. 2020;19(10):102645
- [Google Scholar]
- Immune responses of mature chicken bone-marrow-derived dendritic cells infected with Newcastle disease virus strains with differing pathogenicity. Arch. Virol. 2018;163(6):1407-1417.
- [Google Scholar]
- Differential expression of pro-inflammatory and anti-inflammatory genes of layer chicken bursa after experimental infection with infectious bursal disease virus. Poult. Sci.. 2019;98(11):5307-5314.
- [Google Scholar]
- Effects of fermented feed on growth performance, immune response, and antioxidant capacity in laying hen chicks and the underlying molecular mechanism involving nuclear factor-κB. Poult. Sci.. 2020;99(5):2573-2580.
- [Google Scholar]
Appendix A
Supplementary material
Supplementary data to this article can be found online at https://doi.org/10.1016/j.jksus.2022.102537.
Appendix A
Supplementary material
The following are the Supplementary data to this article:
Confirmation of F+HN in PUC57 through colony PCR and restriction digestion. (a) Confirmation of 587bp F gene through colony PCR using gene specific detection primer. Lane 1, 1kb ladder, Lane 2-11 amplified 587 bp F gene, Lane 12 negative control (b) Confirmation of 567bp HN gene through colony PCR using gene specific detection primer. Lane 1, 1kb ladder, Lane 2, negative control, Lane 4-9 amplified 567 bp HN gene (c) Confirmation of cloning of F and HN gene along with seed specific promoter in PCAMBIA 1302 through restriction digestion. Recombinant plasmid was digested with Xba1 and BamH1 to confirm the presence of F and HN gene and excised fragment of 6073 bp confirm the presence of F and HN gene.
(a) Transformed Z. mays embryos were planted on MS media plates. Embryos from the inbred lines were transformed with F and HN gene by Agrobacterium-mediated nuclear transformation. (b) 2 days old, transformed Z. mays embryos were grown on MS media for 2 days. (c) 6 days old, transformed Z. mays ready for shifting into glass tubes (d) 8 days old, transformed Z. mays ready in MS medium tubes. Survived plants were transferred into tubes containing MS media. (e) Transformed Z. mays plants were shifted to pots after 12 days. (f) After 12 days remaining survived plants in tubes were transferred to pots. (g) Acclimatization of transformed Z. mays plants by removing plastic covers. 1-month old, transformed Z. mays plants ready for shifting in field after acclimatization. (h) Z. mays transgenic plants in field. Only 12 plants were able to survive, and these plants were shifted to greenhouse. T1 generation of transformed Maize (i) Maize plants (j) Self-pollinated corn.
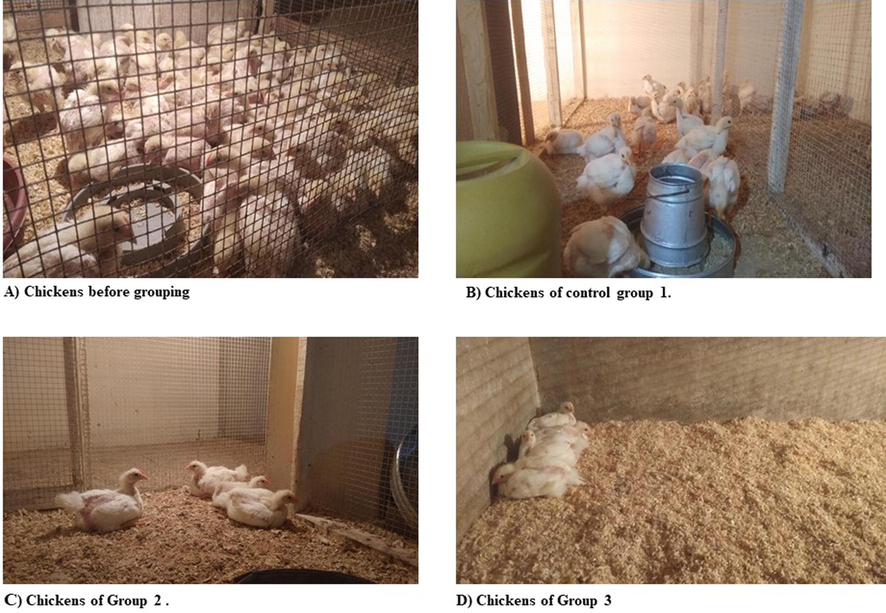
13 days old chickens and their grouping. (a) Chickens before grouping. (b) Chickens of control group 1 having normal diet. (c) Chickens of transgenic group 2 having transgenic diet 2. (d) Chickens of commercial vaccine group 3 having normal diet and were given LaSota vaccine at 0 day and booster dose at 14th day.
Graphical illustration of increase in weight of chickens from 0 day to 35th day. Increase in weight of birds due to intake of diet from day to 35th day was observed in control group chickens (CG) and commercial vaccine group chickens (TC) having normal diet, and transgenic group chickens (TG) having transgenic diet. The figures depict the average SD of three biological replicates. One-way ANOVA is used to determine the significance of the data, and p 0.0001 is denoted by “ ****” and p 0.001 is indicated by “***” above bars.
(a) Blood sampling of chickens from each category after every 7 days interval. (b) Blood samples in EDTA vials.


