Translate this page into:
Presented a fuzzy system to determine barberry product quality based on average color spectra by image processing
*Corresponding author. Tel.: +98 124336191; fax: +98 124336190 hossein.shirgahi@gmail.com (Hossein Shirgahi), h.shirgahi@jouybariau.ac.ir (Hossein Shirgahi),
-
Received: ,
Accepted: ,
This article was originally published by Elsevier and was migrated to Scientific Scholar after the change of Publisher.
Available online 1 July 2010
Abstract
In recent years much research in the field of classification and classification of crops based on characteristics using image processing have been done in this study to determine the level of product quality barberry impurities and the degree of quality we have to use image processing. If the first 100 samples from 10 barberry product quality without gross as the primary data and CMY color mode of the desired color spectrum of each color we set average on the basis of each color a spectrum of color input and output fuzzy variables and fuzzy sets to suit them and determine the appropriate fuzzy rules created brought, then 300 samples of barberry product images with different quality as test data in ourselves and in when testing for accuracy system designed to enhance the image into blocks K*K and the quality of each block based on fuzzy systems implemented quality level of each block separately, and finally we calculate the average rate of making all the block every image quality, the quality of the final product are determined barberry. Based on the experimental results observed by this method was more efficient than previous methods and 98.6% of high precision quality products will determine the barberry.
Keywords
Image processing
Color histogram
CMY color mode
Barberry
1 Introduction
Increase in customer satisfaction is one of the most important objectives that companies producing agricultural products and foods are following (Lee et al., 2008). Today, very careful system of packaging were designed based on image processing algorithms. Scientists did a lot of research to mechanize agricultural operations. Some of this research concerns packaging and classification. Important operations in this research are divided into two groups of classification and detection. Detection is carried out externally using a camera and image processing algorithms. Classification is done using statistical algorithms and data obtained in the phase of detection (Barreio and Zheng, 2008; Brosnan and Sun, 2004).
More research in this area so far has had on the products in the country are owned industry or production or consumption of products that have been more public, but the products produced in developing countries are generally packed and have a traditional grading. Barberry is one of these products. Barberries are thorny shrubs that is 1–5 m tall. The word is red, brown or yellow. The oval-shaped leaves with saw-teeth and his purple fruit tart is oval-shaped. Barberry native temperate and subtropical regions are. Barberry Iran’s largest manufacturers in the world (Esfahani et al., 2008).
This article looks at product quality barberry using image processing algorithms we have set. The study for distinguishing better product impurities barberry from the main product of CMY color mode is used. The most that product generally is seen barberry thorn generally include barberry, barberry leaves, gravel, barberry and premature, etc. Is the fashion color of CMY color barberry are distinct from the main product.
In the second part of the background investigation will be expressed, in Section 3 the proposed method is described in Section 4 tests and tests performed is examined in Section 5 conclusions and final recommendations will be expressed.
2 Background research
In recent years much research in the field of classification and classification of crops based on characteristics using image processing has been that some of the most expresses our.
In a study Automatic classification dates using machine vision system so that they do for product rating date created, based on their system and product image of two important factors in the size and layer of the skin layer acts to date. Quality of their dates with the development of machine vision and reflect near-infrared images and analysis of two-dimensional images, were measured. The system components include: infrared images, vision algorithms, lens, clarifying, and carrier control system is significant increase in the accuracy of product and reduce the cost of grading was (Lee et al., 2008).
In research that was conducted in 2007 to apple color grading based on organization feature parameters studied were apparent in the research, apple color grading system on the four groups (standard Chinese) were evaluated. Their system of a machine vision system is developed that includes a camera CCD, a moving line with step motors are controlled and a light source is. Four 90° angle image is taken from each apple and the color of each image parameter extraction is 17,318 apple in this system were used to that, their system of education beginning with 200 apples were then 118 apple is tested. Methods for classification and SVM neural network is used (Xiaobo and Jiewen, 2007).
Research in 2008 was based on olive product failures that external ratings were then a research model for classification of olive products were examined. Them as their model based on hierarchical feature extraction visual image product (defect appearance and skin products) placed. Their products were classified in seven categories, the results obtained about 75–90% had a Riquelme et al. (2008).
In research that was conducted in 1387 to identify impurities barberry product using image processing algorithms addressed in a research image processing algorithm to identify product impurities barberry has been studied. This algorithm first color image as input issue of product received and then transferred to the field Magenta and then using a threshold image into a two-level image and gross recognition gives them (Esfahani et al., 2008).
In another work that perform in 2008 using technique processing image assessment qualitative barberry paid in. In this paper, image processing technique at measurement materials foreign and rate uniformity fruit barberry has been used. Correlation between assessment sensory factors mentioned and results result of rank categories with use of coefficient solidarity spearman calculation was based on results appropriate correlation method assessment sensory and technique processing image showed (Rajai and Nourbakhsh, 2008).
In another study that was conducted in 2010 barberry rate based on product quality and features mean the color spectrum Histogram CMY color mode is obtained in this paper to eliminate errors caused by overlapping colors mean making use of the image block scheme, the results obtained in this way shows a high precision product quality can be set to barberry (Shirgahi et al., 2010).
3 Proposed method
In this study, early images of the first quality products barberry using the camera 8 mega pixels in RGB color mode we received from the different spectra in different color mode such as RGB, HSB and CMY we examine the features based on color barberry was observed that the product spectrum of color M mode color CMY color for distinguishing features of the product quality, product barberry premature low-quality or product and potential waste product, is very good. Accordingly, the following steps used in this study took:
-
The first 100 files from 10 barberry product quality as the original system data received RGB color mode. Then convert these images from the operation mode to RGB color mode color CMY did that act on a formula based on image pixels is done (Gonzalez and Woods, 2007).
(1) -
Previous research in the field of product barberry, a threshold for the diagnosis of barberry product impurities existing on only one spectrum of the image (or spectrum range M R) conducted in this research method for increasing the accuracy, firstly only a range can not use it every third spectrum C, M and Y with the probability of impact that we use the spectrum more efficiently identify M barberry product for the amount likely to impact more than the other two spectra in we, second, this study for each range from a threshold probability of error is not being used because it is too high, but each of the spectra C, M and Y separately in a fuzzy variable considered based on the values obtained based on pictures samples barberry for each constituency as variables fuzzy considered are set fuzzy needed definition we have in Figs. 1–3 all are you, It should be noted that collections fuzzy variables Fuzzy spectra of C, M, Y share is based on function.
However, average color and tonal range of acceptable C, M and Y for high-quality products barberry from 100 samples barberry image quality is achieved in Table 1 can see.
-
In this section, a fuzzy output variable as the product quality barberry set fuzzy sets it can see in Fig. 4, It should be noted that fuzzy sets Variable output also share is based on function.
-
After the implementation of input and output fuzzy variables and their corresponding fuzzy sets, in part based on the amount of sample quality and amount of products barberry belong to any spectrum color images of each input variable fuzzy sets, the relationship between input and output variables using fuzzy rules set that we can see in Fig. 5. Please note that such effect is greater in the spectrum of M fuzzy rules expressed in the comments got more chance of it.
-
With regard to proposed fuzzy system based on the color spectrum image, the accuracy rate of the system, but took up a large part because of decisions based on the average total color image due to the error rate based on lies can avoid overlapping of block scheme, we use this image as the image input to the K*K blocks divided according to stages of product quality expressed in previous levels for each block of barberry obtains. And finally, with average values of all the block level of quality, total quality level that the desired product quality is barberry obtains.
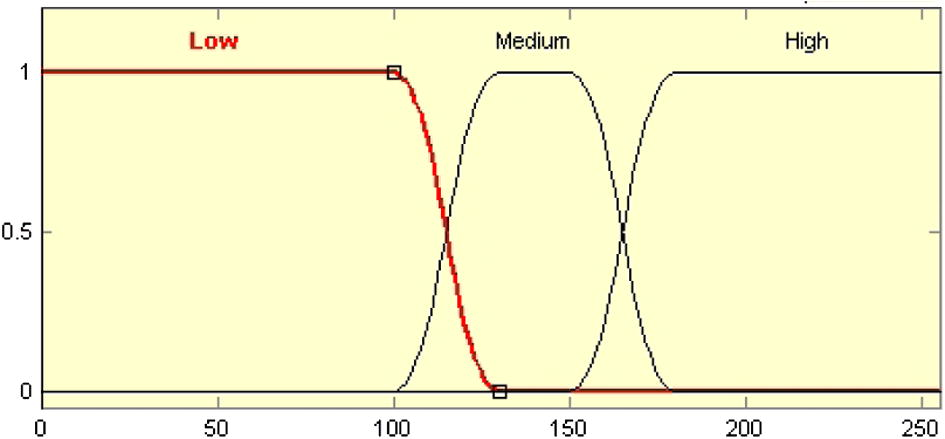
- Fuzzy sets fuzzy variable spectrum C.
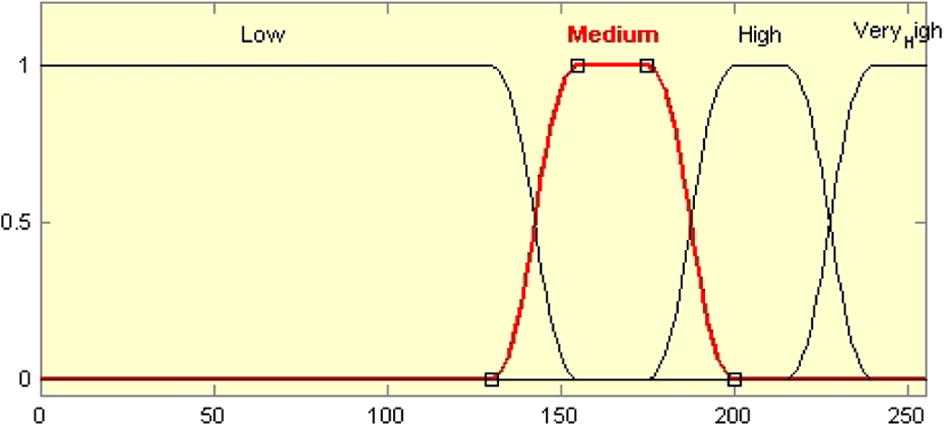
- Fuzzy sets fuzzy variable range M.
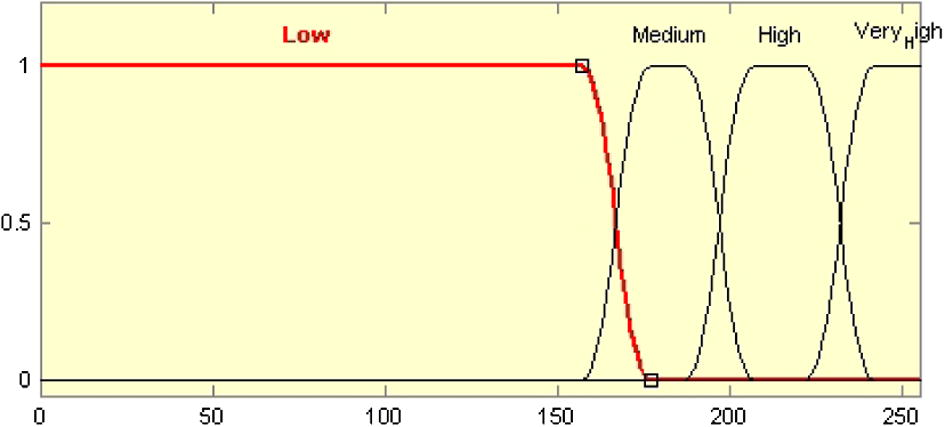
- Fuzzy sets fuzzy variable spectrum Y.
| Spectrum | Average color range | Acceptable confidence interval with probability 1 |
|---|---|---|
| C | 142.5 | [130,150] |
| M | 207.5 | [200,215] |
| Y | 214.5 | [207,222] |
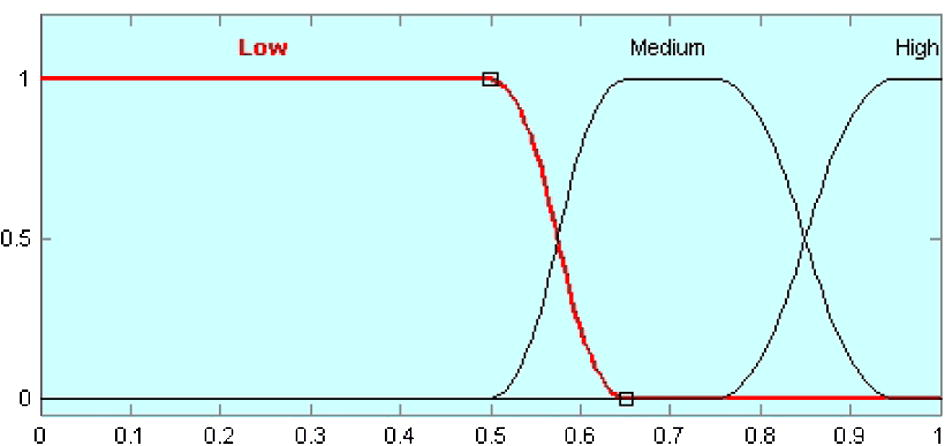
- Fuzzy output variable fuzzy sets.
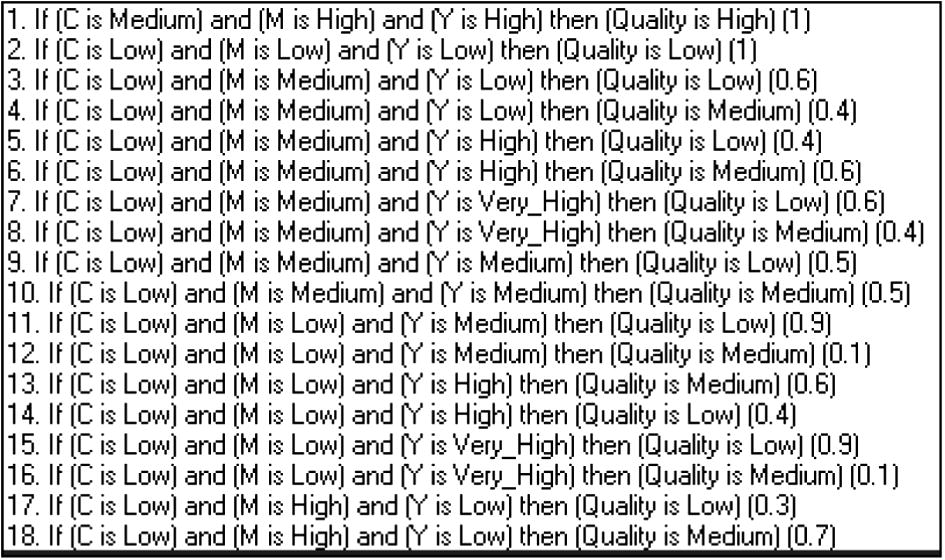
- Some of the fuzzy rules defined.
4 Test results
This Research using software Matlab7 implementation, we first original image 100 from 10 type barberry quality as the original data and the basis to gauge the quality of samples handled in the next. Using these prototypes average spectrum color C, M and Y and get them brought about based on color range of tonal color C, M and Y images fuzzy variables and corresponding fuzzy sets in their design and implementation we have an example of a state administrative system designed to get fuzzy picture quality of the product barberry can see in Fig. 7. Then 200 files to test samples of different quality purple and considered different purity levels and quality of these images from barberry Blocks based on the size of K*K that K from 10 to 50 pixels in England, we have calculated Based on tests conducted on average the best value in this test K value 20 was obtained (Fig. 6). To show the proposed method accuracy than previous methods of approach expressed in Esfahani et al. (2008) also implemented and tested with test samples that we compared the proposed method with the method (Esfahani et al., 2008) in Fig. 8 can see. Moreover, the results based on the proposed method with the traditional method. assessment sensory sample We also compared, for sensory evaluation of samples in five panelist with experience at background assessment barberry, of view rat gross amount and quality barberry colored product in mind and got their ideas happen as a result of traditional methods in ourselves.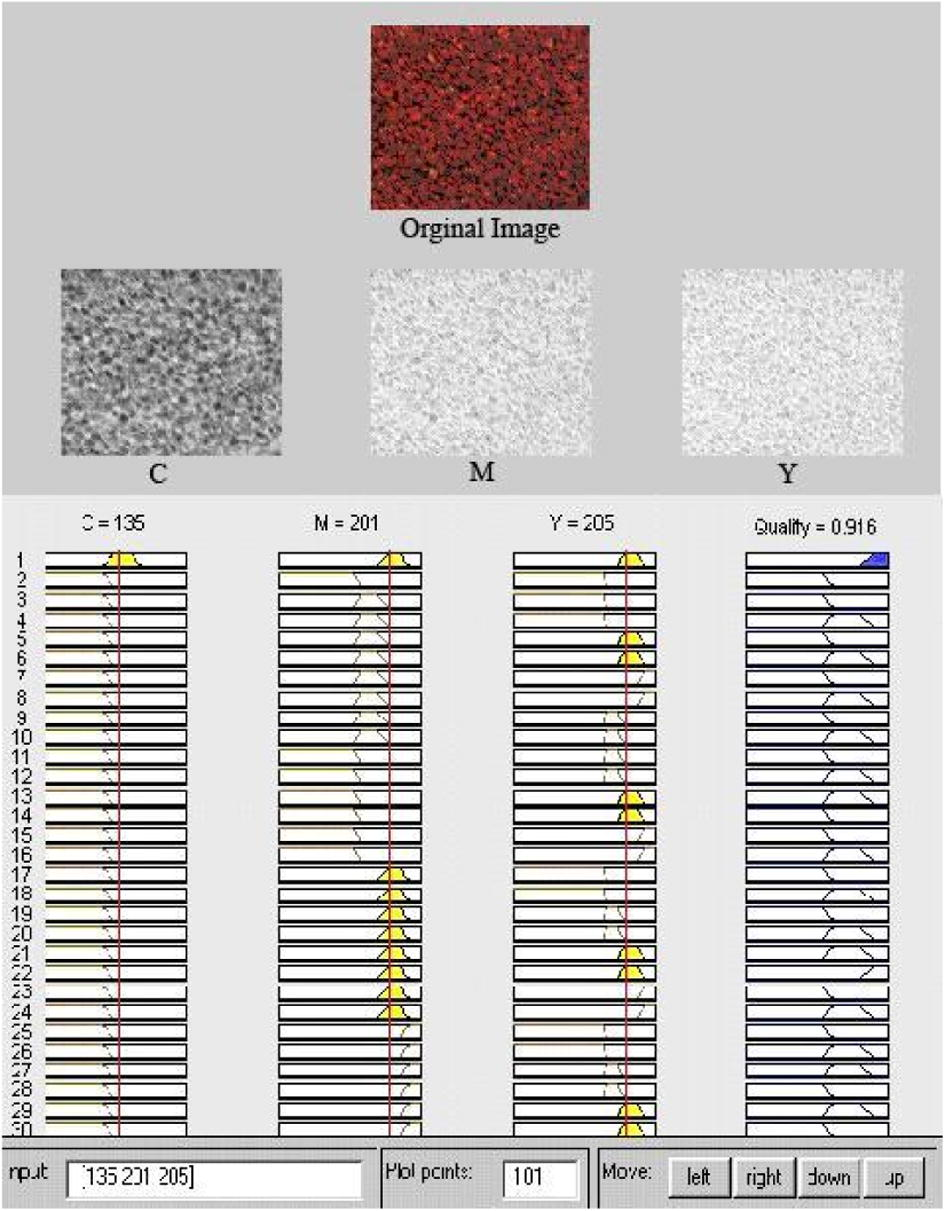
An example of state executive fuzzy system designed.
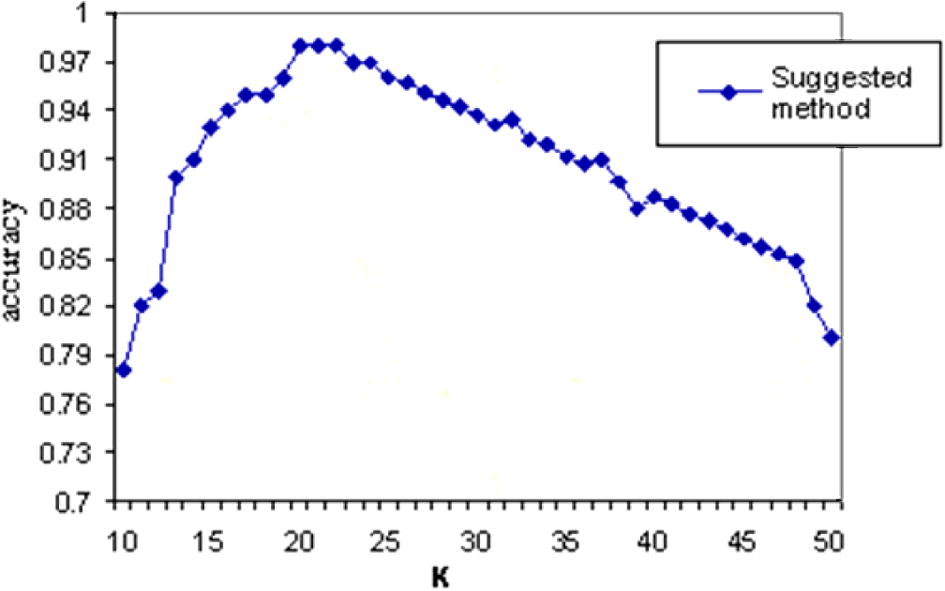
Evaluation of accuracy of the proposed method based on the amount of K.
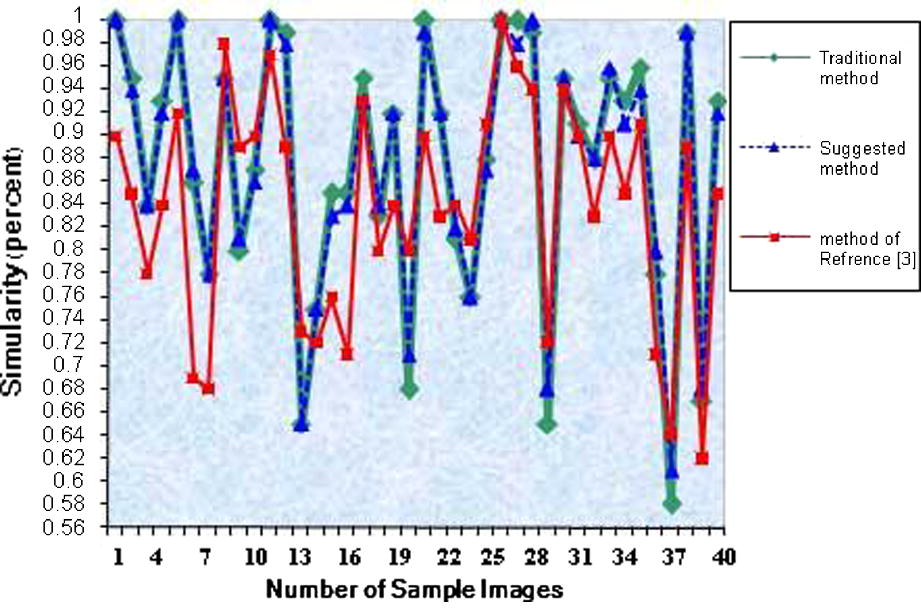
Comparison of similar images using the proposed method and traditional methods (Esfahani et al., 2008).
The system implementation phase of the reasoning expressed max–min stick. Moreover, to obtain the level of product quality barberry fuzzy method we have used to de-average center.
5 Conclusion
After reviewing the tests and trials, the following experimental results were obtained.
Proposed method has been considered an efficient method for the 300 samples tested image, this method with 98.6% accuracy over traditional methods (sensory evaluation) quality setting to barberry.
Proposed method compared to the desired expressed in Esfahani et al. (2008) from an average of 12% to 16% better accuracy.
In addition, the proposed method with the decision and continue to block image using fuzzy sets for fuzzy variables tonal image, side effects, the overall average overlap of the image to have a lot less.
Acknowledgements
We thanks from Financial support of Young Researchers Club, Islamic Azad University, Jouybar Branch.
References
- Non-destructive seed detection in mandarins: comparison of automatic threshold methods in FLASH and COMSPIRA MRIs. Postharvest Biology and Technology. 2008;47(2):189-198.
- [Google Scholar]
- Improving quality inspection of food products by computer vision – a review. Journal of Food Engineering. 2004;61(1):3-16.
- [Google Scholar]
- Identifying impurities apple product using image processing algorithms. In: The first National Conference of Saffron and Barberry. Iran: Islamic Azad University Ghaen; 2008. p. :161-166.
- [Google Scholar]
- Digital Image Processing (third ed.). New York, USA: Addison Wesley Publishing Company; 2007.
- Development of a machine vision system for automatic data grading using digital reflective near infrared imaging. Journal of Food Engineering. 2008;86(3):388-398.
- [Google Scholar]
- Rajai, B., Nourbakhsh, K. Using qualitative assessment of image processing techniques barberry, In: Eighteenth Congress of Science and Food Research Institute Food Khorasan, Mashhad, Iran, 2008, pp. 83–87.
- Olive classification according to external damage using image analysis. Journal of Food Engineering. 2008;87(3):371-379.
- [Google Scholar]
- Determine the quality characteristics based on the average product barberry and histogram color spectra by image processing. In: Eighteenth Iranian Conference on Electrical Engineering. Isfahan, Iran: University of Technology; 2010. p. :180-185.
- [Google Scholar]
- Apple color grading base on organization feature parameters. Pattern Recognition Letters. 2007;28(15):2046-2053.
- [Google Scholar]


