

Translate this page into:
Prediction of triaxial mechanical properties of rocks based on mesoscopic finite element numerical simulation and multi-objective machine learning
⁎Corresponding authors. zhoubo@upc.edu.cn (Bo Zhou), sfeng@upc.edu.cn (Shifeng Xue)
-
Received: ,
Accepted: ,
This article was originally published by Elsevier and was migrated to Scientific Scholar after the change of Publisher.
Peer review under responsibility of King Saud University.
Abstract
The deformation and strength characteristics of rocks are crucial for the effective development of underground resources and the construction of underground engineering projects. In this study, a novel approach is proposed to predict the triaxial mechanical properties of rocks by utilizing mesoscopic finite element numerical simulation and multi-objective machine learning. First, the mesoscopic mechanical properties of rocks are obtained through microscale finite element simulations to generate a training dataset. Then, three machine learning algorithms, namely support vector regression (SVR), artificial neural network (ANN), and random forest (RF), are employed to perform multi-objective machine learning on the triaxial elastic modulus, Poisson's ratio, and compressive strength of rocks, using uniaxial elastic modulus, Poisson's ratio, tensile strength, compressive strength, and confining pressure as feature variables. The performance evaluation, based on 10-fold cross-validation, demonstrates that all three models exhibit excellent predictive capabilities, especially the SVR and RF models, which show high accuracy and correlation, respectively. Among the five feature variables, confining pressure is the most important feature, while uniaxial tensile strength is the least important feature. The absence of uniaxial tensile strength does not significantly impact the predictive performance of the models. These findings offer novel insights into the investigation of the triaxial mechanical properties of rocks.
Keywords
Mesoscopic finite element numerical simulation
Machine learning
Multi-objective prediction
Triaxial Mechanical Properties
Rocks

1 Introduction
Rock deformation and strength play a significant role in geological disasters and engineering accidents in underground engineering construction and resource development. These include collapse, landslides, surface subsidence, and casing damage. Consequently, understanding the mechanical properties of rock is crucial for the efficient development of underground resources and the construction of underground engineering projects.
In the field of geotechnical engineering, the study of rock's mechanical properties has been a focal point. This research is particularly important for understanding the strength and deformation characteristics of rock. The strength characteristics of rock refer to its ability to withstand various stresses, including uniaxial compressive strength, tensile strength, and triaxial compressive strength. On the other hand, the deformation characteristics of rock refer to the amount of deformation it can undergo under load, including elastic modulus and Poisson's ratio. These mechanical properties are essential for assessing the behavior of rock materials.
Rock mechanics testing is a widely used and intuitive approach for studying the mechanical properties of rocks. Various tests, such as uniaxial compression (Xue et al., 2014; Liu et al., 2015), Brazilian splitting (Li et al., 2013; Wang et al., 2020), triaxial compression(Gong et al., 2020; Li et al., 2019), direct shear (Sanei et al., 2015; Bahaaddini et al., 2017), point load (Basu et al., 2010; S. Kahraman, 2014), Schmidt hammer(Çobanoğlu et al., 2008, Aydin et al., 2005), impact (Chen et al., 2022), Los Angeles abrasion (Ajalloeian, et al., 2022), and ultrasonic pulse velocity (ldeeky et al., 2018) tests, have been conducted to investigate these properties. However, these testing methods have certain drawbacks, including long testing cycles, high costs, difficulties in sampling, and significant variability in results.
In recent decades, numerical simulation methods have gained popularity in predicting rock mechanical properties due to advancements in computer technology (Tang et al., 2000; Mahabadi et al., 2010; Golshani et al., 2006; Yang et al., 2014; Park et al., 2009; Bahaaddini et al., 2013). Compared to laboratory testing, numerical simulation allows for precise control of influencing factors. However, accurate prediction of rock mechanical properties relies on the selection of appropriate constitutive models and reliable model calibration. Additionally, numerical simulation methods often suffer from poor convergence and low computational efficiency. These limitations necessitate a theoretical basis and pose challenges for engineering applications. Therefore, there is an urgent need to explore simpler, more efficient, and data-driven methods for predicting rock mechanical properties.
In recent years, the field of geotechnical engineering has witnessed a rapid integration of artificial intelligence (AI) and machine learning (ML) techniques, particularly in the areas of data mining and predictive modeling (Phoon et al., 2023; Zhang et al., 2023; Xie et al., 2022; Zhu et al., 2022; Chou et al., 2016; Tang et al., 2021; Zhang et al., 2022; Marcher et al., 2020). One specific application of machine learning in geotechnical engineering is the prediction of rock mechanical properties. These properties include the elastic modulus (Meng et al., 2023; Zhao et al., 2023; Saad et al., 2018; Gong et al., 2019; Koopialipoor et al., 2022; Li et al., 2019), shear strength parameters (Shen et al., 2018; Puri et al., 2018; Mahmoodzadeh et al., 2022; Hussain et al., 2020), uniaxial tensile strength (Tie et al., 2023), uniaxial compressive strength (Miah et al., 2020; Wei et al., 2022; Ren et al., 2019), triaxial compressive strength (Fathipour-Azar et al., 2022; Hu et al., 2022), and other related properties (Shi et al., 2022; Sun et al., 2020; Meybodi et al., 2022; Zhou et al., 2023).
It is important to note that these machine learning models for predicting rock mechanical properties typically focus on a single target variable at a time. This means that each target variable requires a specific set of corresponding feature variables for accurate prediction. Consequently, multiple target variables necessitate the use of distinct feature variables, different models, and separate hyperparameters. Furthermore, there is no inherent correlation between these target variables in the context of single target machine learning.
The majority of rocks found in nature experience triaxial compressive stress. The strength and deformation properties of rocks under triaxial compressive stress provide a more accurate representation of their mechanical characteristics. Therefore, it is crucial for geotechnical engineering to focus on studying the strength and deformation properties of rocks under triaxial stress rather than solely examining their uniaxial compression strength and deformation characteristics. Experimental results indicated that weak rocks with multiple fractures exhibit an increase in elastic modulus and Poisson's ratio to varying degrees as the confining pressure rises. This increase is attributed to the closure of pores or fractures under the influence of confining pressure. Considering the distinct variations in deformation and strength parameters with confining pressure, it becomes necessary to employ multi-objective machine learning techniques to predict the mechanical properties of rocks under triaxial stress. Multi-objective machine learning utilizes a set of feature variables to describe multiple targets, enabling an accurate and effective representation of the complex relationships between feature variables and target variables, as well as between different target variables.
This study presents a scientific approach by combining meso-scale finite element numerical simulation and multi-objective machine learning techniques to develop a predictive model for the triaxial mechanical properties of rocks. The feature variables comprise uniaxial tensile strength, compressive strength, elastic modulus, Poisson's ratio, and confining pressure. The target variables comprise triaxial elastic modulus, Poisson's ratio, and compressive strength. In order to identify the most effective predictive model, we utilized support vector regression (SVR), artificial neural network (ANN), and random forest (RF) algorithms for model training and conducted a comparative analysis. Furthermore, we conducted importance ranking and selection of feature variables.
2 Data sources
2.1 Numerical model
To investigate the deformation and strength characteristics of rock under varying confining pressures, the author developed a meso heterogeneous model of rock samples using continuum damage mechanics (Wang et al., 2022). This model incorporates the meso heterogeneity of rock materials and the stochastic distribution of defects, enabling the assessment of meso element failure through damage variables. Consequently, the entire process of rock sample failure, from meso damage to macro fracture, can be simulated. Fig. 1 illustrates the numerical calculation model of a standard rock sample in a triaxial compression test. The specimen dimensions are 25 mm × 50 mm, with a unit size of 0.5 mm × 0.5 mm. Fig. 2 illustrates the step-by-step numerical calculation process in detail. Compared to laboratory testing, numerical testing offers several advantages, including versatility, convenience, flexibility, and repeatability. Utilizing this model, we conducted numerical simulations of uniaxial compression, uniaxial tension, and triaxial compression tests on rock samples subjected to different confining pressures.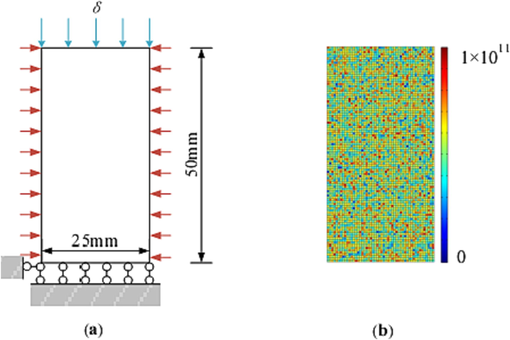
Finite element model of the rock specimen in compression tests, (a) model geometry; (b) mesh grids and initial elastic modulus.
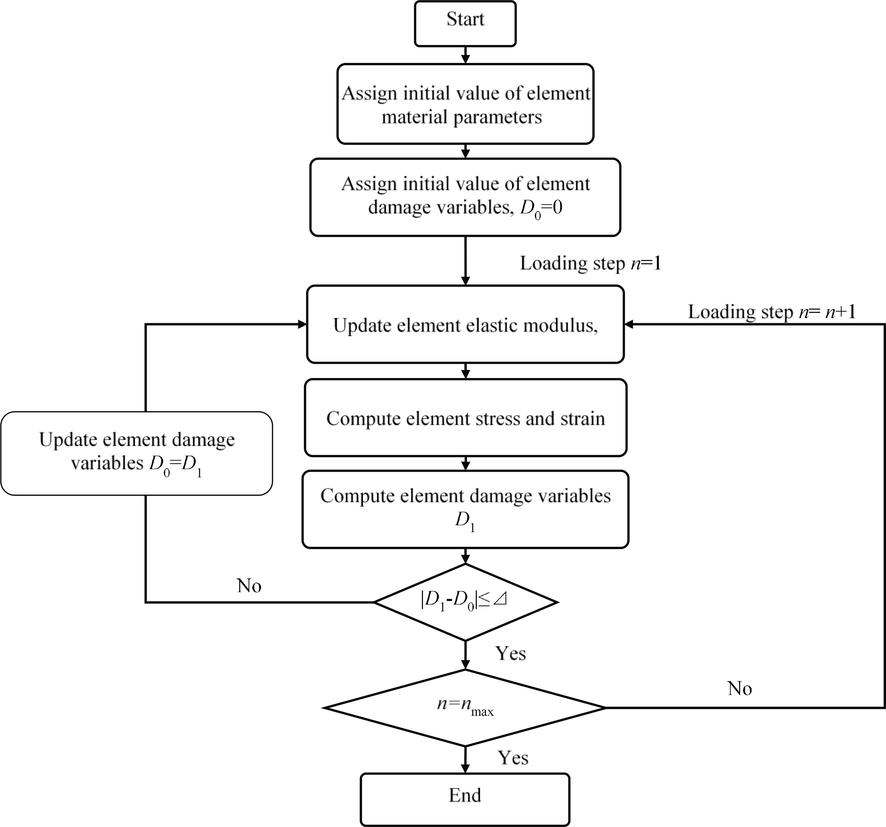
Calculation flowchart of numerical simulation.
The primary input parameters of the numerical model comprise the meso-scale homogeneity, elastic modulus, Poisson's ratio, uniaxial tensile strength and uniaxial compressive strength. Variations in these parameters result in distinct deformation and strength characteristics of rocks. The stress–strain curve of a simulated rock sample, obtained under the specified parameters, is depicted in the Fig. 3.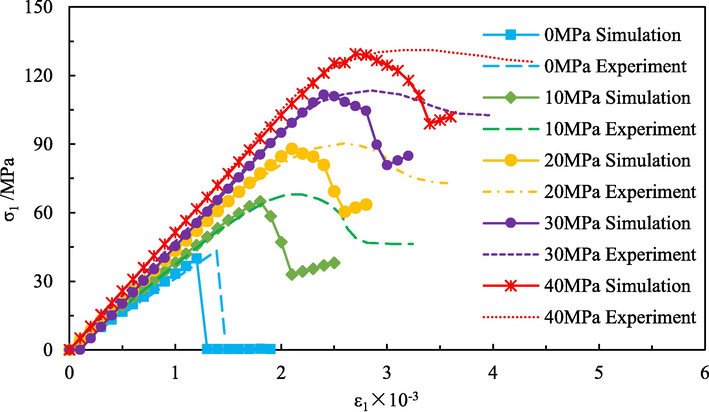
Stress–strain curves under different confining pressures.
2.2 Data collection
The data utilized in this study exclusively originate from numerical simulations. By modifying the input parameters of the numerical model (refer to Table 1), a total of 384 sets of rock mechanics experiments were simulated. These experiments encompassed uniaxial tensile/compression tests and triaxial compression tests conducted under confining pressures of 10, 20, 30, and 40, respectively. Consequently, 384 sets of data were obtained, which included uniaxial elastic modulus, Poisson's ratio, tensile strength, compressive strength, as well as triaxial elastic modulus, Poisson's ratio, and compressive strength under varying confining pressures.
Parameter
Value
meso elastic modulus(GPa)
60, 100
meso Poisson's ratio
0.2, 0.3
meso uniaxial compressive strength
100, 200
meso uniaxial tensile strength
10, 20
meso homogeneity,
3, 4
The sample data for machine learning consists of 384 groups of data. The objective is to investigate the potential for predicting triaxial deformation and strength parameters based on uniaxial deformation and strength parameters of rock materials. The feature variables for machine learning include uniaxial elastic modulus, Poisson's ratio, tensile strength, compressive strength, and confining pressures. The target variables for machine learning are triaxial elastic modulus, Poisson's ratio, and compressive strength. Table 2 presents the minimum, maximum, and average values for each feature variable.
Feature Name
min
max
mean
Macro uniaxial modulus of elasticity (GPa)
50.97
95.43
71.54
Macroscopic uniaxial Poisson's ratio
0.1852
0.2833
0.234
Uniaxial tensile strength
3.059
8.801
5.54
uniaxial compression strength
16.64
61.71
34.56
confining pressure
10
40
25
2.3 Data preparation
Normalization of feature variables is necessary prior to model training. In this study, the linear function normalization technique is employed to normalize the raw data. The normalization formula is expressed as follows:
where, Xnorm represents the normalized data, X denotes the original data, and Xmax and Xmin represent the maximum and minimum values of the original dataset, respectively. This method ensures equal scaling of the original data.
2.4 Correlation analysis of variables
To analyze the linear correlation between variables in the dataset, we employed the Pearson correlation coefficient (Edwards, 1976) for each variable, as depicted in the Fig. 4. A correlation coefficient of 1 indicates a complete positive correlation between the variables, while a coefficient of −1 signifies a complete negative correlation. A coefficient of 0 suggests no linear correlation between the variables. Generally, a correlation coefficient above 0.7 indicates a very close relationship, 0.4 to 0.7 indicates a close relationship, and 0.2 to 0.4 indicates a general relationship.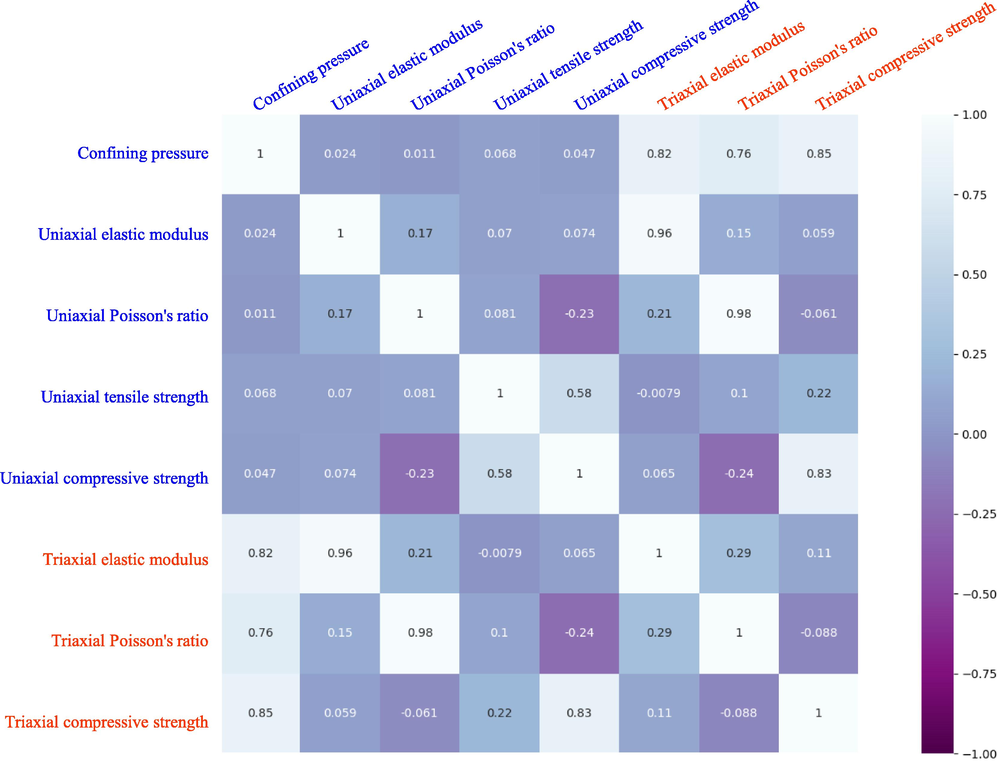
Pearson correlation coefficient for each variable.
Observing the correlation coefficients between the five feature variables, we find that they are all less than 0.7, indicating a lack of very close relationships among the input parameters. Consequently, correlation analysis cannot reduce the feature space. The correlation coefficients between the three target variables are all less than 0.4, suggesting a general or distant relationship between the output parameters. The correlation between the feature variables and target variables is complex. Specifically, uniaxial elastic modulus, uniaxial Poisson's ratio, and uniaxial compressive strength are closely related to triaxial elastic modulus, triaxial Poisson's ratio, and triaxial compressive strength, respectively, but are far from other output parameters. On the other hand, the relationship between confining pressure and the three output parameters is very close, while the relationship between uniaxial tensile strength and the three output parameters is distant or general.
Based on the aforementioned analysis, considering accuracy and computational efficiency, this study selects the Support Vector Regression (SVR), Artificial Neural Network (ANN), and Random Forest (RF) algorithms to establish triaxial mechanical properties prediction models and compares the prediction results. The algorithms used in this study are all sourced from the open-source algorithm package in scikit-learn.
3 Model performance evaluation
To objectively assess the generalization capability of various models, while considering the stability and operational efficiency of the evaluation metrics, the dataset is partitioned using the cross-validation method. Specifically, the dataset is randomly divided into 10 subsets of equal size. Each iteration involves using the union of 9 subsets as the training set, while the remaining subset serves as the test set. This process is repeated 10 times, resulting in 10 sets of training and test sets. The average value of the 10 test results is then calculated as the final outcome.
Following the 10-fold cross-validation, this study employs the Pearson correlation coefficient (R), relative root mean square error (RRMSE), determination coefficient (R2), and mean absolute percentage error (MAPE) as performance evaluation metrics for the prediction model. These metrics are defined as follows:
where, , ,and represents the actual value, the predicted value and the average value of the actual value and the predicted value respectively. The coefficient R ranges between −1 and 1. R ranges between −1 and 1. A higher absolute value indicates a stronger correlation between the predicted and actual values, while a lower absolute value indicates a weaker correlation. RRMSE and MAPE range between 0 and +∞, with smaller values indicating higher prediction accuracy of the model. R2 ranges between 0 and 1, with larger values indicating higher model accuracy.
4 Prediction models of triaxial mechanical properties
4.1 SVR
SVR, which stands for Support Vector Regression, is a regression algorithm based on support vector machines. Its core objective is to find a hyperplane that minimizes the distance between the sample points and the hyperplane. Specifically, the goal is to minimize the sum of squared errors between the predicted values of the model and the true values, while maximizing the margin. By introducing Lagrange multipliers and kernel functions, the optimization problem of SVR can be transformed into a dual problem, which can be solved using convex optimization methods. The predicted values of the model can be calculated using kernel functions, and the bias term can be computed using the samples from the support vector set. One of the main advantages of SVR is that its computational complexity does not depend on the dimensionality of the input space. It is also robust to outliers and has low computational cost. Additionally, it exhibits excellent generalization ability and high prediction accuracy, making it perform well in handling nonlinear regression problems.
The SVR hyperparameters primarily include the kernel type, regularization parameter C, and kernel coefficient gamma. The regularization parameter C is used to control the complexity of the model, while gamma is used to control the influence range of the kernel function. The optimized values of SVR hyperparameters in this study are displayed in Table 3.
Parameter
Value
Kernel type
rbf
C
100
gamma
1
The comparison of predicted values and actual values for the targets, based on the SVR model, is presented in Fig. 5. It is evident that the predicted values closely match the actual values for all three targets. The R values obtained through 10-fold cross-validation for the triaxial elastic modulus, Poisson's ratio, and compressive strength are 0.9881, 0.9926, and 0.9884, respectively. The corresponding Root Relative Mean Squared Error (RRMSE) values are 2.75%, 2.08%, and 3.75%. The average R and RRMSE values are 0.9874 and 2.86%, respectively, indicating a high predictive capability of the SVR model. Notably, the SVR model demonstrates higher accuracy in predicting the triaxial Poisson's ratio compared to the triaxial elastic modulus and compressive strength. This suggests a stronger correlation between the triaxial Poisson's ratio and the input parameters, indicating its greater sensitivity to variations in the input parameters compared to the triaxial elastic modulus and compressive strength.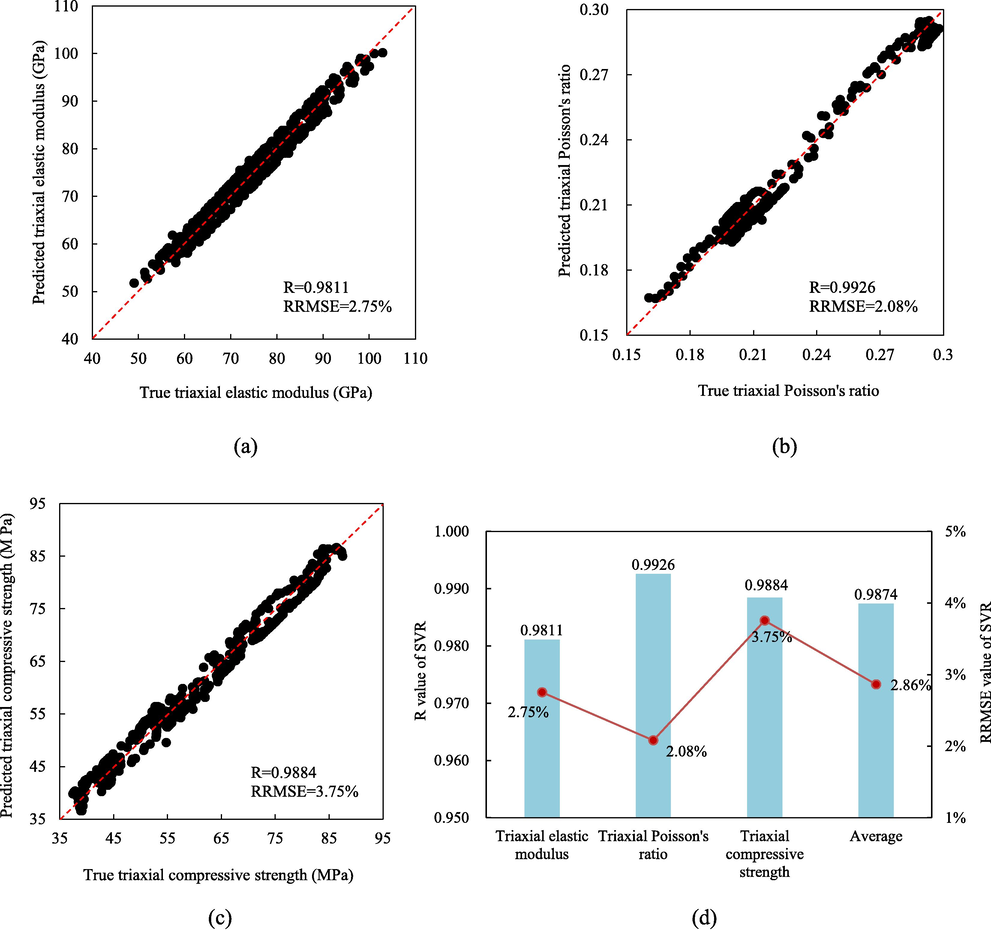
The comparison of predicted values and actual values for the targets based on SVR, (a) Triaxial elastic modulus; (b) Triaxial Poisson’s ratio; (c) Triaxial compressive strength; (d) R and RRMSE values obtained through 10-fold cross-validation.
4.2 ANN
ANN (Artificial neural network) is a computational model that simulate the structure and function of biological neural networks. ANN consists of a large number of nodes (also known as “neurons” or “units”) that are interconnected, allowing them to model complex relationships between data. ANN can be classified into multi-layered and single-layered networks, with each layer containing multiple neurons. The neurons are connected to each other through directed arcs with variable weights. By repeatedly learning from known information and adjusting the weights of neuron connections, ANN is able to process information and simulate the relationships between inputs and outputs. Unlike traditional data processing methods, ANN does not require knowledge of the exact relationship between inputs and outputs, but rather focus on non-constant factors that cause output changes. As a result, ANN has significant advantages in handling fuzzy data, random data, and nonlinear data, making them particularly suitable for large-scale, complex, and uncertain systems.The optimized values of ANN hyperparameters in this study are displayed in Table 4.
Parameter
Value
Hidden layers no
1
activation
reLu
Number of hidden layer neurons
300
Optimizer
Adam
Loss
MAPE
epochs
500
batch_size
384
verbose
0
Validation_split
0.2
Similarly, the accuracy of the ANN model in predicting the three-axis Poisson's ratio is higher than that for the three-axis elastic modulus and compressive strength.
The comparison of predicted values and actual values for the targets, based on the Artificial Neural Network (ANN) model, is presented in Fig. 6. It is evident that the predicted values closely align with the actual values for all three targets. The R values obtained through 10-fold cross-validation for the three-axis elastic modulus, Poisson's ratio, and compressive strength are 0.9969, 0.9972, and 0.9992, respectively. The corresponding Relative Root Mean Square Error (RRMSE) values are 8.65%, 4.53%, and 7.53%. The mean R and RRMSE values are 0.9977 and 6.90%, respectively, indicating that the ANN model yields accurate and acceptable predictions. Furthermore, the accuracy of the ANN model in predicting the triaxial Poisson's ratio is superior to that of the triaxial elastic modulus and compressive strength, similar to the previous SVR model. In comparison to the previous SVR model, the ANN model demonstrates stronger correlation between predicted and actual values, albeit with slightly lower prediction accuracy.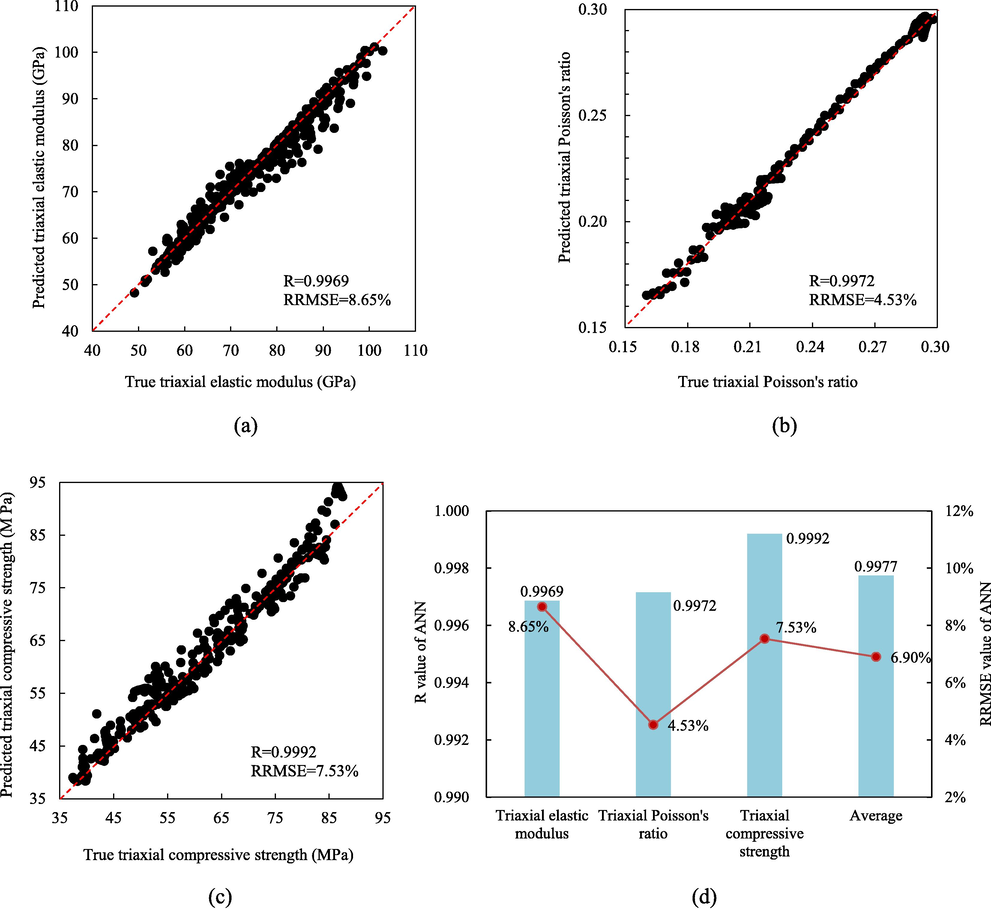
The comparison of predicted values and actual values for the targets based on ANN, (a) Triaxial elastic modulus; (b) Triaxial Poisson’s ratio; (c) Triaxial compressive strength; (d) R and RRMSE values obtained through 10-fold cross-validation.
4.3 RF
RF (Random Forest) is a machine learning algorithm based on ensemble learning, widely used for regression problems. It models the data by using multiple decision trees and integrates their prediction results to improve the performance and stability of the model. The basic principles of the Random Forest algorithm are as follows: (1) Randomly select a subset of training data and train a decision tree model on it. (2) Repeat the above process multiple times on the entire dataset, each time selecting a different subset of data and training multiple decision tree models. (3) Combine the prediction results of multiple decision tree models to obtain the final prediction result. The advantages of Random Forest include: (1) It can handle high-dimensional data and large-scale datasets. (2) It has good generalization performance and can effectively reduce the risk of overfitting. (3) It can handle missing values and outliers. (4) It exhibits strong fitting capability for data with nonlinear relationships.
The hyperparameters of RF mainly include n_estimators, max_features, min_samples_split, min_samples_leaf, and max_depth. The n_estimators is responsible for controlling the number of decision trees within the random forest. The max_features determines the number of features available for splitting at each node. The min_samples_split sets the minimum number of samples required to split an internal node. The min_samples_leaf sets the minimum number of samples required to form a leaf node. Lastly, the max_depth controls the maximum depth of the decision tree. The optimized values of RF hyperparameters in this study are displayed in Table 5.
Parameter
Value
n_estimators
100
max_features
sqrt
min_samples_split
2
min_samples_leaf
1
max_depth
19
The comparison between the predicted values and the true values of the targets based on the RF model is shown in Fig. 7. The predicted values closely align with the actual values for all three targets. The R values obtained from 10-fold cross-validation for the triaxial elastic modulus, Poisson's ratio, and compressive strength are 0.9999, 0.9987, and 0.9994, respectively. The corresponding RRMSE values are 6.29%, 5.54%, and 5.61%. The mean R and RRMSE values are 0.9993 and 5.81%, respectively. Similar to the previously mentioned ANN model, the RF model also provides good and acceptable predictions. Additionally, the accuracy of the RF model in predicting the triaxial Poisson's ratio is slightly higher than that for the triaxial elastic modulus and compressive strength.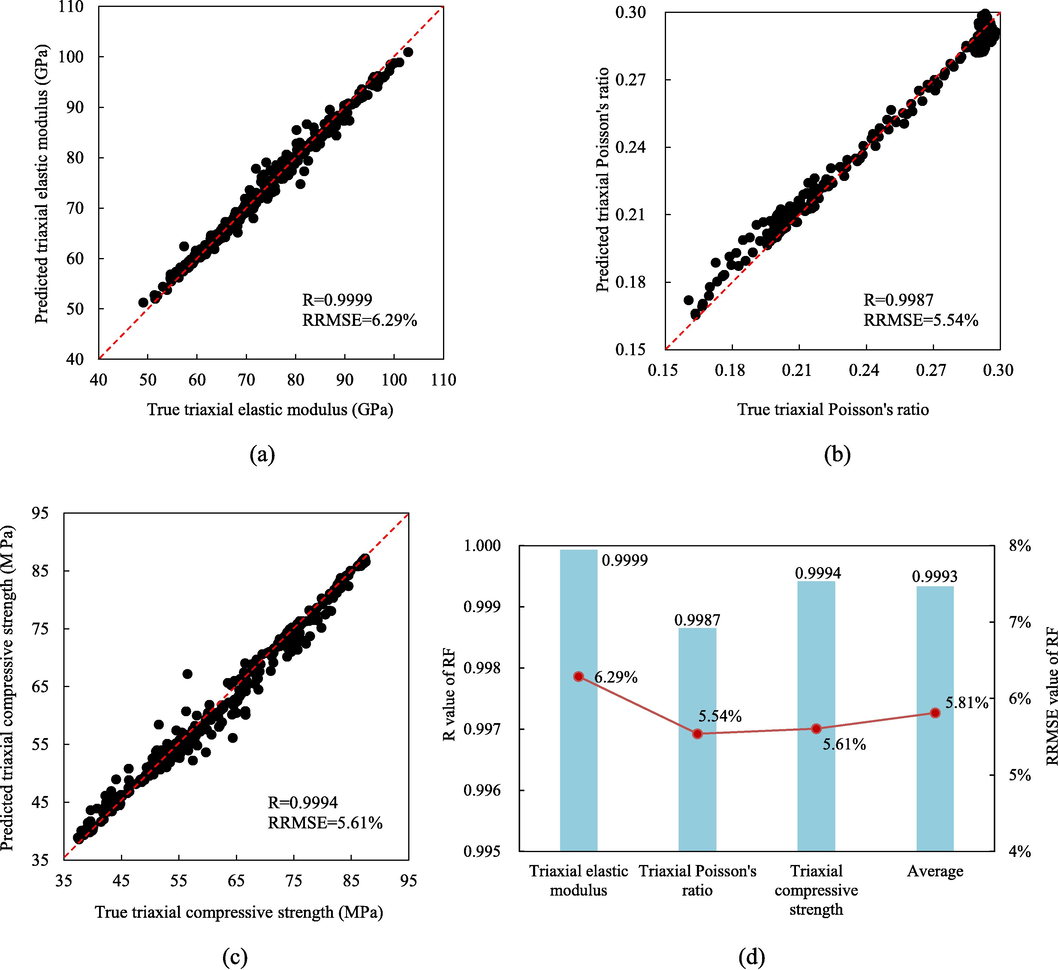
The comparison of predicted values and actual values for the targets based on RF, (a) Triaxial elastic modulus; (b) Triaxial Poisson’s ratio; (c) Triaxial compressive strength; (d) R and RRMSE values obtained through 10-fold cross-validation.
4.4 Results comparison
To determine the most effective predictive model for forecasting triaxial mechanical performance parameters, a comparative analysis of three machine learning models was conducted in this study. The predictive results were evaluated and compared using statistical evaluation metrics, as shown in Table 6 and Fig. 8.
Parameter
Method
R
Score
RRMSE
Score
R2
Score
MAPE
Score
Total score
Triaxial
elastic
modulusSVR
0.9811
1
0.0275
3
0.9659
2
0.0250
3
9
ANN
0.9969
2
0.0806
1
0.9641
1
0.0651
1
5
RF
0.9999
3
0.0629
2
0.9838
3
0.0572
2
10
Triaxial
Poisson's
ratioSVR
0.9926
1
0.0208
3
0.9858
1
0.0192
3
8
ANN
0.9972
2
0.0330
2
0.9946
3
0.0284
2
9
RF
0.9987
3
0.0554
1
0.9904
2
0.0589
1
7
Triaxial
compressive
strengthSVR
0.9884
1
0.0375
3
0.9693
2
0.0359
3
9
ANN
0.9992
2
0.0718
1
0.9631
1
0.0563
2
6
RF
0.9994
3
0.0561
2
0.9866
3
0.0639
1
9
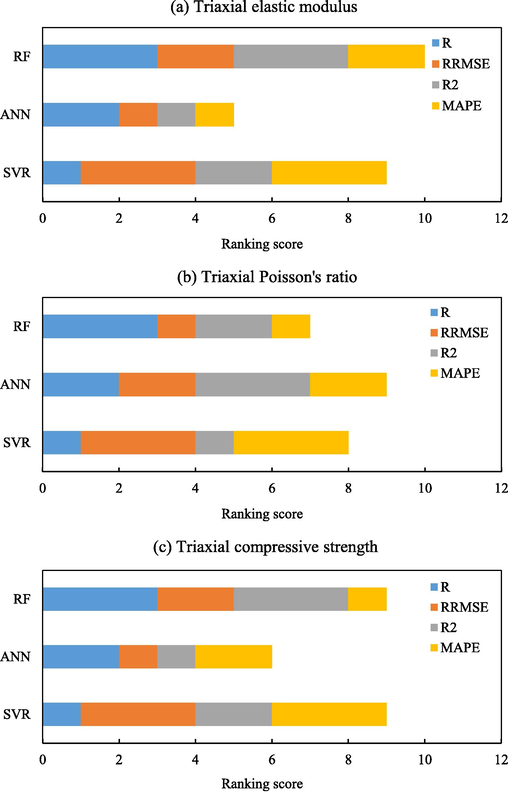
The comparison of ranking scores of three machine learning models.
Based on the results, it can be concluded that among the three models, the ANN model exhibits the poorest predictive performance in terms of predicting the triaxial mechanical properties. On the other hand, SVR and RF models demonstrate relatively better predictive performance. Specifically, the SVR model exhibited higher accuracy in its predictions, while the RF model showed a stronger correlation.
5 Feature importance ranking and selection
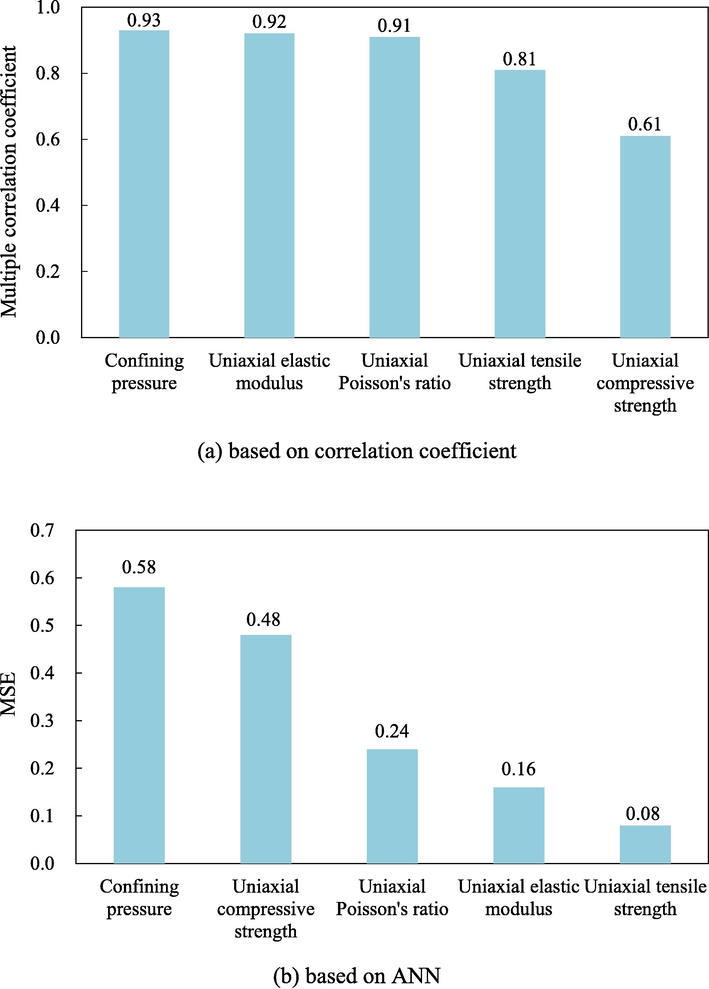
During the training phase of the three aforementioned predictive models, the dataset comprised five distinct feature variables: uniaxial elastic modulus, Poisson's ratio, tensile strength, compressive strength, and confining pressure. However, in practical engineering scenarios, it is often impractical to gather all five feature variables. The absence of a specific input parameter or feature variable can have varying effects on the predictive performance of the model. To assess the significance of each input parameter in predicting the triaxial mechanical properties of rocks, we employed three methods: correlation coefficient, ANN, and RF. These methods were used to rank the importance of the five feature variables relative to the target variable, thereby evaluating the contribution of each input parameter.
Fig. 9(a) displays the feature importance ranking determined by the absolute value of the multiple correlation coefficient. The multiple correlation coefficient, denoted as R, is calculated as the Pearson correlation coefficient between the multiple variable,
, and the features. The multiple target variable,
, is obtained by aggregating the normalized single targets,
with equal weights, i.e.,
.
Feature importance ranking.
Feature importance ranking.
Fig. 9(b) displays the feature importance ranking obtained using ANN. The ANN employs the permutation method to assess feature importance. This method involves shuffling a specific feature and observing the resulting change in the MSE metric. A larger change in the metric signifies a more significant feature.
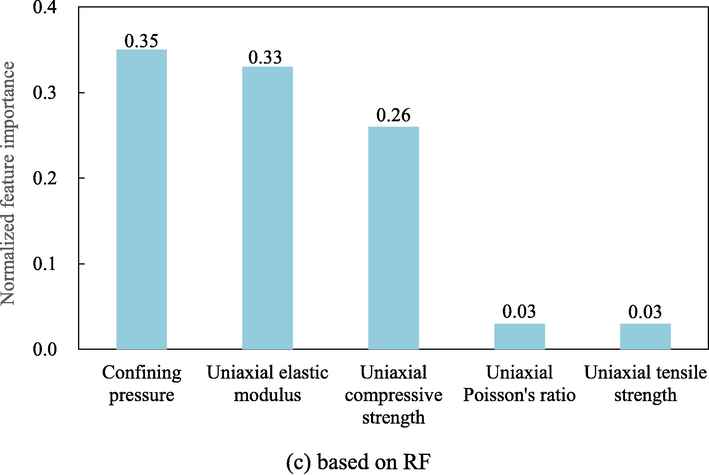
Fig. 9(c) displays the feature importance ranking obtained using RF. RF determines feature importance by calculating the reduction in average impurity across all decision trees in the forest. Subsequently, all the obtained importance scores are normalized.
Among the three rankings, confining pressure consistently ranks first, indicating that it is the most critical feature. Conversely, the uniaxial tensile strength is consistently ranked at the bottom, suggesting that it is the least important feature. None of the three methods' rankings exhibit features with completely conflicting levels of importance.
Next, we will explore the feasibility of reducing the feature space, i.e., feature selection, in the prediction of triaxial mechanical properties of rocks based on the ranking results of feature importance from the ANN and RF models. We systematically increase the number of features from 2 to 5 in order of importance and assess the changes in performance evaluation indicators with respect to the number of features. Fig. 10 illustrates the relationship between the performance evaluation metrics, namely R and RRMSE, and the number of features.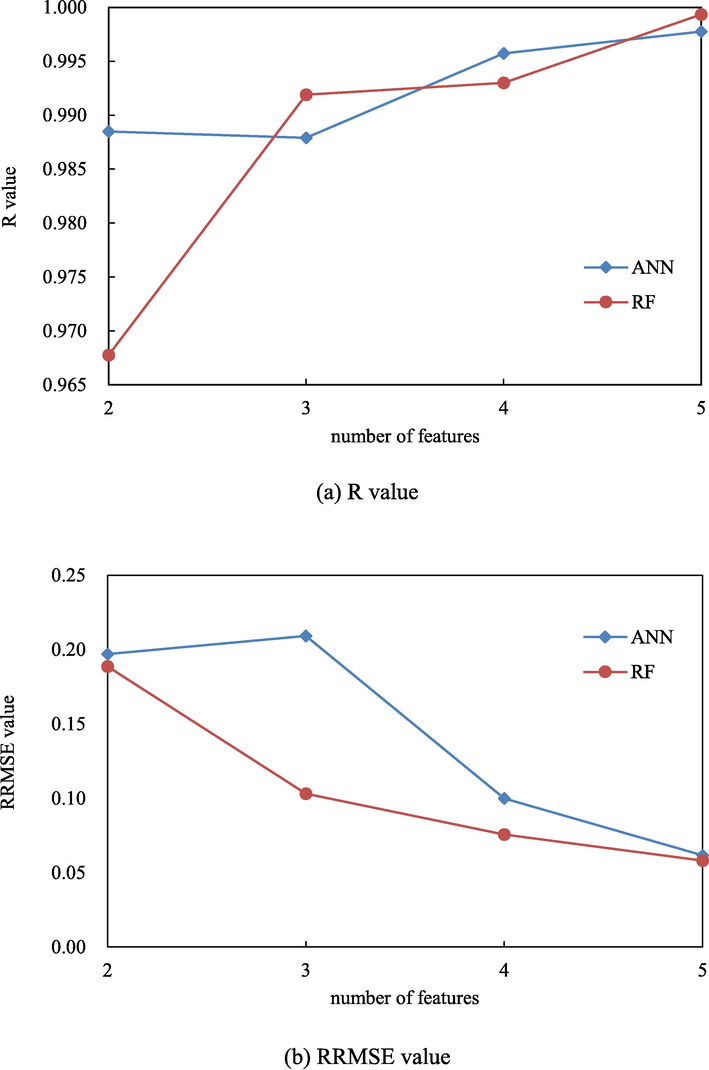
The relationship between the performance evaluation metrics and the number of features.
Our findings reveal that as the number of features increases, the R value continuously increases, while the RRMSE value continuously decreases, indicating an improvement in the predictive performance of the models with an increasing number of features. However, it is important to note that the rate of improvement in the performance evaluation indicators diminishes as the number of features increases. When the number of features increases from 4 to 5, the R values obtained from the ANN and RF models only increase by 0.002 and 0.006, respectively, while the RRMSE values decrease by only 0.038 and 0.017, respectively. This suggests that if the uniaxial tensile strength is excluded and only 4 feature variables are retained, the decrease in predictive performance of the models is not significant, and the predicted results remain acceptable.
6 Conclusions
This paper introduces a novel prediction model for the triaxial mechanical properties of rocks based on mesoscale finite element numerical simulation and multi-objective machine learning techniques. The model is capable of predicting the triaxial mechanical properties of rocks based on their uniaxial mechanical properties and confining pressure. The mesoscale finite element model has been validated through experiments and utilized to calculate the macroscopic mechanical properties of rocks. By establishing correlations between the uniaxial mechanical properties (such as elastic modulus, Poisson's ratio, tensile strength, and compressive strength) and the triaxial mechanical properties (including elastic modulus, Poisson's ratio, and compressive strength), a training dataset is generated for the machine learning algorithms. Three multi-objective machine learning methods, namely Support Vector Regression (SVR), Artificial Neural Network (ANN), and Random Forest (RF), are employed to establish the prediction models. The predictive performance of the three models is evaluated using 10-fold cross-validation. The main conclusions are as follows:
-
(1)
The average R and RRMSE values of the three models are R = 0.9874, RRMSE = 2.86% (SVR), R = 0.9977, RRMSE = 6.90% (ANN), and R = 0.9993, RRMSE = 5.81% (RF). All three models demonstrate reliable prediction capabilities for the triaxial mechanical properties of rocks, with a slightly higher accuracy in predicting the triaxial Poisson's ratio compared to the triaxial elastic modulus and compressive strength.
-
(2)
The comprehensive ranking, based on four performance evaluation metrics (R, RRMSE, R2, and MAPE), indicates that the artificial neural network (ANN) model exhibits relatively poor prediction performance, while the support vector regression (SVR) and random forest (RF) models demonstrate relatively good prediction performance. Specifically, the SVR model demonstrates higher accuracy in prediction, while the RF model shows a stronger correlation.
-
(3)
The feature importance ranking, based on three methods (correlation coefficient, ANN, and RF), reveals that among the five feature vectors, confining pressure is the most important feature, while uniaxial tensile strength is the least important feature. As the number of features increases from 2 to 5, the predictive performance of the models gradually improves, but the improvement rate of the evaluation metrics decreases. If uniaxial tensile strength is excluded and only four feature variables, namely uniaxial elastic modulus, Poisson's ratio, compressive strength, and confining pressure, are retained, the predictive performance of the models does not significantly decrease, and the prediction results remain acceptable.
-
(4)
This study presents a novel approach for investigating the triaxial mechanical properties of rocks under varying confining pressures.
Acknowledgement
The authors of this paper acknowledge the supports from the National Natural Science Foundation of China (Grant NO.51804323) and the Independent Innovation Research Program of China University of Petroleum (East China) (Grant No. 27RA2215005) and the National Key Research and Development Program of China (Grant No. 2017YFC0307604).
Declaration of Competing Interest
The authors declare that they have no known competing financial interests or personal relationships that could have appeared to influence the work reported in this paper.
References
- Effect of Boundary Condition on the Shear Behaviour of Rock Joints in the Direct Shear Test. Rock Mech. Rock Eng.. 2017;50:1141-1155.
- [Google Scholar]
- Numerical direct shear tests to model the shear behaviour of rock joints. Comput. Geotech.. 2013;51:101-115.
- [Google Scholar]
- Point load test on schistose rocks and its applicability in predicting uniaxial compressive strength. Int. J. Rock Mech. Min. Sci.. 2010;47(5):823-828.
- [Google Scholar]
- Experimental study on the impact disturbance damage of weakly cemented rock based on fractal characteristics and energy dissipation regulation. Theor. Appl. Fract. Mech.. 2022;122:103665
- [Google Scholar]
- Metaheuristic optimization within machine learning-based classification system for early warnings related to geotechnical problems. Autom. Constr.. 2016;68:65-80.
- [Google Scholar]
- Estimation of uniaxial compressive strength from point load strength, Schmidt hardness and P-wave velocity. Bull. Eng. Geol. Environ.. 2008;67:491-498.
- [CrossRef] [Google Scholar]
- Hybrid machine learning-based triaxial jointed rock mass strength[J] Environ. Earth Sci.. 2022;81(4):118.
- [Google Scholar]
- A micromechanical model for brittle failure of rock and its relation to crack growth observed in triaxial compression tests of granite. Mech. Mater.. 2006;38(4):287-303.
- [Google Scholar]
- Gong,* Y., Mehana, M., El-Monier, I. et al. 2019. Machine learning for estimating rock mechanical properties beyond traditional considerations. [C]//Unconventional Resources Technology Conference, Denver, Colorado, 22–24 July 2019. Unconventional Resources Technology Conference (URTeC); Society of Exploration Geophysicists. 466-480.
- Evaluation of Shear Strength Parameters of Rocks by Preset Angle Shear, Direct Shear and Triaxial Compression Tests. Rock Mech. Rock Eng.. 2020;53:2505-2519.
- [CrossRef] [Google Scholar]
- Predicting triaxial compressive strength of high-temperature treated rock using machine learning techniques[J] Journal of Rock Mechanics and Geotechnical Engineering 2022
- [Google Scholar]
- Prediction of Rock Mechanical Properties from Geochemical Signatures using Machine Learning Algorithm[C]//Abu Dhabi International Petroleum Exhibition and Conference. SPE 2020 D012S116R043
- [Google Scholar]
- The determination of uniaxial compressive strength from point load strength for pyroclastic rocks. Eng. Geol.. 2014;170:33-42.
- [Google Scholar]
- Introducing stacking machine learning approaches for the prediction of rock deformation[J] Transp. Geotech.. 2022;34:100756
- [Google Scholar]
- Prediction of Engineering Properties of Basalt Rock in Jordan Using Ultrasonic Pulse Velocity Test. Geotech. Geol. Eng.. 2018;36:3511-3525.
- [CrossRef] [Google Scholar]
- The brazilian disc test for rock mechanics applications: Review and new insights. Rock Mech. Rock Eng.. 2013;46:269-287.
- [CrossRef] [Google Scholar]
- Rock brittleness evaluation based on energy dissipation under triaxial compression. J. Pet. Sci. Eng.. 2019;183:106349
- [Google Scholar]
- Static and dynamic uniaxial compression tests on coal rock considering the bedding directivity. Environ. Earth Sci.. 2015;73:5933-5949.
- [CrossRef] [Google Scholar]
- An example of realistic modelling of rock dynamics problems: FEM/DEM simulation of dynamic brazilian test on barre granite. Rock Mech. Rock Eng.. 2010;43:707-716.
- [CrossRef] [Google Scholar]
- Machine learning techniques to predict rock strength parameters[J] Rock Mech. Rock Eng.. 2022;55(3):1721-1741.
- [Google Scholar]
- Machine learning in tunnelling – Capabilities and challenges. Geomech. Tunnelling. 2020;13:191-198.
- [Google Scholar]
- Machine learning-aided prediction of the mechanical properties of frozen fractured rocks. Rock Mech. Rock Eng.. 2023;56:261-273.
- [CrossRef] [Google Scholar]
- Machine learning approach to model rock strength: prediction and variable selection with aid of log data[J] Rock Mech. Rock Eng.. 2020;53:4691-4715.
- [Google Scholar]
- Numerical simulation of a direct shear test on a rock joint using a bonded-particle model. Int. J. Rock Mech. Min. Sci.. 2009;46(8):1315-1328.
- [Google Scholar]
- Future of machine learning in geotechnics. Georisk: Assessment and Management of Risk for Engineered Systems and Geohazards. 2023;17(1):7-22.
- [CrossRef] [Google Scholar]
- prediction of geotechnical parameters using machine learning techniques. Procedia Comput. Sci.. 2018;125:509-517.
- [Google Scholar]
- Prediction of rock compressive strength using machine learning algorithms based on spectrum analysis of geological hammer[J] Geotech. Geol. Eng.. 2019;37:475-489.
- [Google Scholar]
- Digital rock physics combined with machine learning for rock mechanical properties characterization. Abu Dhabi International Petroleum Exhibition and Conference. SPE 2018
- [Google Scholar]
- Shear strength of discontinuities in sedimentary rock masses based on direct shear tests. Int. J. Rock Mech. Min. Sci.. 2015;75:119-131.
- [Google Scholar]
- Predicting the shear strength parameters of sandstone using genetic programming[J] Bull. Eng. Geol. Environ.. 2018;77:1647-1662.
- [Google Scholar]
- Prediction of mechanical behavior of rocks with strong strain-softening effects by a deep-learning approach[J] Comput. Geotech.. 2022;152:105040
- [Google Scholar]
- Investigating the applications of machine learning techniques to predict the rock brittleness index[J] Appl. Sci.. 2020;10(5):1691.
- [Google Scholar]
- Numerical studies of the influence of microstructure on rock failure in uniaxial compression — Part I: effect of heterogeneity. Int. J. Rock Mech. Min. Sci.. 2000;37(4):555-569.
- [Google Scholar]
- Comparison of machine learning methods for ground settlement prediction with different tunneling datasets. J. Rock Mech. Geotech. Eng.. 2021;13(6):1274-1289.
- [Google Scholar]
- Loading rate and mineralogical controls on tensile strength of rocks: A machine learning view[J] Rock Mech. Rock Eng. 2023:1-7.
- [Google Scholar]
- Mechanical behavior of different sedimentary rocks in the Brazilian test. Bull. Eng. Geol. Environ.. 2020;79:5415-5432.
- [CrossRef] [Google Scholar]
- An anisotropic damage model of quasi-brittle materials and its application to the fracture process simulation. Appl. Sci.. 2022;12(23):12073.
- [Google Scholar]
- Application of machine learning in predicting the rate-dependent compressive strength of rocks[J] J. Rock Mech. Geotech. Eng.. 2022;14(5):1356-1365.
- [Google Scholar]
- A generic framework for geotechnical subsurface modeling with machine learning. J. Rock Mech. Geotech. Eng.. 2022;14(5):1366-1379.
- [Google Scholar]
- A study on crack damage stress thresholds of different rock types based on uniaxial compression tests. Rock Mech. Rock Eng.. 2014;47:1183-1195.
- [CrossRef] [Google Scholar]
- Particle flow study on strength and meso-mechanism of Brazilian splitting test for jointed rock mass. Acta Mech. Sin.. 2014;30:547-558.
- [CrossRef] [Google Scholar]
- Auto machine learning-based modelling and prediction of excavation-induced tunnel displacement. J. Rock Mech. Geotech. Eng.. 2022;14(4):1100-1114.
- [Google Scholar]
- Comprehensive review of machine learning in geotechnical reliability analysis: Algorithms, applications and further challenges. Appl. Soft Comput.. 2023;136:110066
- [Google Scholar]
- Deep learning for intelligent prediction of rock strength by adopting measurement while drilling data. Int. J. Geomech.. 2023;23(4):04023028.
- [Google Scholar]
- Proposing several hybrid SSA—Machine learning techniques for estimating rock cuttability by conical pick with relieved cutting modes[J] Acta Geotech.. 2023;18(3):1431-1446.
- [Google Scholar]


