

Translate this page into:
Prediction of mungbean yellow mosaic virus disease using multiple regression models
⁎Corresponding authors. liyunzhou2007@126.com (Yunzhou Li), muhammad.ahmad@uos.edu.pk (Muhammad Ahmad Zeshan)
-
Received: ,
Accepted: ,
This article was originally published by Elsevier and was migrated to Scientific Scholar after the change of Publisher.
Peer review under responsibility of King Saud University.
Abstract
Background
The main cause for low mungbean [Vigna radiata (L.) R. Wilczek] productivity is mungbean yellow mosaic virus (MYMV). Generally, the management of MYMV relies upon frequent insecticide sprays to control its vector (whitefly) and genetic resistance. However, disease forecast models can help to economize the pesticide sprays. Hence current study was designed to identifying environmental factor that promote disease development and developing a disease prediction model.
Methods
One hundred and twenty-seven mungbean accessions were planted for two years (2012 and 2013) and infection was dependent on natural inoculum. Weekly and daily data on disease incidence and environmental variables were collected and analyzed using correlation and stepwise regression analysis.
Results
Wind velocity and high temperature had a negative relation with disease occurrence during both years, whereas low temperature, rainfall, and relative humidity, had positive relationship based on linear regression. The environmental conditions responsible for the highest disease incidence were, maximum temperature (32–34 °C), relative humidity (72–75 %), minimum temperature (27–29 °C), rainfall (1.8–2.1 mm) and wind velocity (3–4.5 km/hr) during both growing seasons Overall, five environmental variable multiple regression model encompassing relative humidity, wind speed, rainfall, suboptimum temperature, and optimum temperatures accommodate the data rightly explaining 83 % variation in disease outgrowth.
Conclusion
The observed MYMV disease occurrence values for most of the mungbean genotypes, and those predicted by the model were very close. This multi-environmental variable model can be utilized to provide early warning forecasts for the management of MYMV in Pakistan.
Keywords
Disease forecasting
Legumes
Prediction
Cost-effective

1 Introduction
Mungbean [Vigna radiata (L.) R. Wilczek] is a short duration legume crop and known as a rich source of protein (Akhtar et al., 2009; Farooq et al., 2018). Mungbean yellow mosaic virus (MYMV) causing yellow mosaic disease is regarded as the major reason for low mungbean productivity (Bos, 1999; Naeem et al., 2022). The MYMV belongs to genus begomovirus and gains more importance due to its infection on other legume crops like urdbean, soybean, and cowpea in Sri Lanka, Pakistan, Bangladesh, and India (Qazi et al., 2007; Biswass et al., 2008; John et al., 2008). The disease incidence reduces yield by 5 to 100 % depending upon disease severity, host resistance level and prevailing environmental conditions (Rathi, 2002).
Several investigations have identified whitefly as the only vector for natural transmission of MYMV in mungbean (Arif et al., 2022). The virus is acquired by whitefly nymphs from infected leaves (Honda & Ikegami, 1986). The influence of whitefly population on MYMV incidence has been already described by Nadeem et al. (2006). Akhtar et al. (2011) documented a link between whiteflies’ population and the progression of infection and the same was reported in several other studies (Khan et al., 2006; Srivastava & Prajapati, 2012). The incidence of MYMV disease has increased due to increased pesticide resistance in whitefly due to overuse of same-group insecticides (Ahmad et al., 2002). Plant extracts have been investigated to control whitefly infestation as they are environmentally friendly and have no lingering effect.
The MYMV infection was notably reduced by nutrient supplementation (Chand & Varma 1983; Jain et al., 1995). To save money on pesticide sprays, epidemiological factors could be used to help determine when pesticides should be applied. The correlation of environmental variables with the incidence of MYMV disease can aid in quantifying the components that play a key role in disease initiation. Specialists can forecast disorder using epidemiological factors, and crop growers can preserve their crops by using different measures such as spraying for disease control and vector population control (Naeem et al., 2021). Inclusive study of environmental agents is needed for originating an authentic disease prediction system. Srivastava & Prajapati (2012) reported environmental agent’s consequences on disease expansion. A few studies have been conducted previously to determine the impact of environmental variables on disease development. For instance, a model developed by Khan et al. (2006) consisting of environmental variables explained 81 % variability in the development of MYMV disease. High rainfall during July and with little or no rain in August were determined critical for disease development (Livinder et al., 2009). Optimum temperature and MYMV disease incidence had a positive link, while minimum temperature and MYMV disease incidence had a negative correlation (Khan et al., 2012). The results from these previous studies are inconsistent and unable to be compared. Research work to find out the favorable environmental factors in the development of MYMV infection has not been thoroughly investigated.
The necessity of epidemiological research to describe the fluctuation of the disease under local environment cannot be overstated. Plant disease epidemics are influenced by several factors, including weather. As a result, a basic grasp of weather and climatic conditions is essential to construct simple and reliable disease prediction systems. The influence of changing environmental factors on the accumulation of inoculums and the spread of disease has not been quantified. Secondly, we intended to check if the environmental variables for virus development remain constant or change as with changing climatic conditions. Disease prediction model was constructed on account of two years data after investigated a relation between environmental factors and genes.
2 Material and Methods
One hundred and twenty-seven mungbean accessions were planted for two years (2012 and 2013) at experimental area of Plant Pathology Department, University of Agriculture, Faisalabad, Pakistan. The seeds of the tested genotypes were planted in three-meter-long rows with a 30 cm row-to-row spacing. A row of a highly susceptible variety after every ten test entries, i.e., (Kabuli mung) was sown. Furthermore, two rows of susceptible variety were planted around all the experiment. The experiment had three replications for each genotype. Germplasm was screened under natural field conditions and no seed treatment or other plant protection measures were applied to encourage the vector population. Data regarding MYMV disease incidence were collected from field and for weather attributes the data were obtained from meteorological station of University of Agriculture, Faisalabad, Pakistan. The pathogenicity of the virus was established using the grafting procedure described by Akhtar & Haq (2003). Disease development was recorded at weekly intervals based on visual disease symptoms. Ten plants were randomly chosen from each row with disease symptoms on leaves, i.e., disintegrated shining yellow spots and veinal yellowing. Disease frequency was determined using the procedure. Disease incidence = Number of infected leaves/Total number of leaves × 100.
Based on the field reaction to MYMV, mungbean germplasm was divided into five reaction groups, i.e., resistant, moderately resistant, moderately susceptible, susceptible, and very sensitive. To specify the influence of environmental factors on disease expansion, nine genotypes from resistant to a certain extent resistant genotypes, and thirty genotypes were chosen from susceptible, moderately, and very vulnerable groups for further analysis.
Weekly average of environmental factors, including optimum and suboptimal temperatures, rainfall, wind velocity and relative humidity were recorded daily during both years starting from July to August. Correlation and regression analysis were used to investigate each environmental factor (relative humidity, wind velocity, rainfall, highest temperature, and lowest temperature).
The MYMV prediction model was fitted, and the environmental variables having a substantial impact on MYMV were used as explanatory variables. Regression analysis was used to discover the most favorable environmental variables for disease development. The impact of environmental variables on disease development was noted by comparing the predicted values of different regression models to observed values.
3 Results
Environmental factors, i.e., maximum temperature, minimum temperature, relative humidity, rainfall, and wind speed, had highly significant with disease incidence during 2012 growing season. (Table.1). Overall, wind speed and high temperature had a negative link with disease prevalence, whereas rainfall, relative humidity, and low temperature had a positive relation. No significant link was found between environmental factors and the genotypes when genotypes were divided into moderately resistant and resistant groups (Table. 2). In column upper values are for Pearson’s correlation coefficients, (** =Highly important), whereas the lower values are for significance level at P = 0.05.
Specifications of environment
2012
2013
Maximal Temperature
−0.167**
0.000−0.178**
0.000
Minimal Temperature
0.397**
0.0000.405**
0.000
Moisture
0.254**
0.0000.331**
0.000
Rain
0.604**
0.0000.402**
0.000
Speed of wind
−0.458**
0.000−0.445**
0.000
Varieties or lines
Maximum
temperatureMinimum
temperatureMoisture
Rainfall
Wind velocity
NM-2011
−0.0750
0.75500.0250
0.85800.1350
0.75400.0120
0.84100.1460
0.7150
NM-2006
0.255
0.4210.456
0.5870.359
0.4890.079
0.569−0.225
0.387
AZRI-06
0.455
0.8550.524
0.7540.539
0.8400.258
0.689−0.368
0.358
NM-92
−0.056
0.6890.158
0.7250.198
0.6520.352
0.456−0.258
0.758
NM121-25
0.057
0.8540.259
0.8120.358
0.7250.398
0.627−0.625
0.789
C2 94–4-36
0.251
0.8990.264
0.8870.298
0.7690.452
0.685−0.458
0.775
07007
−0.057
0.8750.212
0.4880.258
0.5100.098
0.458−0.025
0.780
98001
−0.127
0.8170.325
0.8750.297
0.5690.365
0.380−0.097
0.728
014322
0.015
0.7280.154
0.6890.289
0.7810.546
0.489−0.258
0.569
During first year, level of association decreased for susceptible, moderately, and highly susceptible genotypes and out of the tested thirty, only nine genotypes expressed notable correlation with the highest temperature. Thirteen genotypes showed a strong connection with minimum temperature. Only six genotypes showed a significant connection of MYMV disease incidence with relative humidity. Rainfall and MYMV disease incidence were found to have a strong connection in all genotypes. Wind speed was also found to have a substantial negative relationship with disease occurrence, with thirty genotypes showing a significant link (Table 3). Values that are written on upper side in a column show Pearson’s correlation coefficients, **= Highly important, values that are written on lower side in column show significance level at P = 0.05, *=Significant.
Varieties or lines
Maximum
temperatureMinimum
temperatureMoisture
Rainfall
Wind velocity
013954
−0.707**
0.0000.966**
0.0000.894**
0.0000.968**
0.000−0.833**
0.000
013955
−0.754**
0.0000.968**
0.0000.883**
0.0000.958**
0.000−0.811**
0.000
013956
−0.753**
0.0000.965**
0.0000.890**
0.0000.956**
0.000−0.813**
0.000
013957
−0.750**
0.0000.965**
0.0000.866**
0.0000.954**
0.000−0.802**
0.000
014227
0.056
0.8100.731**
0.0000.221
0.3350.570**
0.007−0.592**
0.005
014228
−0.201
0.3830.607**
0.0030.246
0.2810.788**
0.000−0.584**
0.005
014232
−0.238
0.2990.537*
0.0120.054
0.8180.791**
0.000−0.477*
0.029
014234
−0.089
0.7030.663**
0.0010.268
0.2400.753**
0.000−0.542*
0.011
014261
−0.088
0.7050.581**
0.0060.235
0.3060.759**
0.000−0.548*
0.010
014275
−0.278
0.2220.448*
0.0420.369
0.1000.786**
0.000−0.647**
0.002
014276
0.060
0.7970.505*
0.0190.207
0.3690.499*
0.021−0.527*
0.014
014285
−0.093
0.6870.559**
0.0080.305
0.1790.633**
0.002−0.629**
0.002
014286
−0.072
0.7570.583**
0.0060.342
0.1290.704**
0.000−0.659**
0.001
014289
−0.269
0.2390.437*
0.0480.425
0.0550.793**
0.000−0.679**
0.001
014292
−0.443*
0.0440.402
0.0710.373
0.0960.895**
0.000−0.581**
0.006
014293
−0.323
0.1530.232
0.3110.529*
0.0140.762**
0.000−0.665**
0.001
014295
−0.550**
0.0100.171
0.4590.353
0.1170.879**
0.000−0.615**
0.003
014296
−0.473*
0.0300.387
0.0830.212
0.3560.952**
0.000−0.442*
0.045
014311
−0.502*
0.0200.206
0.3700.291
0.2000.910**
0.000−0.461*
0.035
014315
−0.608**
0.0030.124
0.5910.342
0.1290.933**
0.000−0.439*
0.047
014316
−0.049
0.8340.449*
0.0410.417
0.0600.563**
0.008−0.799**
0.000
014343
−0.174
0.4520.528*
0.0140.226
0.3260.838**
0.000−0.445*
0.043
014358
0.038
0.8710.556**
0.0090.184
0.4240.672**
0.001−0.572**
0.007
014359
−0.187
0.4180.633**
0.0020.123
0.5960.769**
0.000−0.597**
0.004
014364
−0.252
0.2700.574**
0.0070.201
0.3810.679**
0.001−0.729**
0.000
014380
−0.084
0.7160.627**
0.0020.122
0.5990.748**
0.000−0.508*
0.019
014488
0.182
0.4300.535*
0.0120.125
0.5900.579**
0.006−0.467*
0.033
014532
−0.038
0.8710.688**
0.0010.255
0.2640.729**
0.000−0.513*
0.017
014559
−0.229
0.3180.264
0.2480.617**
0.0030.695**
0.000−0.437*
0.048
07005
−0.251
0.2730.703**
0.000−0.108
0.6410.677**
0.001−0.496*
0.022
The overall correlation of environmental factors with disease development was significantly high during 2013 (Table 1). There was a negative correlation between wind speed and highest temperature for disease development. In contrast there was a positive relation between lowest temperature, rainfall, and relative humidity in disease progression. When the data was separated by genotype groups, non-significant correlation was noted between disease prevalence and environmental variables (Table 4) and level of correlation decreased in moderately susceptible, susceptible, and highly susceptible genotypes. Similarly, thirteen genotypes had significant relation with disease incidence and optimum temperature out of thirty genotypes. On the other hand, twenty-four genotypes had significant association with suboptimum temperature. Nineteen genotypes had positive relationship for disease incidence with relative humidity. Twenty-five genotypes show consequential relationship for disease incidence with rainfall. Wind speed exhibited strong negative relation with disease occurrence as twenty-seven genotypes showed notable relation (Table 5). In a column upper values show Pearson’s correlation coefficients, **= Highly significant, In column lower numerical values indicate significance level at P = 0.05, *=Significant.
Varieties or lines
Maximum
temperatureMinimum
temperatureMoisture
Rainfall
Wind velocity
NM-2011
−0.0640
0.84100.0350
0.84500.2450
0.75800.0100
0.8230−0.2350
0.7020
NM-2006
0.236
0.4590.432
0.5640.459
0.5100.128
0.658−0.369
0.789
AZRI-06
−0.424
0.7890.628
0.8240.525
0.7430.228
0.5980.398
0.369
NM-92
−0.158
0.7580.214
0.6580.241
0.7250.338
0.478−0.365
0.728
NM121-25
0.136
0.7580.369
0.6250.325
0.7580.315
0.725−0.698
0.809
C2 94–4-36
−0.289
0.8240.324
0.7590.298
0.6980.489
0.598−0.598
0.875
07007
−0.046
0.7690.125
0.5890.321
0.6580.189
0.578−0.125
0.897
98001
0.123
0.7150.456
0.7890.321
0.6520.369
0.4560.365
0.897
014322
0.036
0.6580.147
0.6590.389
0.8010.687
0.698−0.369
0.456
Varieties or lines
Maximum
temperatureMinimum
temperatureMoisture
Rainfall
Wind velocity
013954
−0.697**
0.0000.866**
0.0000.854**
0.0000.868**
0.000−0.793**
0.000
013955
−0.774**
0.0000.898**
0.0000.783**
0.0000.838**
0.000−0.791**
0.000
013956
−0.703**
0.0000.905**
0.0000.810**
0.0000.826**
0.000−0.785**
0.000
013957
−0.740**
0.0000.915**
0.0000.766**
0.0000.894**
0.000−0.812**
0.000
014227
0.096
0.7100.631**
0.0000.321
0.3050.520**
0.005−0.580**
0.005
014228
−0.281
0.3630.617**
0.0020.286
0.2910.708**
0.001−0.567**
0.004
014232
−0.218
0.2800.515*
0.0100.064
0.8010.891**
0.001−0.388*
0.019
014234
−0.099
0.8050.754**
0.0020.568*
0.0100.673**
0.000−0.642*
0.012
014261
−0.075
0.6010.689**
0.0050.339
0.2010.659**
0.001−0.638*
0.011
014275
−0.378
0.2020.520*
0.0320.769*
0.0140.687**
0.001−0.717**
0.003
014276
0.290
0.0970.615*
0.0120.567**
0.0070.389*
0.024−0.628*
0.012
014285
−0.123
0.4550.559**
0.0080.405
0.1600.715**
0.004−0.717**
0.003
014286
−0.289
0.6480.673**
0.0050.548**
0.0040.350
0.243−0.740**
0.002
014289
−0.325
0.3120.527*
0.0380.402
0.0750.680**
0.006−0.756**
0.002
014292
−0.531*
0.0310.382
0.0510.458
0.0850.784**
0.005−0.681**
0.005
014293
−0.710*
0.0190.732**
0.0050.645*
0.0110.262
0.101−0.725*
0.004
014295
−0.645**
0.0040.214
0.5010.486
0.1010.456
0.081−0.615*
0.002
014296
−0.588*
0.0240.290
0.0910.612*
0.0360.854**
0.004−0.541*
0.032
014311
−0.610*
0.0190.309
0.4560.589*
0.0140.880**
0.001−0.572*
0.038
014315
−0.710**
0.0020.210
0.4250.420
0.2130.493
0.072−0.528*
0.039
014316
−0.649*
0.0140.529*
0.0320.597*
0.0300.383
0.068−0.810**
0.004
014343
−0.574*
0.0220.610*
0.0120.626*
0.0260.738*
0.019−0.532*
0.031
014358
0.148
0.6560.498**
0.0050.584*
0.0240.672*
0.031−0.625**
0.006
014359
−0.284
0.5130.525**
0.0010.523*
0.0310.585*
0.021−0.618**
0.003
014364
−0.752*
0.0300.625**
0.0060.325
0.3150.588*
0.021−0.629*
0.014
014380
−0.225
0.5130.712**
0.0030.622*
0.0190.645*
0.021−0.612*
0.020
014488
0.481
0.4150.615*
0.0100.625*
0.0400.487**
0.004−0.512*
0.021
014532
−0.231
0.5250.715**
0.0020.655*
0.0340.815*
0.040−0.625*
0.016
014559
−0.318
0.2500.389
0.1250.728**
0.0020.786**
0.001−0.568*
0.037
07005
−0.368
0.1650.803**
0.0010.758*
0.0300.725*
0.021−0.546*
0.019
Comprehensively comparison for two years reveal that results are approximately same with only small dissimilarities. Disease incidence was significantly correlated with maximum temperature in numerous varieties or lines during 2013 than 2012. Likewise, number of genotypes exhibiting significant correlation with relative humidity increased from six in 2012 to nineteen in 2013.
Based on two years data, several statistically reliable (R2 = 0.83) at P < 0.01 regression models were created. The models were used under certain environmental variables to check the expected incidence of MYMV (Table 6). Relative humidity, rainfall, wind speed, and minimum and maximum temperatures were found to be major determinants influencing MYMV in disease prediction model. These five characteristics also explained 83 percent of the variability in disease progression, according to the model. It is estimated that a change of 0.57 units in relative humidity will result in a change in MYMV incidence. One unit change in rainfall, wind speed, maximum and lowest temperatures altered MYMV incidence by 27.43, 4.07, 4.22, and 0.70 units, respectively. The value of the coefficient of determination (R2) was the most dependable and important metric for checking the model's reliability. It was 83 percent in the current study, which is regarded good, mostly under field circumstances with no command over any of the analyzed factors. (y = Full Model, y1 = data of 20121styear and y2 = data of 20132nd year) *Significant at 0.01.
Equations of regression
R2
Adj. R2
Cp
Mean Square Error
Prob > F
Overall (2012–2013) models outline
y = −170.10 + 0.57x1 + 27.43x2-4.07x3-4.22x4 + 0.70x5
(where moisture content shows by x1,rain by x2, speed of wind by x3, highest temperature by x4 and lowest temperature by x5)0.83
0.83
5
550.52
<0.0001*
2012
y1 = −99.48 + 28.10x1-4.1x2-6.18x3
(where x1 represents rain, x2 optimum temperature, x3 speed of wind)0.84
0.84
3
535.13
<0.0001*
2013
y2 = −670.92 + 1.3x1 + 18.86x2-3.65x3-3.55x4
(where x1 tells about moisture content, x2 suboptimum temperature, x3 optimum temperature and x4 velocity of wind)0.83
0.83
3.1
540.26
<0.0001*
Relationship of environmental factors with MYMV disease is also shown by the linear regression models developed on randomly selected four accession lines, i.e., ‘13954′, ‘13955′, ‘13956′ and ‘13957′. During both years, the highest temperature exhibited negative correlation with disease, and optimal disease was noticed at 33 to 34 °C and 32 to 33 °C during 2012 and 2013, respectively (Fig. 1a and 1b). In case of minimum temperature, optimum disease was noticed at 28 to 29 °C and 27 to 28 °C during the year of 2012 and 2013, respectively (Fig. 2a and 2b). The highest disease incidence was noted at moisture content of 72 to 74 % and 73 to 75 % during 2012 and 2013 crop growing seasons respectively (Fig. 3a and 3b). Rainfall and disease incidence had a linear relationship and optimum disease incidence was recorded under 1.9–2.1 mm and 1.8–2.0 mm rainfall during 2012 and 2013, respectively (Fig. 4a and 4b). Disease incidence with had a negative correlation wind velocity.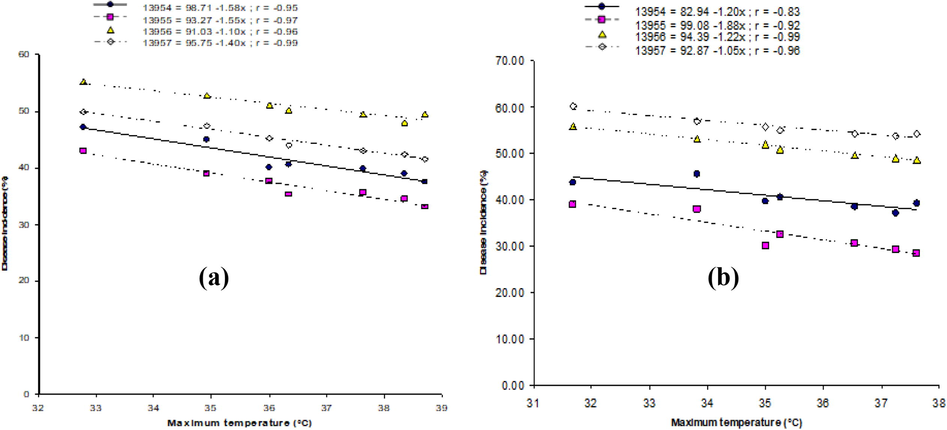
Correlation between the highest temperature and incidence of MYMV on from four mungbean lines, i.e., ‘13954′, ‘13955′, ‘13956′, and ‘13957′ during 2012 (a) and 2013 (b).

Correlation between minimum temperature and incidence of MYMV on from four mungbean lines, i.e., ‘13954′, ‘13955′, ‘13956′, and ‘13957′ during 2012 (a) and 2013 (b).
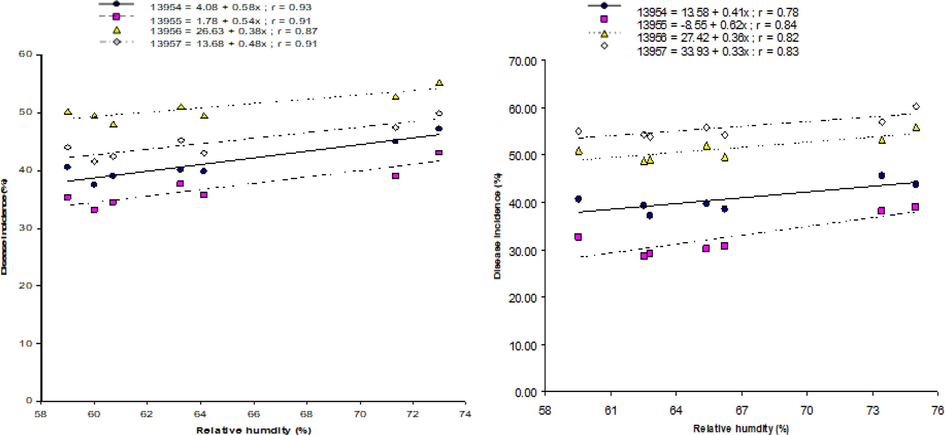
Correlation between relative humidity and incidence of MYMV on from four mungbean lines, i.e., ‘13954′, ‘13955′, ‘13956′, and ‘13957′ during 2012 (a) and 2013 (b).
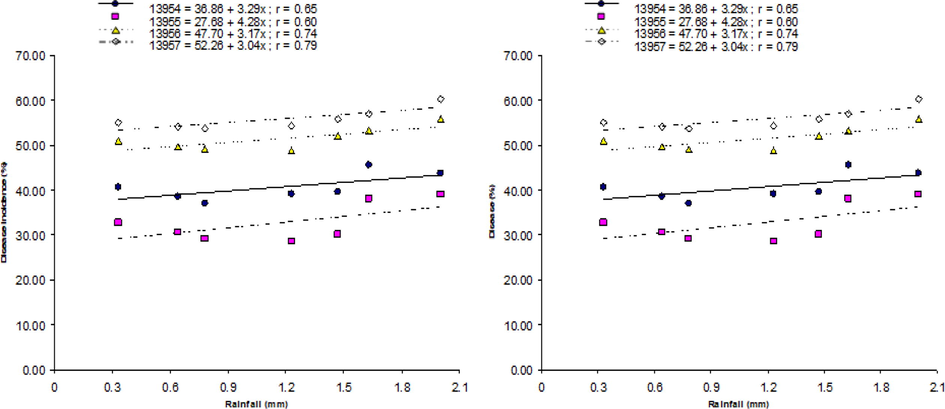
Correlation between rainfall and incidence of MYMV on from four mungbean lines, i.e., ‘13954′, ‘13955′, ‘13956′, and ‘13957′ during 2012 (a) and 2013 (b).
4 Discussion
The world's climatic conditions are rapidly changing because of global climate changes. As a result, the relationship between disease development and environmental factors must be re-examined on regular basis. The sound knowledge of the parameters critical for disease progression, MYMV management measures can be effectively imposed. The proper interpretation of disease-specific epidemiologic data necessitates knowledge of the disease's past and current occurrence. As a result, it is critical to collect, collate, analyze, and report data on disease occurrence on a frequent basis to accurately interpret short-term variations in occurrence (Hussain et al., 2021).
Characterization of disease-promoting environmental conditions revealed that none of them had a significant link with disease development in resistant and moderately resistant varieties/lines. Environmental factors and disease development had a strong association for the genotypes belonging to moderately susceptible, susceptible, and highly vulnerable groups. Environmental parameters such as the highest and the lowest temperature, wind speed, relative humidity, and rainfall had a strong link with the development of the MYMV disease. The MYMV had a negative link with wind speed and the highest temperature, whereas positive association was recorded with rainfall, relative humidity, and the lowest temperature. The findings of this investigation are consistent with Khan et al. (2012). The most appropriate temperatures for disease growth were 34–35 °C and 26–27 °C (Livinder et al., 2009). In accordance with this study, the suitable minimum temperature for disease development was 1.75 °C greater than the earlier reported favorable minimal temperature.
Same temperature ranges were seen for MYMV disease, and Srivastava & Prajapati (2012) found a positive association between relative humidity and rainfall and disease incidence. Nath (1994) found a significant association between temperature, rainfall, and relative humidity and MYMV incidence.
Environmental factors, as well as other elements such as whitefly population play a crucial role in the disease development. The experiment in the second year of the study was initiated fifteen days earlier than the first year. The disease only manifested later because of environmental causes, particularly humidity. Because of the early seeding, the mungbean crop may avoid high humidity period, which affects disease development. Previous research has also shown that disease incidence on spring-planted crops was lower or non-existent due to lower humidity levels compared to the months of July and August when high humidity and a high vector population prevail. Khan et al. (2006) discovered a remarkable effect of air, rainfall, relative humidity, and temperature, on disease growth (2006). Multiple regression models also confirmed that the studied environmental factors were important in the development of MYMV disease. All the parameters were found to have a significant impact on disease progression; the temperature and humidity ranges revealed in the current study are consistent with the findings of earlier studies (Khan et al., 2012; Akhtar et al., 2011).
5 Conclusion
The studied weather attributes had significant effect on disease incidence and genotypes significantly differed for their response. Keeping in view these results, regional advisory services could be provided to the farmers by agricultural extension wings for the management of MYMV based on disease development models.
Acknowledgements
The current study was supported by Science and Technology Project of Guizhou Province (Qiankehe Foundation-ZK[2022]General 071), the National Natural Science Foundation of China (32060679), the Guizhou University Cultivation Project (Guizhou University Cultivation [2019]No.52). The authors extend their appreciation to the Researchers Supporting Project number (RSP2022R418), King Saud University, Riyadh, Saudi Arabia.
Declaration of Competing Interest
The authors declare that they have no known competing financial interests or personal relationships that could have appeared to influence the work reported in this paper.
References
- Cotton whitefly (Bemisia tabaci) resistance to organophosphate and pyrethroid insecticides in Pakistan. Pest Manage. Sci.. 2002;58:203-208.
- [Google Scholar]
- Standardization of a graft inoculation method for the screening of mungbean germplasm against Mungbean yellow mosaic virus (MYMV) Plant Pathol. J.. 2003;19:257-259.
- [Google Scholar]
- Field evaluation of mungbean recombinant inbred lines against mungbean yellow mosaic disease using new disease scale in Thailand. Plant Pathol. J.. 2009;25:422-428.
- [Google Scholar]
- Screening of mungbean germplasm against mungbean yellow mosaic India virus and its vector Bemisia tabaci. Crop Prot.. 2011;30:1202-1209.
- [Google Scholar]
- Molecular study of geminiviruses with its complex biology, host-vector interactions, and increasing diversity. J. King Saud Univ.-Sci.. 2022;102051
- [Google Scholar]
- Diagnosis of symptomless yellow mosaic begomovirus infection in pigeon pea by using cloned mungbean yellow mosaic India virus a probe. J. Plant Biochem. Biotechnol.. 2008;17(1):9-14.
- [Google Scholar]
- Plant Viruses: Unique and Intriguing Pathogens: A Textbook of Plant Virology. The Netherlands: Backhuys Publishers; 1999. p. :305-306.
- Effect of yellow mosaic on growth components and yield of mungbean and urdbean. Haryana Agric. Univ. J. Res.. 1983;13:98-102.
- [Google Scholar]
- Impact of abiotic stresses on grain composition and quality in food legumes. J. Agric. Food. Chem.. 2018;66(34):8887-8897.
- [Google Scholar]
- Honda Y & Ikegami M (1986). Mungbean Yellow Mosaic Virus. CMI/AAB Description of Plant Viruses, No. 323.
- Plant chemical ecology: the focused arena for plant survival and productivity. In: Developing Climate-Resilient Crops. CRC Press; 2021. p. :139-158.
- [Google Scholar]
- Grain yield and its components as affected by yellow mosaic virus in blackgram (Vigna mungo L. Hepper) Ann. Agricult. Res.. 1995;16:364-366.
- [Google Scholar]
- Cowpea golden mosaic disease in Gujrat is caused by a mungbean yellow mosaic India virus isolate with a DNA B variant. Arch. Virol.. 2008;153(7):1359-1365.
- [Google Scholar]
- Incidence of mungbean yellow mosaic virus (MYMV), its epidemiology and management through mycotal, imidacloprid and tracer. Agric. Biol. J. North Am.. 2012;3(11):476-480.
- [Google Scholar]
- Meteorological factors influencing mungbean yellow mosaic virus epidemic in mungbean. Plant Disease Res.. 2009;1(24):81-82.
- [Google Scholar]
- Evaluation of mungbean germplasm for resistance against mungbean yellow mosaic begomovirus. Pak. J. Bot.. 2006;38(2):449-457.
- [Google Scholar]
- The impact of different crop sequences on weed infestation and productivity of barley (Hordeum vulgare L.) under different tillage systems. Crop Prot.. 2021;149:105759
- [Google Scholar]
- Barley-based cropping systems and weed control strategies influence weed infestation, soil properties and barley productivity. Agriculture. 2022;12(4):487.
- [Google Scholar]
- Effect of sowing time on the incidence of yellow mosaic virus disease and whitefly population on green gram. Ann. Agric. Res.. 1994;15(2):174-177.
- [Google Scholar]
- Legume yellow mosaic viruses: genetically isolated begomoviruses. Mol. Plant Pathol. 2007;8(4):343-348.
- [Google Scholar]
- Epidemiology, yield losses and management of major diseases of Kharif pulses in India. In: Plant Pathology and Asian Congress of Mycology and Plant Pathology. Mysore, India: University of Mysore; 2002.
- [Google Scholar]
- Influence of weather parameters on outbreak of mungbean yellow mosaic virus in black gram (Vigna mungo L.) of bundelkhand zone of central India. J. Agric. Phys.. 2012;12(2):143-151.
- [Google Scholar]


