

Translate this page into:
Prediction method of methane content change in cyclic hydrogen after desulfurization
⁎Corresponding author at: State Key Laboratory of Oil and Gas Reservoir Geology and Exploitation, Southwest Petroleum University, Chengdu 610500, China. zhidongzang@gmail.com (Zhidong Yang)
-
Received: ,
Accepted: ,
This article was originally published by Elsevier and was migrated to Scientific Scholar after the change of Publisher.
Peer review under responsibility of King Saud University.
Abstract
The purity of circulating hydrogen after desulfurization is mainly affected by the content of inert component methane. Based on this, the prediction method of methane content in circulating hydrogen after desulfurization is studied. From the process of hydrogen facing system, it can be seen that the methane content in circulating hydrogen after desulfurization is mainly affected by methane solubility, feed oil density, new hydrogen components, reaction temperature, hydrogen consumption per ton of oil and catalyst components. In the process of predicting the change of methane content in circulating hydrogen after desulfurization, the methane content in circulating hydrogen after desulfurization was detected under different working conditions (different influencing factors) by means of spectral absorption method and methane content detection device. According to the real-time test results, the influence of different working conditions on methane content in circulating hydrogen after desulfurization was obtained. Based on this, the change of methane content in circulating hydrogen after desulfurization was predicted under the fluctuating conditions of various influencing factors. The results show that the methane content in recycled hydrogen after desulfurization increases with the increase of methane content, reaction temperature and the addition of higher active catalyst in the reactor. When the density of feed oil is 892–909 kg/m3, the change of composition is small, which has little effect on the circulating hydrogen methane content after desulfurization.
Keywords
Desulfurization
Circulating hydrogen
Methane content
Prediction
Hydrogen system
Spectral absorption method

1 Introduction
In order to reduce the emission of harmful substances and improve air quality, China has accelerated the process of upgrading oil quality, requiring the sulfur content in diesel oil to be reduced to ultra-low level (Saimura et al., 2017), which poses technical and economic challenges to the existing petrochemical refining industry. Petroleum refining industry has a history of about 150 years from its emergence to now. It has roughly gone through four stages: emergence, occurrence, development and maturity (Xu et al., 2017). The thermal processing technology of autoclave distillation, pyrolysis, delayed coking and vacuum distillation has changed to fluidized bed catalytic cracking, movable bed catalytic cracking, and so on, in order to increase gasoline production and octane number (Liu and Liu, 2010). Fixed bed catalytic reforming, fluidized bed catalytic reforming and movable bed catalytic reforming are catalytic processes (Lennox et al., 2017). The hydrogen by-product of reforming unit promotes the development of hydrogenation technology, and the hydrofining units of gasoline, diesel and lubricating oil have been put into operation one after another.
The liquid-phase cyclic hydrogenation process is a new process which meets the production standard of low-sulfur diesel oil and is one of the main process means for lightening heavy raw materials (Ruan et al., 2017). It has the advantages of strong adaptability of raw materials, flexible production, high liquid yield and good product quality. Therefore, it has been paid more and more attention by refineries. The process features that liquid oil saturated with hydrogen enters the reactor and hydrogen dissolved in the liquid oil participates in the hydrogenation reaction. The solubility of hydrogen in oils or solvents plays a key role in the liquid-phase cyclic hydrogenation process (Liu, 2017). The purity of hydrogen has a great influence on the reaction pressure and hydrogen-oil ratio of the units used in the liquid-phase cyclic hydrogenation process, and then affects the operation of the whole process (Escobar-Bahamondes et al., 2017). Supplementary hydrogen for liquid-phase cyclic hydrogenation process usually comes from hydrogen production unit, chemical plant or reforming unit, i.e. mixing of recycled hydrogen and new hydrogen (Patra, 2017). In order to improve hydrogen purity, pressure swing adsorption, cryogenic separation or membrane separations are mainly used in these units. Due to the different purification processes used to supplement hydrogen, the purity of hydrogen is also different (Cheng et al., 2017). Hydrogen, ammonia and methane are by-products of hydrodesulfurization process. Their existence can inhibit the hydrogenation process of diesel oil, increase the content of sulfur and nitrogen in diesel oil (Hyeon et al., 2017), thus affecting the quality of product oil. Among them, the purity of circulating hydrogen after desulfurization is mainly affected by the content of inert component methane (Moser et al., 2017). The content of methane will directly affect the selection of process flow and the determination of operating pressure of reactor part. Therefore, it is important to predict the change of methane content in circulating hydrogen after desulfurization.
At present, there are three main methods of methane gas measurement: chemical combustion method, gas chromatography detection, spectral absorption method (Rezaei et al., 2017). Catalytic combustion method is mainly suitable for the measurement of low-content methane. When methane content is more than 4%, the element will be activated, which is easy to cause permanent damage of the element. Gas chromatography cannot directly obtain positive results, it is difficult to achieve real-time detection. Compared with other methods, the spectral absorption method uses light as the signal carrier of measurement, and has no effect on the measurement object. It has good independence and adapts to various use environments, so it has good application prospects. Based on this, when studying the prediction method of methane content change in circulating hydrogen after desulfurization, the methane content in circulating hydrogen after desulfurization was predicted by spectral absorption method under different influencing factors, which provided the basis for determining the design parameters of oil quality upgrading process.
2 Prediction of methane content in circulating hydrogen after desulfurization
2.1 Hydrogen-facing system flow
The flow chart of the hydrogen facing system is shown in Fig. 1.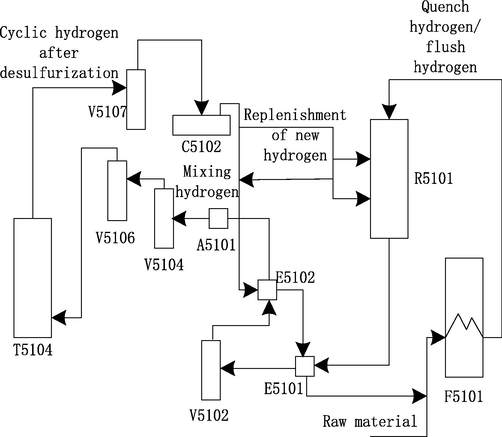
Flow diagram of hydrogen facing system.
The reflective effluent from R5101 (hydrogenation reactor) is heat exchanged by E5101 (feed oil/reaction effluent heat exchanger), and then the temperature drops to 250 °C and enters V5102 (hot and high pressure separator). After heat transfer by E5102 (high separation gas/mixed hydrogen heat exchanger), the hot high separation gas is cooled by A5101 (hot high separation gas air cooler) to 50 °C, and then entered into V5104 (cold high pressure separator) for oil, water and gas three-phase separation (Van et al., 2018). The high and cold gas coming from the top of V5104 is separated by V5106 (circulating hydrogen coalescer) and then enters the bottom of T5104 (circulating hydrogen desulfurization tower). After desulfurization, the circulating hydrogen comes out from the top of the tower and is separated into C5102 (circulating hydrogen compressor) by V5107 (replacing and clearing the inlet separating tank of compressor) to boost pressure. Then it is divided into two ways, one as quenching hydrogen to control the bed temperature of reactor, the other is mixed with new hydrogen from the outlet of C5101 (new hydrogen compressor) to form mixed hydrogen.
2.2 Prediction of methane content change
According to the process of hydrogen facing system, the methane content in circulating hydrogen after desulfurization is mainly affected by the solubility of methane, the density of feed oil, the composition of new hydrogen (hereinafter referred to as new hydrogen), reaction temperature, the consumption of hydrogen per ton of oil and the composition of catalyst, etc. (Hristov et al., 2018). Therefore, in the process of predicting the change of methane content in circulating hydrogen after desulfurization, it can be rooted. According to the above factors, the methane content in circulating hydrogen after desulfurization was measured by spectral absorption method and methane content device under different working conditions (different influencing factors). The change of methane content in circulating hydrogen after desulfurization was predicted according to the influence of various influencing factors on methane content.
2.2.1 Prediction principle
Spectral absorption method is often used to predict the change of methane content in circulating hydrogen samples after desulfurization. Spectral absorption method is based on Lambert Bill's law. The content of gas can be retrieved by detecting the change of projected light intensity. As shown in Fig. 2, when the incident light intensity is passes through the methane in the circulating hydrogen after desulfurization, the methane in the circulating hydrogen after desulfurization will scatter and absorb the incident light (Pardakhti et al., 2017). Because the methane in the circulating hydrogen after desulfurization absorbs part of the light energy, the intensity of the emitted light will be weakened.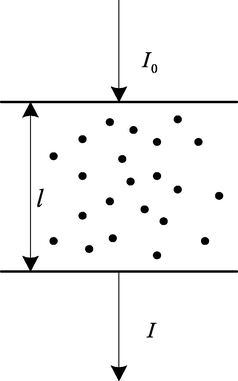
Transmission of light.
From Lambert-Beer law, we can see that:
That is:
Among them, is the light intensity of incident laser, is the laser intensity of methane absorbed by gas when passing through circulating hydrogen after desulfurization, is the turbidity of methane in circulating hydrogen after desulfurization, is the light path of methane in circulating hydrogen after parallel light passing through desulfurization.
After taking logarithms on both sides of Eq. (2), we can get that:
When the diameter of suspended particles is the same and the distribution is uniform, the turbidity of methane in circulating hydrogen after desulfurization is proportional to the number of particles and the diameter of suspended particles per unit volume (Jung and Park, 2017).
is the extinction coefficient, which is the intrinsic property of matter. It is only related to the wavelength of incident light, the diameter of particles and the relative refractive index of particles (Todic et al., 2017).
Then is only related to and , and formula (4) is introduced into formula (3) to obtain:
For different wavelengths, and are introduced into the upper formula respectively.
Under the same experimental conditions, the number of particles, the diameter of suspended particles and the optical path of methane in circulating hydrogen after desulfurization by parallel light are all certain (Ai et al., 2017). So dividing Formula (7) by Formula (8) can be obtained:
Among them, , , and are known quantities, and can be obtained from formula (9), and of particle diameter can be calculated. The methane content in circulating hydrogen after desulfurization can be obtained by bringing of particle diameter into formula (4):
2.2.2 Selection of monochromatic light source and detection device
There are four kinds of fixed vibration modes for methane molecule (Rong et al., 2018). At the intrinsic absorption spectra of , , , , there are strong vibration absorption peaks in the wavelength range 3 μm –44 μm. Although the lead salt diode laser can produce light in this band, the light source and detector need low-temperature refrigeration, which is expensive and unsuitable for the field. Considering that the binding band of methane absorption line is located near (Cui et al., 2018) 1.3 μm, which belongs to the low loss region of quartz optical fiber (Feng et al., 2018), the light source technology is relatively mature, and it is the best choice under the current technical conditions. The prediction of methane content change in circulating hydrogen after desulfurization is based on the S3FC 1310 laser produced by Thorlabs Company of the United States. The laser can produce 1310 μm laser, and the output laser precision error will not exceed 1 μm, that is, the output power will be between 1309 μm and 1311 μm.
From the Hitran database of Harvard University, it can be found that there are 251,440 absorption lines of methane gas (Yang, 2018), of which 667 absorption lines are absorbed from 1312 μm (7627 cm−1) to 1307 μm (7627 cm−1). It can be concluded that the absorption intensity of methane gas at 1309 μm (7639 cm−1) and 1311 μm (7627 cm−1) is the weakest up to 0.6*10−23.
The device for predicting the change of methane content in circulating hydrogen after desulfurization by monochrome spectral absorption method based on optical fiber coupling technology is shown in Fig. 3.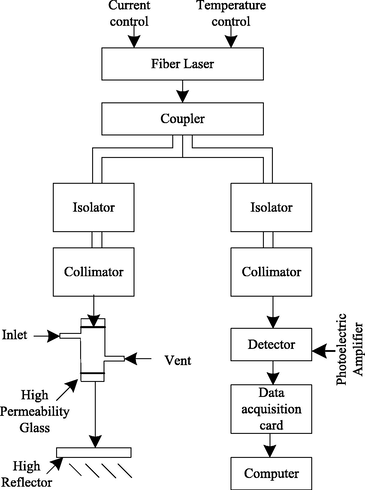
Prediction device for methane content change.
The device consists of light source, temperature regulator, current regulator, optical fiber coupler, isolator, optical fiber detector, data acquisition card, computer and signal processing system. The application of optical coupler in spectral absorption method can ensure that the light intensity received at any site and the light intensity of the light source remain unchanged after circulating hydrogen after desulfurization under different working conditions (Wang et al., 2017), thus realizing real-time on-line remote detection.
According to the real-time test results, the influence of different working conditions on the methane content in circulating hydrogen after desulfurization can be obtained. Based on this, the change of methane content in circulating hydrogen after desulfurization can be predicted under the fluctuating conditions of various influencing factors.
3 Experimental analysis
Taking the hydrotreating unit of a petrochemical company in China as the research object, the change of methane content in circulating hydrogen after desulfurization is predicted by the prediction method studied in this paper. The results are as follows.
3.1 Detection result
This method is used to predict the change of methane content in circulating hydrogen after desulfurization from March to November 2017. The specific data are shown in Fig. 4.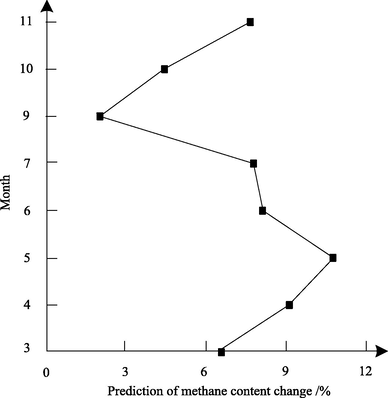
Prediction results of methane content change.
From Fig. 4, it can be seen that the methane content in circulating hydrogen after desulfurization has been increasing gradually since March, reaching the maximum content of 10.76% in May. This is because with the prolongation of operation time, the methane content in circulating hydrogen after desulfurization will gradually enrich and cause the content to increase. The methane content in recycled hydrogen decreased to 7.99% in June due to the exhaust of hydrogen in May. The hydrogenation unit was shut down for overhaul in August for the end of operation in July. After maintenance, the methane content in recycled hydrogen increased from 2.16% in September to 7.38% in November. The experimental results show that this method can effectively predict the change of methane content in circulating hydrogen after desulfurization.
3.2 Effect of methane solubility on prediction of methane content change
The effect of Methane Solubility (methane molar fraction) on the change of circulating hydrogen methane content after desulfurization is shown in Fig. 5.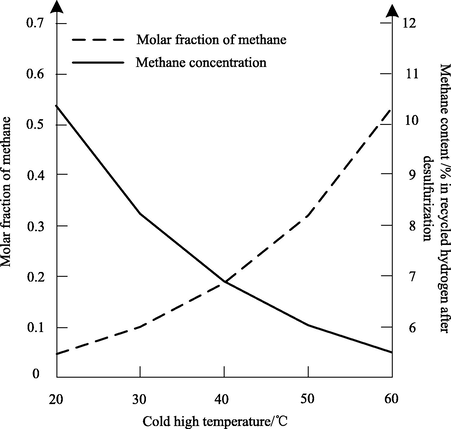
Effect of Methane Solubility.
Fig. 5 shows that the solubility of methane increases with the increase of high cooling temperature, and the relationship between the solubility of methane and the circulating hydrogen methane content after desulfurization is inverse. The higher the solubility of methane, the higher the hydrogen content in the equilibrium gas component, that is, the lower the methane content in circulating hydrogen after desulfurization. The experimental results show that the higher the solubility of methane, the lower the methane content in circulating hydrogen after desulfurization.
3.3 Effect of raw oil density on the change of methane content
In order to analyze the influence of feed oil density on the change of circulating hydrogen methane content after desulfurization, the conditions of close volume fraction of new hydrogen methane and reaction temperature and large difference of feed oil density were selected for analysis. The results are shown in Table 1.
Working condition
New hydrogen methane content/%
Raw oil density (20 °C)/(kg·m−3)
Reaction temperature/°C
Methane content in recycled hydrogen/%
1
2.47
892.2
330
4.88
2
2.67
892.2
330
6.37
3
2.26
892.2
330
5.00
4
2.26
905.0
330
4.78
5
2.47
905.0
330
5.23
6
2.26
908.2
330
4.73
7
2.67
908.2
330
7.01
Comparing and analyzing the data of No.3 and No.4, No.3 and No.6 in Table 1, it can be seen that methane is more produced when the density of feed oil component is small, but the data of No.2 and No.7, No.1 and No.5 show the opposite trend. The reason is that when the density of feed oil is 892–909 kg/m3, the change of composition is not obvious, and it has little effect on the circulating hydrogen methane content after desulfurization.
3.4 Effect of new hydrogen methane content on the change of methane content
In order to analyze the effect of new hydrogen methane content on the change of methane content in circulating hydrogen after desulfurization, sample data with stable reaction temperature and close density of feed oil were selected for analysis. The results are shown in Table 2.
Working condition
New hydrogen methane content/%
Raw oil density (20 °C)/(kg·m−3)
Reaction temperature/°C
Methane content in recycled hydrogen/%
1
2.08
905.0
330
3.40
2
2.27
905.0
330
4.86
3
2.47
905.0
330
5.23
4
2.88
905.0
330
5.52
5
3.65
891.1
330
8.11
6
4.18
891.1
330
8.48
7
4.74
891.1
330
10.06
Table 2 shows that the recycled hydrogen methane content ranges from 3.40% to 10.06% when the temperature is 330 °C, the density of filtered feed oil is 891.1–905 kg/m3 and the content of new hydrogen methane is 2.08%–4.74%.
By analyzing the data of the first four working conditions and the last three working conditions in Table 3, it is found that the increase of methane content in new hydrogen will lead to the increase of methane content in circulating hydrogen. The comparative analysis of seven groups of data in Table 3 shows that when the reaction temperature is the same and the density of feed oil changes little, the content of circulating hydrogen methane is mainly affected by the content of new hydrogen methane, and increases with the content of new hydrogen methane.
Working condition
New hydrogen methane content/%
Raw oil density (20 °C)/(kgm−3)
Reaction temperature/°C
Methane content in recycled hydrogen/%
1
3.36
889.3
309.6
4.52
2
2.08
889.3
311.6
3.92
3
1.99
889.3
311.8
3.46
4
2.04
891.1
335.0
8.16
5
3.27
891.1
335.0
9.27
6
3.32
891.1
335.0
9.46
3.5 Effect of reaction temperature on the change of methane content
In order to analyze the influence of reaction temperature on the prediction of methane content in circulating hydrogen after desulfurization, samples with similar density of feed oil and new hydrogen methane content and larger difference in reaction temperature were selected for analysis. The results are shown in Table 3.
Table 3 shows that the methane content in recycled hydrogen is 3.46%–4.52% when the reactor temperature is 310 °C, the density of feed oil is 889.3 kg/m3 and the content of new hydrogen methane is 1.99%–3.36%. At 355 °C, the density of feed oil is 891.1 kg/m3 and the content of new hydrogen methane is 2.04%–3.32%, the methane content in recycled hydrogen is 8.16%–9.46%.
By comparing and analyzing the data of working conditions (1) and (6), 2 and 4, 3 and 4 in Table 3, it can be concluded that the increase of reaction temperature will lead to the increase of methane content in circulating hydrogen. The reason may be that when the hydrogenation reaction temperature is adjusted, the temperature rises, which causes deep cracking of feed oil and more methane.
3.6 Effect of hydrogen consumption per ton of oil on the change of methane content
In view of the gradual decrease of catalyst activity, the research object began to carry out daily catalyst replacement according to the catalyst replacement scheme and the instructions for the use of catalyst. The replacement amount was 0.6 t/d of new catalyst. Five periods of similar working conditions before and after the overall change were selected for comparative analysis. The effect of hydrogen consumption per ton of oil on the change of methane content in circulating hydrogen was shown in Fig. 6.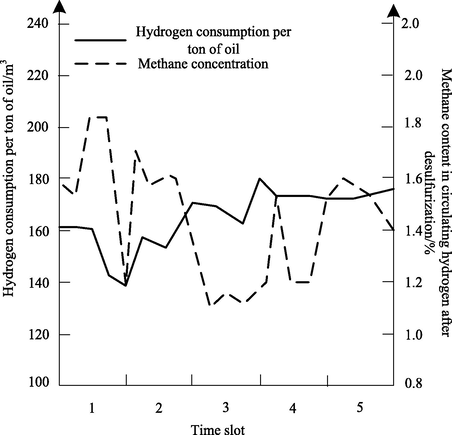
Effect of oil and hydrogen consumption on methane content in recycled hydrogen.
As can be seen from Fig. 6, the methane content in recycled hydrogen decreased from 1.86% to 1.14% and the reduction rate was 38.7% after the catalyst was replaced as a whole. The methane content in recycled hydrogen decreases with the constant feed property and load, which indicates that the selectivity of catalyst after overall replacement increases and the selectivity of oil from tail fracture decreases.
3.7 Effect of catalyst components on the change of methane content
The effect of catalyst composition on methane content in circulating hydrogen after desulfurization is shown in Fig. 7.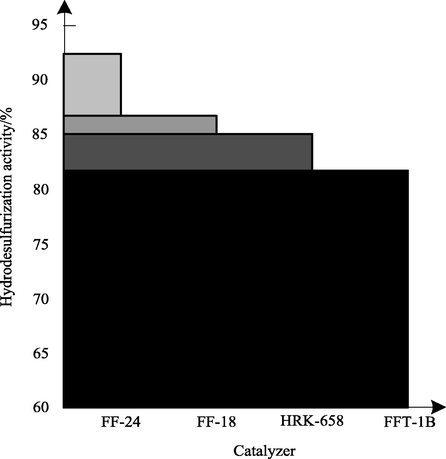
Effect of catalyst composition on methane content in circulating hydrogen after desulfurization.
Analysis of Fig. 7 shows that FF-24 catalyst has high hydrodesulfurization activity, and its hydrodesulfurization activity is significantly higher than that of FF-18 and two other catalysts FFT-18 and HRK-658 before maintenance. FF-24 catalyst is supported by special alumina and Mo-Ni-Co is used as active metal component of catalyst. It has the characteristics of good dispersion of active metal, simple preparation process and low cost. The hydrodesulfurization activity of FF-24 catalyst results in the hydrocracking reaction of feed oil, which produces more methane.
3.8 Accuracy of calculation of methane content in circulating hydrogen after desulfurization
The methane content in circulating hydrogen after desulfurization is calculated by this method. The results are shown in Table 4.
Working condition
Predicted value/%
Actual value/%
Content error/%
1
0.3
0
0.3
2
10.6
10
0.6
3
20.5
20
0.5
4
29.8
30
0.2
5
39.7
40
0.3
6
50.1
50
0.1
7
59.2
60
0.8
Table 4 shows that this method can not only predict the change of methane content in circulating hydrogen after desulfurization, but also the error between the predicted results and the actual content is less than 1.0%. It shows that this method has high accuracy in predicting the change of methane content in circulating hydrogen after desulfurization.
3.9 Prediction efficiency analysis
In order to test the prediction efficiency of this method, this method and three other models were used to predict the change of methane content in circulating hydrogen after desulfurization in different months of 2018, and the time required for different methods was compared. The results are shown in Table 5.
Month
The method in this paper /s
Prediction Method of Methane Content Change Based on Mathematical Model/s
Prediction method of methane content change based on Grey System Theory/s
Prediction Method of Methane Content Change Based on BP Neural Network/s
1
1.53
4.86
3.52
7.66
2
1.98
4.97
3.86
6.37
3
1.64
4.92
3.93
8.25
4
2.22
6.63
4.25
6.48
5
2.15
5.37
5.06
7.52
6
1.96
6.03
5.24
7.34
7
2.03
5.55
4.37
6.98
8
2.17
5.21
4.66
6.26
9
2.11
5.36
4.28
7.02
10
1.98
6.00
3.94
8.11
11
1.75
5.71
5.06
7.94
12
1.83
4.99
4.30
8.02
Analysis Table 5 shows that the time used to predict the change of methane content in circulating hydrogen after desulfurization in different months of 2018 is 1.53–2.22 s, and the average time spent is 1.95 s. The average time spent by the other three models is 5.47 s, 4.37 s and 7.33 s, respectively. The experimental results show that this method takes less time to predict the change of methane content in circulating hydrogen after desulfurization and has the highest efficiency.
4 Discussions
This paper studies the prediction method of methane content in circulating hydrogen after desulfurization, and predicts the change of methane content in circulating hydrogen after desulfurization under different conditions. The experimental results show that it is feasible and accurate to predict the change of methane content in circulating hydrogen after desulfurization by using optical fiber coupling technology in monochrome spectral absorption method. The monochrome spectral absorption method based on optical fiber coupling technology can not only predict the methane content in circulating hydrogen after desulfurization in real time, but also avoid the occurrence of gas accidents and greatly improve the safety of the prediction process. Moreover, the experimental procedure is simple and the results are accurate. The adjustable laser is expensive. Compared with the adjustable laser whose output light is 1330 nm, the 1310 μm laser has a wide range of applications, low price and good stability. It is found from Hitran database that the absorption of methane in circulating hydrogen after desulfurization is strong near 1310 μm. The lowest degree can reach 0.6*10−23, which is a good choice for measuring light source.
According to the prediction results of methane content change in circulating hydrogen after desulfurization under different working conditions, it can be seen that methane content has a great influence on the purity of circulating hydrogen after desulfurization, and the greater the methane content is, the smaller the purity of circulating hydrogen after desulfurization. To control methane content, the following three measures can be taken:
-
(1)
Considering both production conditions and energy saving and consumption reduction, the amount of waste hydrogen removal can be increased appropriately to reduce methane accumulation.
-
(2)
Under the conditions of production, the purity of new hydrogen should be increased and the reaction temperature should be lowered appropriately.
-
(3)
Controlling the temperature of high and cold fractions at 40–50 °C should not be too high in order to maintain a certain solubility of methane in high and cold fractions and to provide the purity of circulating hydrogen required for the reaction.
The emergence of environmental problems such as acid rain and climate warming has made people realize the importance of developing and utilizing clean fuels. At present, the demand for diesel fuel is increasing in the international market. The production and use of ultra-low sulfur and even sulfur-free diesel fuel is the development trend of clean fuels worldwide. As a result, the application of hydrofining and heavy oil hydrodesulfurization processes for various products is more widespread. The purity of circulating hydrogen after desulfurization is significantly affected by methane content. Based on this, the prediction method of methane content in circulating hydrogen after desulfurization is studied, and the change of methane content in circulating hydrogen after desulfurization in a hydrotreating unit of a petrochemical company in China is studied by this method. The following conclusions are drawn:
-
(1)
With the prolongation of the operation time of the hydrotreating unit, the circulating hydrogen methane will gradually enrich after desulfurization, resulting in an increase in the content.
-
(2)
The increase of methane content and reaction temperature in new hydrogen in hydrotreating unit will result in the increase of methane content in circulating hydrogen after desulfurization, when the density of raw material is 892–909 kg/m3, the composition changes little, and the content of circulating hydrogen methane after desulfurization is not affected. In addition, the methane content in circulating hydrogen after desulfurization is mainly affected by the content of new hydrogen methane.
-
(3)
The higher the hydrodesulfurization activity of the catalyst, the higher the methane content in the recycled hydrogen after desulfurization.
-
(4)
The prediction error of this method is less than 1%, and the prediction efficiency is high.
-
(5)
The methane content in circulating hydrogen after desulfurization can be controlled by regularly discharging waste hydrogen, properly increasing the purity of new hydrogen and reducing the reaction temperature and controlling the temperature of high and cold fractions.
Declaration of Competing Interest
The authors declare that they have no known competing financial interests or personal relationships that could have appeared to influence the work reported in this paper.
References
- Research on optimization of PM2.5 content prediction in air haze. Comput. Simulat.. 2017;34:392-395.
- [Google Scholar]
- Waste-to-energy policy in China: a national strategy for management of domestic energy reserves. Energy Sour. Part B-Econ. Plann. Policy. 2017;12:925-929.
- [Google Scholar]
- Effects of anode water content on performance of vehicle fuel cell. Chin. J. Power Sour.. 2018;42:81-84.
- [Google Scholar]
- Estimating enteric methane production for beef cattle using empirical prediction models compared with IPCC Tier 2 methodology. Can. J. Anim. Sci.. 2017;97:1-38.
- [Google Scholar]
- The customer churn prediction based on emotional polarity and BPNN. J. China Acad. Electron. Inform. Technol.. 2018;13:114-119.
- [Google Scholar]
- Symposium review: uncertainties in enteric methane inventories, measurement techniques, and prediction models. J. Dairy Sci.. 2018;101:6655.
- [Google Scholar]
- Computational prediction of high methane storage capacity in V-MOF-74. PCCP. 2017;19:21132-21139.
- [Google Scholar]
- Numerical prediction of effects of CO 2 or H 2 content on combustion characteristics and generation efficiency of biogas-fueled engine generator. Int. J. Hydrogen Energy. 2017;42:16991-16999.
- [Google Scholar]
- The right isotherms for the right reasons? Validation of generic force fields for prediction of methane adsorption in metal-organic frameworks. Mol. Simul.. 2017;43:1-10.
- [Google Scholar]
- Recycling utilization patterns of coal mining waste in China. Resour. Conserv. Recycl.. 2010;54:1331-1340.
- [Google Scholar]
- China's Plans and Policies for Reducing CO2 Emission from Biomass-Fired Power Plants: modeling and Economic Study. Energy Sour. Part B-Econ. Plann. Policy. 2017;12:1001-1006.
- [Google Scholar]
- Implementation of a quantum cascade laser-based gas sensor prototype for sub-ppmv H2S measurements in a petrochemical process gas stream. Anal. Bioanal. Chem.. 2017;409:729-739.
- [Google Scholar]
- Machine learning using combined structural and chemical descriptors for prediction of methane adsorption performance of metal organic frameworks (MOFs) ACS Comb. Sci.. 2017;19:640.
- [Google Scholar]
- Prediction of enteric methane emission from cattle using linear and non-linear statistical models in tropical production systems. Mitig. Adapt. Strat. Glob. Change. 2017;22:629-650.
- [Google Scholar]
- Application of ANFIS and MLR models for prediction of methane adsorption on X and Y faujasite zeolites: effect of cations substitution. Neural Comput. Appl.. 2017;28:301-312.
- [Google Scholar]
- Prediction model of methane yield from low-rank coal based on data fusion and IGA-RGRNN algorithm. J. Power Supply. 2018;16:178-184.
- [Google Scholar]
- Ruan, R., Cao, J., Chao, L., 2017. The Influence of Micro-Oxygen Addition on Desulfurization Performance and Microbial Communities during Waste-Activated Sludge Digestion in a Rusty Scrap Iron-Loaded Anaerobic Digester. Energies 10, 258.
- Dual-layered paper-structured catalysts for sequential desulfurization and methane-steam reforming of simulated biogas containing hydrogen sulfide. J. Mater. Sci.. 2017;52:314-325.
- [Google Scholar]
- Kinetic modeling of secondary methane formation and 1-olefin hydrogenation in Fischer-Tropsch synthesis over a cobalt catalyst. Int. J. Chem. Kinet.. 2017;49:859-874.
- [Google Scholar]
- Short communication: the effect of linseed oil and DGAT1 K232A polymorphism on the methane emission prediction potential of milk fatty acids. J. Dairy Sci.. 2018;101:5599.
- [Google Scholar]
- Proton Transfer Mechanism of Ground State and Excited State of 1-Hydroxy-2-naphthaldehyde Molecule. J. Jilin Univers. (Sci. Ed.). 2017;55:1582-1586.
- [Google Scholar]
- Methane cycle anaerobic membrane bioreactor with desulfurization for treating high sulfate organic wastewater at normal temperature. Huanjingkexue. 2017;38:5132.
- [Google Scholar]
- Large circulating fluidized bed unit Research and application of automatic control of desulphurization in limestone pipeline. Automat. Instrument. 2018:145-148.
- [Google Scholar]


