

Translate this page into:
Predicting the outcome of heart failure against chronic-ischemic heart disease in elderly population – Machine learning approach based on logistic regression, case to Villa Scassi hospital Genoa, Italy
⁎Corresponding author at: Faculty of Computer Science, Goce Delčev University of Štip, Krste Misirkov No.10-A P.O. Box 201, Štip 2000, Macedonia. done.stojanov@ugd.edu.mk (Done Stojanov),
-
Received: ,
Accepted: ,
This article was originally published by Elsevier and was migrated to Scientific Scholar after the change of Publisher.
Peer review under responsibility of King Saud University.
Abstract
Totally 167 patients were admitted at cardiology ward in Villa Scassi hospital, Genoa, Italy. We worked with two control groups: heart failure 59 patients (mean age: 71.37 ± 13.27 years) and chronic-ischemic heart disease 108 patients (mean age: 68.85 ± 11.3 years). Nine parameters: Hb, Serum Creatinine, LDL, HDL, Triglycerides, ALT, AST, hs-cTnI, CRP were evaluated onset to hospitalization. We aimed to identify significant independent predictors relative to the outcome of heart failure versus chronic-ischemic heart disease and select combination of biochemical parameters in logistic regression-based model that would provide on average excellent discrimination to the outcome of heart failure versus chronic-ischemic heart disease in elderly population. Applying 20-fold repeated stratified cross-validation, 4:1 train/test ratio split, we have found that model: , probability of heart failure, provides best discrimination of the outcome of heart failure against chronic-ischemic heart disease, having learned coefficients: upon training set.
Keywords
Heart failure
Chronic-ischemic heart disease
Machine learning
Logistic regression
Diagnostic
Prediction

- NCD
-
Noncommunicable chronic disease
- CVD
-
Cardiovascular Disease
- CAD
-
Coronary Artery Disease
- CCS
-
Chronic Coronary Syndrome
- IHD
-
Ischemic Heart Disease
- CIHD
-
Chronic-Ischemic Heart Disease
- SIHD
-
Stable Ischemic Heart Disease
- HF
-
Heart Failure
- CHF
-
Chronic Heart Failure
- MI
-
Myocardial Infraction
- EJ
-
Ejection fraction
- AMI
-
Acute Myocardial Infraction
- TC
-
Total Cholesterol
- HDL
-
High-density Lipoprotein
- LDL
-
Low-density Lipoprotein
- TGs
-
Triglycerides
- MetS
-
Metabolic Syndrome
- DM
-
Diabetes Mellitus
- FCHL
-
Familial Combined Hyperlipidemia
- AST
-
Aspartate Aminotransferase
- ALT
-
Alanine Transaminase
- CPR
-
C-reactive protein
- hs-cTnT
-
High-sensitive Cardiac Troponin T
- hs-cTnl
-
High-sensitive Cardiac Troponin I
- Hb
-
Hemoglobin
- SD
-
standard deviation
- min
-
minimum
- Q1
-
first quartile
- Q2
-
median
- Q3
-
third quartile
- max
-
maximum
- IQR
-
interquartile range
-
skewness
- MLE
-
Maximum Likelihood Estimation
-
deviance residuals
-
natural logarithm of
-
likelihood-ratio test
- ROC
-
receiver operating characteristic
- PR
-
Precision-Recall (PR) curve
- AUROC
-
area under ROC
- AUPRC
-
area under PR curve
-
maximum of the log likelihood function for model
-
classification threshold
- TPR
-
True Positive Rate
- FPR
-
False Positive rate
- TNR
-
True Negative Rate
- p(HF)
-
probability of HF against CIHD
- 95% CI
-
95% confidence interval
- ML
-
machine learning
Abbreviations
1 Introduction
Noncommunicable chronic diseases (NCDs) are a major concern in global health worldwide. According to World Health Organization (WHO), NCDs will account for>80 % of the global burden of disease (GBD) (Wang & Wang, 2020). Besides diabetes, cancer, and chronic respiratory diseases, cardiovascular diseases (CVDs) have the highest number of mortality and morbidity among NCDs estimated at around 17.5 million people (Zhou et al., 2018). In 2030, the death rate from cardiovascular disease is expected to reach 23.4 million (Cassar et al., 2009). The main common denominator of the pathogenesis of CVD is atherosclerosis (Lopez et al., 2021).
In our study, we are discussing two types of cardiovascular diseases: ischemic heart disease (IHD) – more specifically chronic-ischemic heart disease (CIHD) and heart failure (HF) which are linked to coronary artery disease (CAD) (Lopez et al., 2021).
Coronary artery disease (CAD) is a complex pathological process caused by atherosclerosis plaque that builds in the coronary arteries. In that way, the arteries that are supplying the heart with blood, oxygen, and nutrients become more damaged and it affects the blood supply. The main process responsible for this condition is called Atherosclerosis (builds up of fats, cholesterol, and other substances). The plaque obstructs the blood flow and can be obstructive and non-obstructive.
CAD can still be preventable with preventive medical checkups, lifestyle modifications, and early treatment, even while being the leading cause of death and disability (Brown et al., 2020). Many cohort studies like Framingham Heart Study, USLAM, PIVUS, EpiHealth and others have continued to investigate the impact of various risk factors. These studies classified CAD into two categories: modifiable risk factors and non-modifiable risk factors (Borodulin et al., 2018). According to the global case-control study INTERHEART 9 modifiable risk factors accounted for 90 % of the risk of having a first myocardial infraction (MI) such as smoking, dyslipidemia, hypertension, diabetes, abdominal obesity, fruit and vegetable food consumption, regular alcohol consumption, and physical activity (Yusuf et al., 2004). As a contrast, family history, gender, and age, as non-modifiable factors can influence the different outcomes (Costantino, 2016).
Because CAD is dynamic and complex in nature, results in different clinical presentations. In our study, we are analyzing the Chronic Coronary Syndrome (CCS) also referred to as stable ischemic heart disease (SIHD). In the 2019 ESC Guidelines for diagnosis and management of chronic coronary syndrome, CCS is defined by the different evolutionary phases of CAD, excluding clinical presentations of acute coronary artery thrombosis in which this diagnosis dominates.
The most common clinical presentation is ‘chest pain’ typical for stable angina pectoris. Other symptoms can be swelling, fear, increased heart rate. In rare cases, the patients can present atypical symptomatology: elder patients, women, patients with diabetes, dyspnea. For diagnosing IHD the clinician must perform a detailed history, and physical examination, to assess the risk factors for CAD such as dyslipidemia, diabetes, hypertension, smoking, and other lifestyle factors. Standard laboratory biochemical tests, ECG, echocardiography, and chest X-ray needs to be evaluated. Depending on the clinical presentation and symptoms non-invasive and invasive techniques can be done. The general strategy for treatment includes pharmacological treatment and surgical procedures such as revascularization.
On the other hand, Heart Failure (HF) is a complex and heterogeneous clinical syndrome. The diagnosis of HF can be defined as the inability of the heart structure and function to insufficient pump enough blood, therefore, to provide enough oxygen, to all the cells in the body to function properly and satisfy their metabolic needs as tissues (Bozkurt et al., 2021). The prevalence approximately is estimated at 64.34 million people worldwide, with an increasing tendency (Saia et al., 2021). Besides improved pharmacological treatments and innovative device therapies, the morbidity and mortality rate are still ascending (Saia et al., 2021).
Predisposing frequent etiological causes include coronary artery disease, hypertension, and cardiomyopathy causing abnormality in function.
Heart failure is commonly diagnosed by the following symptoms: shortness of breath on effort or also at night during supine position, swelling of the ankles. History of myocardial infarction, and anginal chest pain, can sometimes be the symptoms of heart failure when ischemic heart disease provokes heart failure.
HF can be categorized into two categories: HF with reduced EJ (ejection fraction), and HF with preserved EJ. The measurements of EJ help us to track the progress or stability of the chronic disease, classify heart failure, and to decide the ongoing treatment plan (Bozkurt et al., 2021). Diagnosing heart failure is a combination of medical professionals evaluating symptoms, signs, laboratory biomarkers, and medical visualization techniques (Inamdar et al., 2016).
Patients diagnosed with HF for quite some time, for them often we say they are having chronic HF (CHF). If CHF is worsening, the patient can be described as ‘decompensated’. This can happen slowly or acutely. Acute myocardial infarction (AMI) can be a reason for the acute manifestation of HF.
One fact about diagnosing patients with HF is concerning. Studies say that HF with preserved ejection fraction is easily missed up to 76 % of the unrecognized cases. Lack of visualization diagnostic methods in primary care is a primary reason for the misidentification of HF. Chronic obstructive pulmonary disease, aging, or obesity, are the most frequent diagnosis that usually HF get misdiagnosed for (Groenewegen et al., 2020).
Research developments in basic and clinical trials acknowledged that some blood parameters can be used as predictors for CVD. High plasma LDL concentrations contribute to the process of atherosclerosis, while plasma high-density lipoprotein (HDL) is having a protective role, and it is reducing the risk of CVD because is negatively associated with atherosclerosis (Badimon et al., 2012). Studies show that dyslipidemia is a major predictor of CVD (Kim et al., 2019). Triglycerides (TGs) are now recognized as a distinct risk factor for cardiovascular disease. When TGs are elevated, lipoprotein metabolism is altered, increasing CVD risk (Jeppesen et al., 1998). Patients with metabolic syndrome (MetS), type 2 diabetes (DM), or familial combined hyperlipidemia (FCHL) often have hypertriglyceridemia (Harchaoui et al., 2009). Anemia is a predictor of poor outcomes of chronic heart failure patients and a significant risk factor also, in patients diagnosed with IHD (Zeidman et al., 2004). Serum AST and ALT may be used as early predictors identifiers of chronic heart disease in the early stages (Shen et al., 2015). Persistent CRP elevation may be an indicator of atherosclerotic cardiovascular disease (Kim SB et al., 2002). Higher levels are linked to more severe heart failure features, as well as mortality and morbidity (Anand et al., 2005). Elevated Serum Creatinine has been associated with increased mortality in hypertensive persons who are at risk for developing cardiovascular disease (Wannamethee et al., 1997). As a non-invasive biomarker for the detection of myocardial damage, hs-cTnT has recently gained popularity. Independent of the underlying condition, high levels of hs-cTnT in the blood are linked to increased cardiac events and mortality rates (Askin et al., 2020).
Machine learning for healthcare diagnostics and clinical-decision making has been widely explored topic: (Princy et al., 2020), (Dwivedi, 2018), (Yip et al., 2017), (Lakshmi et al., 2021), (Tsigalou et al., 2021), (Syarif et al., 2016), (Ward et al., 2020). Variety of models, such as: Logistic Regression: (Princy et al., 2020), (Dwivedi, 2018), (Ward et al., 2020); Support Vector Machines (SVM): (Princy et al., 2020), (Dwivedi, 2018); Deep Neural Networks (DNN) (Tsigalou et al., 2021), Naive-Bayes classifier: (Princy et al., 2020), (Dwivedi, 2018), (Lakshmi et al., 2021) and methods, such as: Random Forest: (Princy et al., 2020), (Lakshmi et al., 2021), (Ward et al., 2020); K-nearest neighbor (KNN) algorithm: (Princy et al., 2020), (Lakshmi et al., 2021); Ridge Regression method: (Yip et al., 2017), AdaBoost (Yip et al., 2017); Extreme Gradient Boosting (XGBoost): (Tsigalou et al., 2021), (Ward et al., 2020) optimization, have been used for such purpose. Machine learning models for cardiovascular diagnostic have been used to discriminate among diseased and non-diseased subjects (Dwivedi, 2018), predict cardiovascular risk (Lakshmi et al., 2021), (Ward et al., 2020), estimate expected LDL level (Tsigalou et al., 2021). Models operate on fixed parameters of interest, such as: biochemical variables (most common scenario) (Lakshmi et al., 2021), (Dwivedi, 2018), (Tsigalou et al., 2021), (Ward et al., 2020), status variables (Ward et al., 2020), demographic variables (Ward et al., 2020). Parameters, such as: Sex, Blood Pressure, Heart Rate, Diabetes, Hyper cholesterol, Body Mass Index (obesity), HDL, LDL, total cholesterol and triglycerides have been used as covariates in machine learning models. Some studies had even compared the performance of different machine learning models: (Dwivedi, 2018) for cardiovascular discrimination. Models’ performance has been evaluated based by: Confusion matrix, Precision, Recall, F1-Score, Accuracy (Princy et al., 2020), AUC score under the ROC or PR curves (Ward et al., 2020), (Krishnan & Kamath, 2019).
1.1 Study aims
Our research aims to decrease the number of misdiagnosed cases of heart failure against chronic-ischemic heart disease according to the prediction of specific blood analysis parameters applying machine learning. For that reason, we accessed nine biochemical variables of potential use: Hb, Serum Creatinine, LDL, HDL, Triglycerides, ALT, AST, hs-cTnI and CRP in 167 cardiac patients, onset to hospitalization. We aimed to examine the predictive utility of each parameter relative to the outcome of heart failure versus chronic-ischemic heart disease and identify combination of biochemical variables in logistic regression-based model that would provide accurate discrimination between the two diagnoses in elderly population. Logistic regression is the most suitable method for analysis of binary classification tasks with high diagnostic ability. We used logistic regression as a core machine learning model and ROC and PR curves as means to evaluate models’ predictive capacity. All findings are reported based on comprehensive computational analysis in Python 3.9.
1.2 Main findings
-
-
Hb and HDL unit-increase reduces the odds of HF against CIHD for 21.18 % and 3.83 % on average, p-value < 0.05;
-
-
AST, ALT and CRP unit-increase increases the odds of HF against CIHD for 3.43 %, 2.46 % and 4.11 % on average, p-value < 0.05;
-
-
Logistic regression-based model upon covariates: Hb + Serum Creatinine + AST + hs-cTnI + CRP provides on average excellent discrimination between heart failure and chronic-ischemic heart disease, AUROC = 0.805 (20-fold cross-validation mean AUROC score reported);
2 Data and materials of analysis
The results from a full blood panel tests of 167 cardiac patients, diagnosed with chronic-ischemic heart disease (CIHD) – 108 and heart failure (HF) – 59, onset to hospitalization at cardiology ward in the hospital Villa Scassi Genoa, Italy in the period February 2020 – March 2021 are considered. ARCHITECT c16000 clinical chemistry analyser (ABBOTT) and ADVIA 2120/2120i (SIEMENS) hematology analyzer were used to access 9 biochemical variables of interest . Blood test files were extracted by SIO SIVIS Health Information System.
Study participants mean age ± standard deviation was 69.74 ± 12.05 years. CIHD patients had mean age of 68.85 years, SD = 11.3, while HF patients had mean age of 71.373 years (SD = 13.27). About three quarters or 74.85 % of study participants were male and 25.15 % female. Totally 77.78 % of CIHD patients were male and 22.22 % female. In the HF group we had 69.49 % male patients and 30.51 % female patients.
For CIHD and HF groups, for all parameters in Σ, we computed: minimum (min), first quartile (Q1), median (Q2), third quartile (Q3), maximum (max), mean, standard deviation (SD), range, interquartile range (IQR) and skewness (
), Table 1. We used: range, interquartile range and standard deviation as measures of variability, Table 1. We computed skewness
to measure distribution’s deviation relative to perfect symmetry and get the direction of outliers. As per rule of thumb:
for approximately symmetrical distribution,
for moderate positive(negative) skewness and
for positive(negative) skewness. We plotted the distribution of each parameter in both control groups: CIHD and HF (Fig. 1).
Parameter
min
Q1
Q2
Q3
max
mean
SD
range
IQR
skewness
LDL (mg/dL) CIHD
26
66
98.5
134.25
244
105.528
46.703
218
68.25
0.8
LDL (mg/dL) HF
21
79
98
108
207
98.678
36.087
186
29
0.581
HDL (mg/dL) CIHD
23
38
43.5
52
80
45.796
11.864
57
14
0.721
HDL (mg/dL) HF
18
32.5
41
45
70
40.847
11.117
52
12.5
0.49
Triglycerides (mg/dL) CIHD
41
82.75
101
136.25
334
119.139
60.615
293
53.5
1.408
Triglycerides (mg/dL) HF
41
69
89
124
326
106.966
61.065
285
55
1.942
hs-cTnI (pg/mL) CIHD
0.1
3.25
6.35
14.9
40060.8
470.005
3916.982
40060.7
11.65
9.709
hs-cTnI (pg/mL) HF
1
13.25
21.9
76.95
3336.1
160.992
483.238
3335.1
63.7
5.286
Hb(g/dL) CIHD
8.1
13.2
14.15
15.1
17.2
14.062
1.56
9.1
1.9
−0.783
Hb(g/dL) HF
8.1
12.15
13.4
14.7
18.5
13.297
2.133
10.4
2.55
−0.058
CRP (mg/L) CIHD
0.3
0.9
1.75
4.925
155.8
6.291
16.593
155.5
4.025
7.164
CRP (mg/L) HF
0.3
4
11.1
30.5
150.7
25.4
35.591
150.4
26.5
1.995
Serum Creatinine (mg/dL) CIHD
0.58
0.8
0.965
1.09
4.56
1.07
0.554
3.98
0.29
4.184
Serum Creatinine (mg/dL) HF
0.59
0.87
1.05
1.29
12.83
1.408
1.653
12.24
0.42
5.83
AST (U/L) CIHD
7
16
19
23
192
21.426
17.463
185
7
8.71
AST (U/L) HF
6
20
23
35
104
28.492
16.285
98
15
2.208
ALT (U/L) CIHD
6
15
21
27.25
61
23.083
10.515
55
12.5
1.117
ALT (U/L) HF
6
14.5
23
37
220
32.712
34.526
214
22.5
3.518
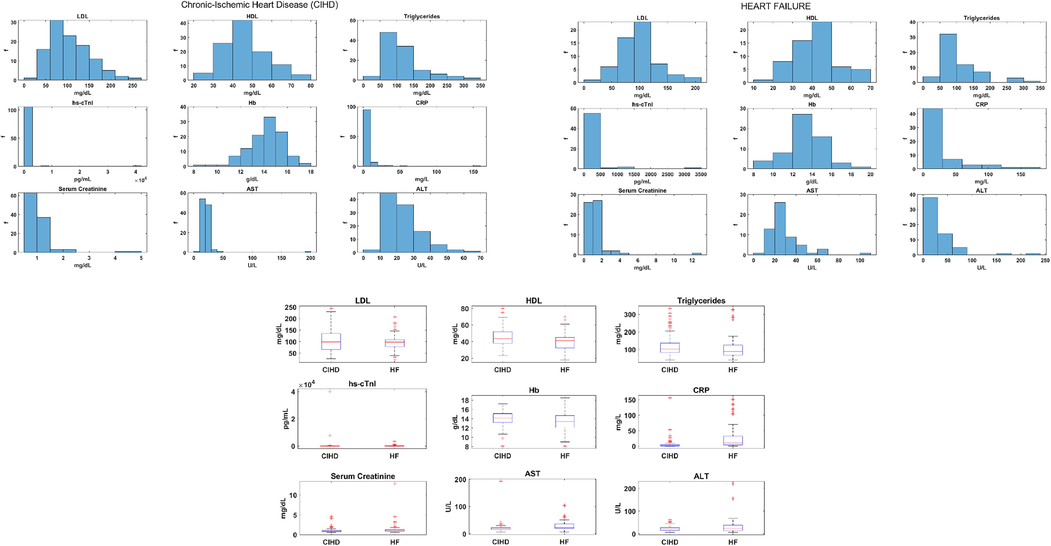
CIHD and HF parameters distribution.
No major difference in HDL, Triglycerides and Hb variability was found among CIHD and HF group, Table 1, Fig. 1. LDL had higher variability in CIHD compared to HF group: ; ; ( , Table 1, Fig. 1. LDL mean and LDL median scored approximately the same in both groups, Table 1. On the other hand, hs-cTnI was unevenly distributed, Table 1. HF group had higher hs-cTnI median 21.9 pg/mL and IQR 63.7 pg/mL that is approximately-six times CIHD hs-cTnI IQR of 11.65 pg/mL, Table 1. At the same time, hs-cTnI mean 470 pg/mL, standard deviation 3916.98 pg/mL and range 40060.7 pg/mL were higher in CIHD control group, Table 1. CRP ranged about the same in both group (Table 1, Fig. 1), but there was significant difference in CRP mean, standard deviation, median and interquartile range between groups, Table 1, Fig. 1. Higher values are attributed to HF: ( ); ( ); ( ), Table 1. Serum Creatinine was more variable in HF group, Table 1. Higher ALT variability was also specific to HF control group: ; ; ; ( ; ; ), Table 1, Fig. 1. HF ALT mean was 32.71 U/L, while CIHD ALT mean was 23.08 U/L, Table 1. We computed mean CIHD AST of 21.43 U/L and 28.49 U/L mean HF AST, Table 1.
3 Computational methods of analysis
We used the dataset of 167 patients that includes data on 9 explanatory variables of interest to examine the potential use of each parameter included in Σ as predictor to the outcome of HF against CIHD and we aimed to find subset of biochemical variables from Σ that provides best discrimination between HF and CIHD. We used logistic regression as a core model in our computational analysis. Parameters’ predictive potential was examined in Python 3.9 convenience interface statsmodels.formula.api and we used Scikit-learn (Sklearn) library (Python 3.9) to measure mean diagnostic capacity provided under particular model section (combination of predictors) based on 20-fold cross-validation.
To identify statistically significant predictors on HF against CIHD we performed single-variable logistic regression analysis in statsmodels.formula.api (Python 3.9). We report odds ratios (log odds ratios) of HF against CIHD for significant regressors (p-value < 0.05). As method for model estimation we used Maximum Likelihood Estimation (MLE), (Myung, 2003). For each model we report: maximum of the log likelihood function: and McFadden’s log likelihood ratio (McFadden, 1973) : as a measure for the goodness of fit, based on the improvement of the model relative to the null model (the model that contains intercept only). We provide comprehensive computational analysis, based on: all data fits, fits having excluded extreme outliers and fits having excluded regression influential points only. Points such as: or are considered as extreme outliers and their impact on regression was examined. On the other hand, deviance residuals (Hosmer et al., 2013) were computed to measure the exact level of discrepancy between the current fit and the ideal fit at each point , thus suggesting points that significantly affect the course of the logistic curve. Deviance residuals were computed as: , if (HF) and if (CIHD), such as: is dichotomous output for data point and is the value of HF probability curve from the estimated model at point . Values for which: or were considered as highly influential and their impact on the goodness of fit was analyzed.
We applied backward stepwise elimination methodology (Marill & Green, 1963) to select combination of significant predictors only, p-value < 0.05. Backwards stepwise elimination methodology aims to identify predictors that act as significant (p-value < 0.05) when joined together. Due to the mutual dependencies in the joint set, variable found as insignificant in the joint set, may also acts as significant when considered independent of the others. We consider this issue in the next section. Throughout the process we monitored likelihood-ratio test p-value or the probability that further nested model restriction would result in better fit relative to the current fit . For selected covariates we examined the joint diagnostic capacity of logistic regression as a binary predictor of diagnosis: 0 for chronic-ischemic heart disease and 1 for heart failure. For that purpose, we applied 20-fold repeated stratified cross-validation. Repeated cross-validation provided an unbiased estimate of the mean discrimination capacity of the model, while stratification preserved the same ratio of CIHD to HF patients in the train and test splits due to the presence of moderate class imbalance in our dataset (108 CIHD patients (64.7 %), 59 HF patients (35.3 %)). The set of 167 cardiac patients was shuffled each time the cross validation was repeated that ensured training and testing logistic regression models for different combinations of cardiac patients. The overall diagnostic performance was summarized by mean AUROC score (area under the receiver operating characteristic). To estimate the average precision of the model on HF predictions (the positive or the minority class) we computed the area under the mean Precision-Recall (PR) curve, AUPRC.
Significance level was set to 0.05. In contemporary statistical decision theory, it is widely assumed that one common value for the level of significance is 0.05 (Siegel, 1956). Logistic regression was fitted five times, such as the most insignificant predictor (highest p-value) was discarded from the domain Σ, until there were left only significant predictors (p-value < 0.05), Table 2. As we refitted the regression,
p-value gradually improved, Table 2. We gradually discarded: ALT (U/L) (p-value = 0.764), LDL (mg/dL) (p-value = 0.628), Triglycerides (mg/dL) (p-value = 0.410) and HDL (mg/dL) (p-value = 0.192) from Σ, until all left covariates were statistically significant: Hb + SerumCreatinine + AST + hs-cTnI + CRP, Table 2.
Model
p-value
Hb (g/dL)
Serum Creatinine (mg/dL)
AST (U/L)
ALT (U/L)
LDL (mg/dL)
HDL (mg/dL)
Triglycerides (mg/dL)
hs-cTnI (pg/mL)
CRP (mg/L)
1
2.495× 10⁻⁹
0.012
0.088
0.001
4
0.622
0.122
0.357
0.005
0.008
2
9.095 × 10⁻¹⁰
0.010
0.089
0.000
0.124
0.358
0.007
0.008
3
3.320 × 10⁻¹⁰
0.011
0.092
0.000
0.142
0.007
0.008
4
1.390 × 10⁻¹⁰
0.008
0.079
0.000
0.006
0.006
5
8.944 × 10⁻¹¹
0.010
0.049
0.000
0.004
0.006
Best model
Hb
Serum Creatinine
AST
hs-cTnI
CRP
We applied 20-fold repeated stratified cross-validation to the input dataset of 167 cardiac patients to check the joint diagnostic capacity of suggested selection: Hb + SerumCreatinine + AST + hs-cTnI + CRP. Prior cross-validation, we applied data standardization. Applying equation:
(
predictor mean value,
predictor standard deviation), predictors’ values
were transformed to
– distribution with mean value 0 and standard deviation 1. We used 4:1 train-test ratio split (Lakshmi et al., 2021), (Ward et al., 2020) or 80 % of the cardiac patients (134 cardiac patients) were used to fit logistic regression models and the remaining 20 % (33 cardiac patients) were used to test the models. This was repeated 4 times on shuffles to the input dataset, that provided training/testing models for different combinations of cardiac patients. Train-test ratio of 4:1 means that we spilt the dataset into 5 folds, such as: 4-folds were used to train the model and 1-fold was used to test the model, Fig. 2. Since there are 5 different folds that can be used for testing and the remining 4 for training, each repetition resulted in 5 trained and tested models, Fig. 2. Given that we repeated the cross validation 4 times, we were able to estimate the diagnostic capacity of totally 20 models of logistic regression.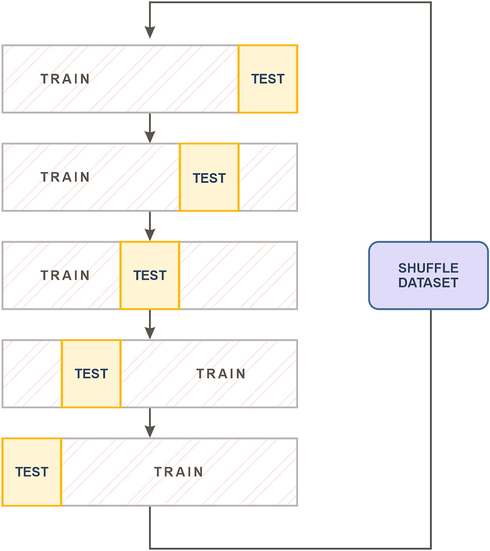
Cross-validation – 4:1 train-test ratio split, repeated 4 times.
For trained models we used test splits to compute ROC (Zweig & Campbell, 1993) and PR curves (Saito & Rehmsmeier, 2015). ROC and PR curves are powerful means to estimate diagnostic ability of the model over a range of classification thresholds
. This means that instead of examining the discrimination capacity of the model at fixed cut-off point – classification threshold (*by default
), it is examined for all real numbers in the range [0–1] taken as decision thresholds. For illustration, given a trained model under: Hb + Serum Creatinine + AST + hs-cTnI + CRP, for each patient in the test set
(Eq. (1)) is computed for standardized: Hb, Serum Creatinine, AST, hs-cTnI, CRP values. IF
the patient is classified as HF patient, otherwise as CIHD patient and this is done not just for one cut-off
, but for all decision thresholds
s in the range [0–1].
: probability of HF.
Receiver Operating Characteristic (ROC) curve summarizes discrimination potential of the model to assign patients to the right class. It is plotted as trade-offs between True Positive Rate (TPR) (also referred as Recall or Sensitivity) (Eq. (2)) and False Positive rate (FPR) (Eq. (3)) at all possible classification thresholds
,
. In our case, TPR or the Recall measures how many of the real HF patients were ranked as HF, while FPR measures the fraction of CIHD patients that were mispredicted as HF patients. Since there is a relation between FPR and True Negative Rate (TNR or Specificity) or how many of CIHD patients were actually predicted as CIHD, such as: FPR = 1-TNR, ROC curve may be also seen as plot of Sensitivity versus 1-Specificitiy at different decision thresholds. The area under the ROC curve AUROC may be seen as probability that randomly selected HF patient is ranked as more likely to be HF patient than randomly selected CIHD patient.
TP (true positives): number of HF patients predicted as HF patients.
FN (false negatives): number of HF patients mispredicted as CIHD patients
FP (false positives): number of CIHD patients mispredicted as HF patients.
TN (true negatives): number of CIHD patients predicted as CIHD patients.
Given that we are not interested in model’s performance for true negatives (CIHD patients predicted as CIHD), Precision-Recall (PR) curve offers selective estimation of model’s diagnostic ability, biased towards the positive class – HF. PR curve is plotted as trade-offs between Precision (Eq. (4)) – how many of the predicted HF patients were actually true HF patients and Recall (Eq. (2)) – how many of the true HF patients were actually predicted as HF patients at every single classification threshold
,
. The area under the PR curve AUPRC in our case is the average precision on HF predictions.
In the cross-validation, we trained and tested totally 20 models of logistic regression and we computed the same number of ROC and PR curves. Trapezoidal rule was used to compute AUROC (Bradley, 1997) (Eq. (5)) and AUPRC (Boyd et al., 2013) (Eq. (6)).
: sampling interval.
TPR(i),Precision(i): i'th TPR, Precision sample.
4 Results
Single-variable logistic regression analysis in Python 3.9 statsmodels was performed. For all models we report: McFadden’s Pseudo
, the maximum of the log likelihood function
, predictor’s regression coefficient: log odds ratio (odds ratio), 95 % confidence interval and the p-value. For each model we computed and plotted the probability of HF against CIHD curve – p(HF) in addition to extreme outliers and residual deviances
, Fig. 3. Both McFadden’s Pseudo
and
may be taken as measures for the goodness of fit, expect that
s are suitable for visual inspection of the goodness of fit, Fig. 3. The more
s asymptotically approach the p(HF) curve, the more the goodness of fit has improved, Fig. 3.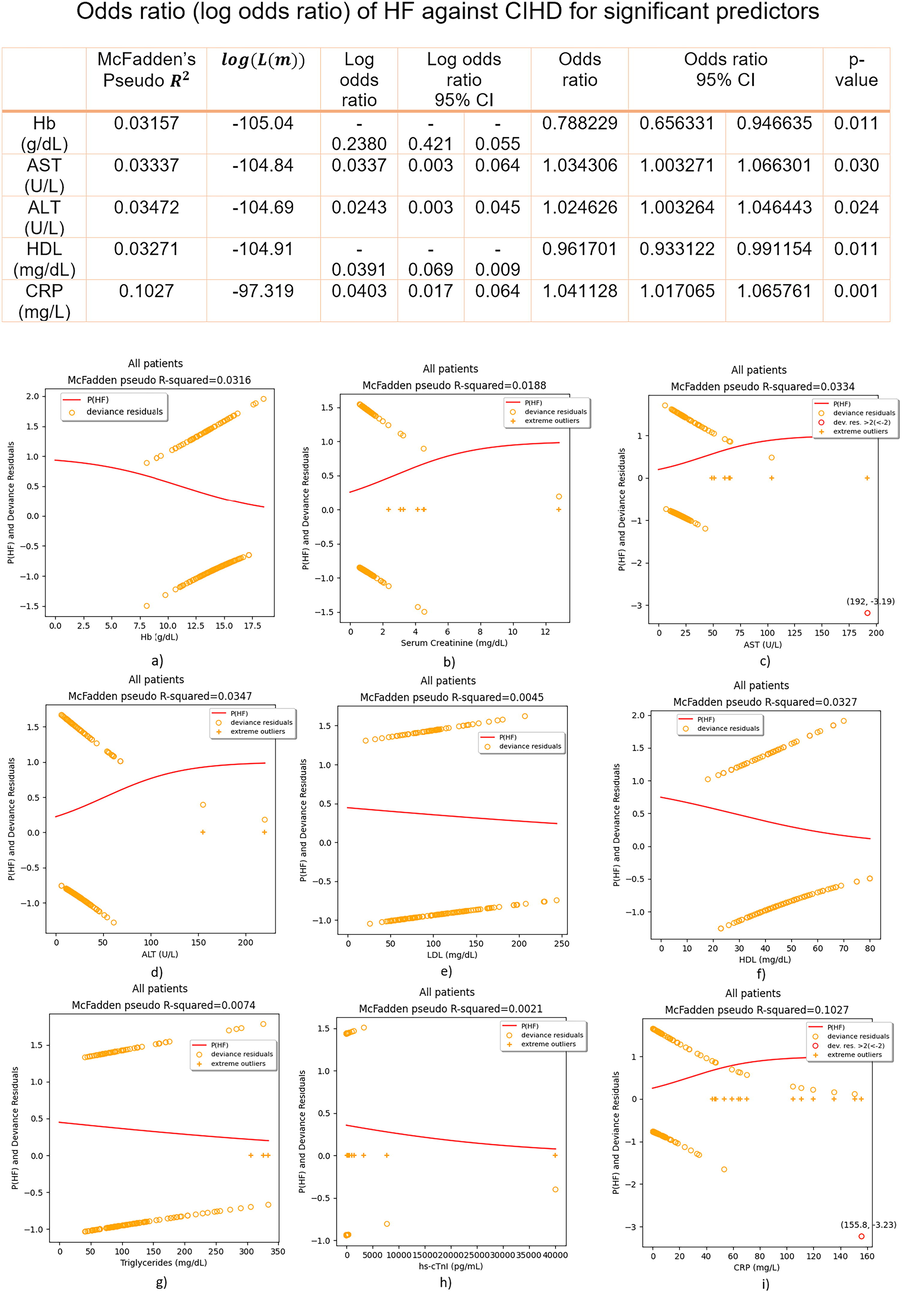
Regression fits and odds ratio (log odds ratio) of HF against CIHD for significant predictors – all patients included.
Plots matched numerical results, Fig. 3, Fig. 4, Fig. 5. For parameters that are significant predictors of the outcome: 0(CIHD)/1(HF), sigmoidal (S-shaped) p(HF) curves were plotted, either positive or negative, Fig. 3. For insignificant predictors p(HF) lacked the logistic S-shape and it was linear most of the time, Fig. 3. Of all insignificant predictors, only hs-cTnI becomes significant as predictor, if extreme outliers are removed, Fig. 4. In principle, removing extreme outliers for significant predictors did not improved the goodness of fit (estimated by McFadden’s Pseudo
and
distribution), Fig. 4. The goodness of fit for significant predictors was improved by having discarded highly influential residuals only:
(
), Fig. 5.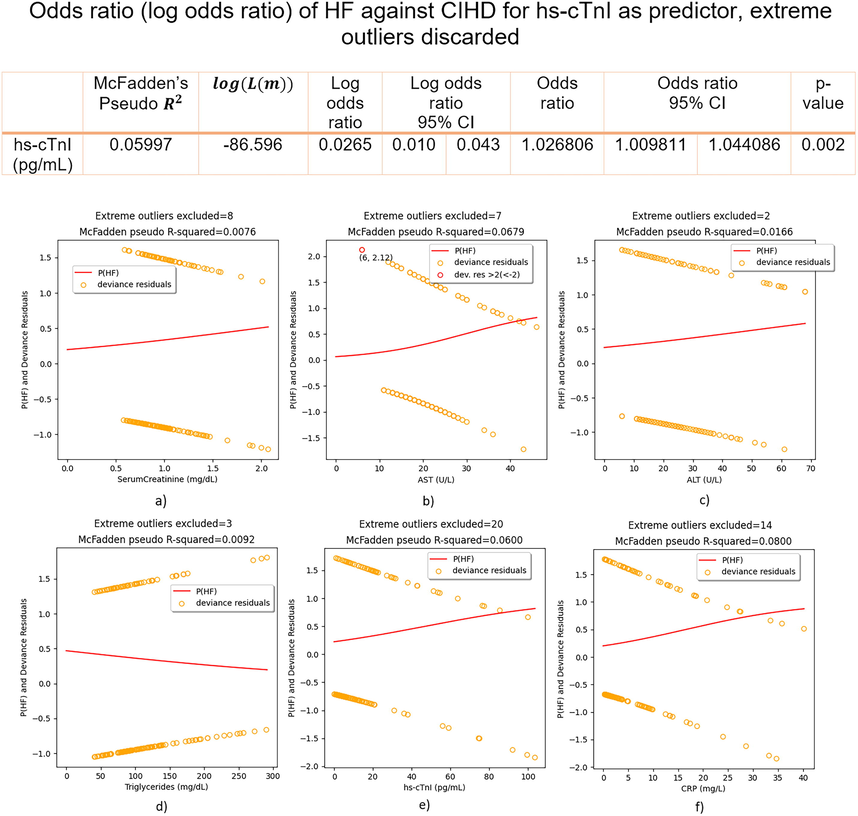
Regression fits and odds ratio (log odds ratio) of HF against CIHD for hs-cTnI as predictor – extreme outliers discarded.
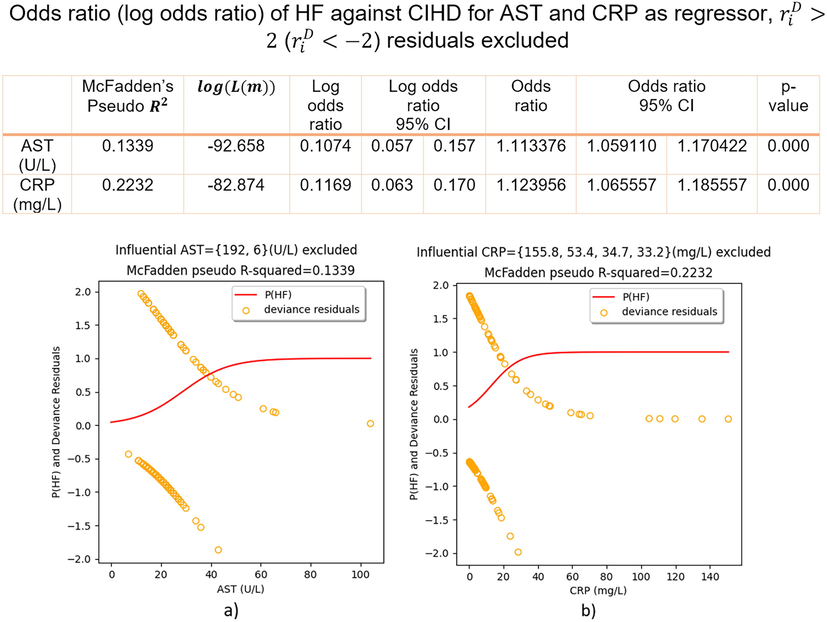
Regression fits and odds ratio (log odds ratio) of HF against CIHD for AST and CRP as regressors,
(
) discarded.
Regressors: Hb, AST, ALT, HDL and CRP were found as independent, statistically significant predictors (p-value < 0.05) of HF against CIHD, Fig. 3. Hb and HDL negative P(HF) curve (Fig. 3) indicates on reduced odds of HF against CIHD having increased Hb or HDL, while AST, ALT and CRP positive P(HF) curve indicates on increased odds of HF against CIHD having increased AST, ALT or CRP (Fig. 3). We have found that (Fig. 3):
-
g/dL increase of Hb reduces the odds of HF against CIHD for 21.18 % on average, 95 % CI = [5.34 – 34.37]%, p-value = 0.011;
-
U/L increase of AST increases the odds of HF against CIHD for 3.43 % on average, 95 % CI = [0.33 – 6.63]%, p-value = 0.03;
-
U/L increase of ALT increases the odds of HF against CIHD for 2.46 % on average, 95 % CI = [0,33 – 4,64]%, p-value = 0.024;
-
mg/dL increase of HDL reduces the odds of HF against CIHD for 3,83 % on average, 95 % CI = [0,88 – 6,69]%, p-value = 0.011;
-
mg/L increase of CRP increases the odds of HF against CIHD for 4.11 % on average, 95 % CI = [1,71 – 6,58]%, p-value = 0.01.
Serum Creatinine (p-value = 0.115), LDL (p-value = 0.328), Triglycerides (p-value = 0.219) and hs-cTnI (p-value = 0.593) were insignificant in predicting the outcome of HF against CIHD. For Triglycerides and LDL as regressors, P(HF) curve was linear, while U-shaped curve for hs-cTnI was plotted, instead of the regular S-shaped curve, Fig. 3. No ( ) points were found for insignificant predictors, but only significant number of extreme outliers in Serum Creatinine (8) and hs-cTnI (20), Fig. 3.
Insignificant regressors’ extreme outliers were removed and we refitted models again, Fig. 4. In that case hs-cTnI becomes significant as independent predictor of HF against CIHD, increasing the odds of HF against CIHD for 2.68 % on average, 95 % CI = [0.98 – 4.41]%, p-value = 0.002 for each pg/mL increase, Fig. 4. This time instead of U-shaped curve, regular S-shaped p(HF) curve was computed, Fig. 4. Removing extreme outliers in Serum Creatinine (8) did not remove p(HF) linearity and no regular S-shaped curve was computed for excluding extreme outliers in Triglycerides (3), Fig. 4. Serum Creatinine (p-value = 0.211) and Triglycerides (p-value = 0.175) were again insignificant as predictors. When it comes to significant predictors, Hb and HDL did not include extreme outliers, while for AST(7), ALT(2) and CRP(14) we recorded slightly improvement of the goodness of fit only for AST (McFadden’s Pseudo increased from 0.0334 to 0.0679), Fig. 4.
Regression highly influential points ( ) were found in AST, values: 192 U/L, 6 U/L and CRP, values: 155.8 mg/L, 53.4 mg/L, 34.7 mg/L and 33.2 mg/L, Fig. 3. Discarding these points only and refitting logistic regressions again: p(HF) curve S-shape improved, McFadden’s Pseudo increased from 0.0334 to 0.1339 for AST and for CRP it was doubled, 0.2232 compared to 0.1027 in the initial fit, Fig. 5. In Fig. 5 we report odds ratio (log odds ratio) of HF against CIHD, having removed residuals ( ) in AST and CRP.
Having discarded AST and CRP regression influential residuals ( ), we have found:
-
VI.
U/L increase of AST increases the odds of HF against CIHD for 11.34 % on average, 95 % CI = [5.91 – 17.04]%, p-value = 0.000;
-
VII.
mg/L increase of CRP increases the odds of HF against CIHD for 12.4 % on average, 95 % CI = [6.56 – 18.56]%, p-value = 0.000.
We examined the mean diagnostic capacity of the combination of statistically significant predictors: Hb + Serum Creatinine + AST + hs-cTnI + CRP (Table 2) in Scikit-learn (Python 3.9). To detect the impact on discrimination ability having discarded specific covariate, the mean diagnostic ability of all models considered in backwards elimination methodology (Table 2) was analyzed. We also examined the impact on discrimination capacity having discarded the least significant of all significant predictors – Serum Creatinine, p-value = 0.049 (Table 2). Totally 20 different combinations of 134 CIHD + HF patients (80 % of data) for models’ training and 33 CIHD + HF patients (20 % of data) for models’ testing were derived from the input dataset of 167 cardiac patients: 108 CIHD + 59 HF patients. Stratification preserved the same percentage of CIHD (64.7 %) to HF (35.3 %) patients in training and testing sets, 87 CIHD + 47 HF = 134 cardiac patients in training sets and 21 CIHD + 12 HF = 33 cardiac patients in testing sets. For all models, we computed 20 models of logistic regression and we plotted models’ Receiver Operating Characteristic (ROC) curves and Precision-Recall (PR) curves, Fig. 6. From ROC and PR curves we computed the mean ROC and the mean PR curve and the area underneath, Fig. 6, Table 3. Obtained results are relevant and comparable in terms of the impact of covariates upon overall diagnostic ability, because we used the same combinations of train-test splits for all models’ selection, Fig. 6, Table 3.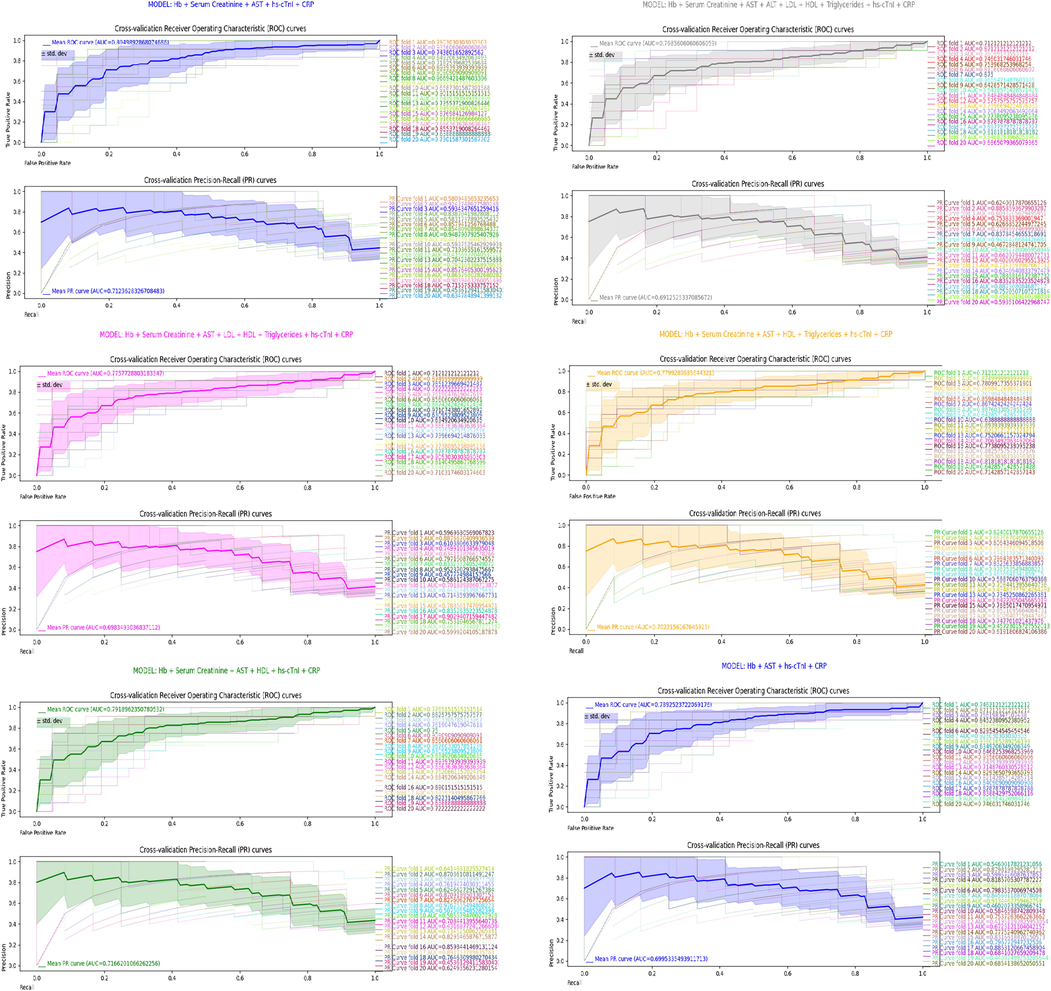
Cross-validation results.
MODEL
Mean AUROC
Mean AUPRC
Hb + Serum Creatinine + AST + ALT + LDL + HDL + Triglycerides + hs-cTnI + CRP
0.769
0.691
Hb + Serum Creatinine + AST + LDL + HDL + Triglycerides + hs-cTnI + CRP
0.776
0.698
Hb + Serum Creatinine + AST + HDL + Triglycerides + hs-cTnI + CRP
0.78
0.702
Hb + Serum Creatinine + AST + HDL + hs-cTnI + CRP
0.792
0.717
Hb + Serum Creatinine + AST + hs-cTnI + CRP
0.805
0.712
Hb + AST + hs-cTnI + CRP
0.789
0.7
The combination of predictors: Hb + Serum Creatinine + AST + hs-cTnI + CRP predicted the true diagnosis: heart failure (1) against chronic-ischemic heart disease (0), 80.5 % of the time (mean AUROC = 0.805), while the average precision on HF predictions was 71.2 % (mean AUPRC = 0.712), Table 3, Fig. 6.
Other combinations of predictors were generally less accurate than: Hb + Serum Creatinine + AST + hs-cTnI + CRP, Table 3. Mean AUROC = 0.769 (mean AUPRC = 0.691) was computed for having all covariates included in the model, Table 3, Fig. 6. Excluding ALT(p-value = 0.764, Table 2) as covariate, we got mean AUROC = 0.776 (mean AUPRC = 0.698), Table 3, Fig. 6. Discarding ALT + LDL(p-value = 0.628, Table 2) as covariates, the mean AUROC was 0.78 (mean AUPRC = 0.702), Table 3, Fig. 6. Having discarded ALT + LDL + Triglycerides(p-value = 0.410, Table 2) as covariates, we computed mean AUROC = 0.792 (mean AUPRC = 0.717), Table 3, Fig. 6.
The combination of all significant predictors: Hb + Serum Creatinine + AST + hs-cTnI + CRP (HDL excluded, p-value = 0.192, Table 2) provided best discrimination score of 0.805 mean AUROC, Table 3, Fig. 6. Further model restriction did not improve discrimination ability. Having discarded the least significant of all significant predictors – Serum Creatinine (p-value = 0.049, Table 2), the combination of predictors: Hb + AST + hs-cTnI + CRP resulted in mean AUROC of 0.789 (mean AUPRC = 0.7), Fig. 6, Table 3 or slightly worse results compared to model having included Serum Creatinine as predictor were obtained. The mean AUROC score of the model that provides best discrimination ability: Hb + Serum Creatinine + AST + hs-cTnI + CRP forms an elbow point in AUROC scores line plot, Fig. 7.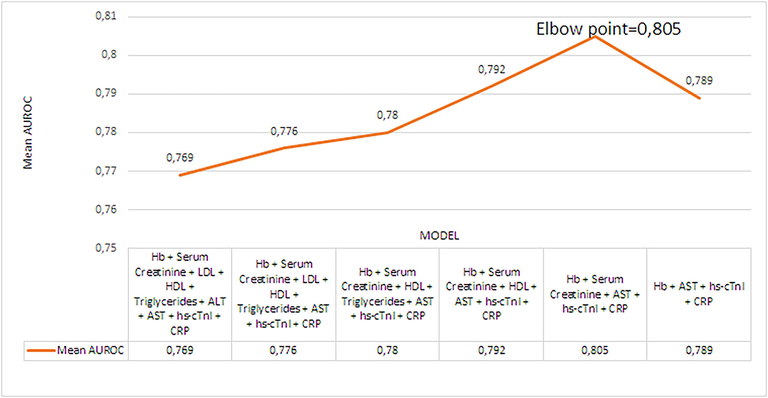
Mean AUROC scores line plot.
5 Discussion
Our preliminary findings based on logistic regression analysis of 167 CIHD + HF cardiac patients, suggests positive correlation between: AST, ALT, CRP and the outcome of HF against CIHD, while negative correlation between: Hb, HDL and the outcome of HF against CIHD, Fig. 3. Having included regressor’s all data, Serum Creatinine, LDL, Triglycerides and hs-cTnI were not significant as predictors, (p-value > 0.05). The basic assumption of logistic regression for linearity between log odds and the outcome CIHD(0)/HF(1) was corrupted in the case of hs-cTnI due to the high percentage of extreme outliers (11.98 %) in hs-cTnI distribution, Fig. 3. In absence of extreme outliers, hs-cTnI is highly reliable (p-value = 0.002) prognostic factor of the outcome of HF against CIHD, such as pg/mL increase of hs-cTnI increases the odds of HF against CIHD for 2.68 % on average, Fig. 4.
Since the goodness of fit is primarily affected by particular residuals of high influence ( ), we computed highly reliable results, having discarded such residuals out of AST and CRP regression models, Fig. 5. At p-value = 0.000 we found that U/L increase of AST increases that odds of HF against CIHD for 11.34 % and mg/L increase of CRP increases the odds for 12.4 % on average, Fig. 5. One can say that one-unit increase either in AST or CRP resulted in approximately 12 % increased odds of HF against CIHD, Fig. 5.
Model selection plays pivotal role in machine learning. Following results in Table 3 (mean AUROC(AUPRC) scores), model’s ability to discriminate between HF and CIHD depends of the predictors included in the model. As estimated by the mean AUROC score, removing insignificant predictor improved mean diagnostic capacity, Table 3. The mean diagnostic capacity increased for 0.72 % on average for having removed one insignificant predictor, Table 3. On moderate-sized dataset (167 CIHD + HF cardiac patients), we have identified model: Hb + Serum Creatinine + AST + hs-cTnI + CRP that provides on average excellent discrimination (Mandrekar et al., 2010) between HF and CIHD (mean AUROC score = 0.805 > 0.8), Fig. 6, Table 3. Our 20-fold cross-validation analysis showed that the model: Hb + Serum Creatinine + AST + hs-cTnI + CRP can assign in 80.5 % of the time higher rank to randomly selected HF patient than randomly selected CIHD patient. Three models: Hb + Serum Creatinine + AST + HDL + Triglycerides + hs-cTnI + CRP; Hb + Serum Creatinine + AST + HDL + hs-cTnI + CRP; Hb + Serum Creatinine + AST + hs-cTnI + CRP had acceptable mean diagnostic precision on HF (mean AUPRC score > 0.7), Table 3. Off all three, model Hb + Serum Creatinine + AST + HDL + hs-cTnI + CRP had the highest mean AUPRC score of 0.717, Table 3. If we had higher number of patients, AUROC(AUPRC) score would be higher.
Even though Serum Creatinine is insignificant as single predictor (p-value = 0.115), its covariance in addition to: Hb, AST, hs-cTnI and CRP positively affects the overall discrimination ability of the model, Table 3, Fig. 6. Model Hb + AST + hs-cTnI + CRP had mean AUROC(AUPRC) score of 0.789(0.7) compared to 0.805(0.712) for the model Hb + Serum Creatinine + AST + hs-cTnI + CRP, Table 3, Fig. 6.
Some studies (Princy et al., 2020) investigate machine learning models for cardiovascular diagnostic on public or freely accessible data. In this study we sourced our own data and applied machine learning. Current studies explore different types of parameters as covariates in machine learning models, such as: demographic (Ward et al., 2020), (Lakshmi et al., 2021), biochemical (Lakshmi et al., 2021), carotid artery ultrasound images (Lakshmi et al., 2021) and status parameters, such as: smoking or diabetes status (Ward et al., 2020), (Princy et al., 2020). We used biochemical variables in our study. Some biochemical variables, such as: cholesterol, triglycerides (Lakshmi et al., 2021) are used as covariates in other studies but in addition to parameters that are very different from the parameters considered in this study. No study so far has evaluated the joined predictive capacity of biochemical parameters considered here. Studies for cardiovascular diagnostic apply machine learning usually to discriminate among healthy and diseased individuals, (Dwivedi, 2018), (Lakshmi et al., 2021). Diseased subjects are usually annotated as positive class (1), while non-diseased subjects as negative class (0) and the main purpose of machine learning model is to discriminate among classes. We go step forward that we aim to discriminate between two different cardiovascular diagnoses: CIHD (0), negative class and HF (1), positive class, that has not been addressed so far. As usual practice, different machine learning models are evaluated in order to identify which model provides best discrimination utility under fixed set of variables of interest (Princy et al., 2020), (Dwivedi, 2018). We aim to select optimal set of variables for discrimination of HF against CIHD. The problem of selection of near-optimal parameter combination was examined in (Syarif et al., 2016), comparing the performance of Grid Search against Genetic Algorithm for SVM parameter optimization. For the same purpose we used Logistic Regression in our study. Only few studies implement cross-validation as regular model evaluation technique, (Dwivedi, 2018) (10-fold cross-validation), (Ward et al., 2020) (5-fold cross-validation). We did the same, but for higher number of folds = 20 (20-fold cross-validation). Results at random or optimal cut-off point may be reported if ROC or PR analysis is dismissed. ROC (PR) analysis is provided in (Ward et al., 2020) and both characteristics (ROC and PR) are considered in (Krishnan & Kamath, 2019). Since one characteristic analysis (ROC or PR) may provide partial insight towards model’s discrimination ability, in our study we examined both characteristics: ROC and PR. In order to increase diagnostic accuracy, some studies apply hyperparameter tuning (Ward et al., 2020). We did not tune any parameter and still got satisfactory AUROC score of 0.805 for Hb + Serum Creatinine + AST + hs-cTnI + CRP. Time series in data may undermine model’s reliability and only few studies, such as (Ward et al., 2020), properly address this inquiry, considering the most recent data. If data before and after therapeutic treatment, before and after surgery, before and after lifestyle modification, participates equally in machine learning model, the model loses its credibility on predictions under specific circumstances. We used blood analysis results obtained onset to hospitalization, as we aimed to tailor predictivity to a specific medical condition or scenario – discriminate HF versus CIHD based on values of specific blood parameters in crucial moments when patients are hospitalized at the cardiac or emergency care unit with serious symptoms. Our model can be used as a direct aid to clinical-decision making and likely help in reducing the time in relation to establish a diagnosis.
6 Conclusion
In this study we have exploited the computational capacity of logistic regression as a core model for predicting of the outcome of heart failure against chronic-ischemic heart disease in elderly population. For that reason, we sourced data from 167 cardiac patients (108 CIHD and 59 HF), hospitalized at cardiology ward in Villa Scassi hospital Genoa, Italy. We considered data on 9 biochemical variables: Hb, Serum Creatinine, LDL, HDL, Triglycerides, ALT, AST, hs-cTnI, CRP, onset to hospitalization.
Based on comprehensive cross-validation analysis we have identified subset of biochemical variables: Hb + Serum Creatinine + AST + hs-cTnI + CRP that provides excellent discrimination between HF and CIHD. We have computed that logistic regression ML model run upon this combination of covariates can assign in 80.5 % of the time on average higher rank to randomly selected HF patient than CIHD patient. This point is one of the main contributions of our study, as we recommend: Hb + Serum Creatinine + AST + hs-cTnI + CRP combination for accurate early detection of the outcome of HF versus CIHD in logistic regression-based model.
The predictive potential of each biochemical parameter was also investigated. Our computational study found that unit increase of AST, ALT or CRP increases the odds of HF against CIHD for 3.43 %, 2.46 % and 4.11 % respectively, p-value < 0.05. On the other hand, unit increase of Hb or HDL reduces the odds of HF against CIHD for 21.18 % and 3.83 % respectively, p-value < 0.05. Hs-cTnI increases the odds of HF against CIHD in absence of extreme outliers. Since AST and CRP regression fits were negatively impacted by particular observations: ( ), AST and CRP goodness of fit dramatically improved after discarding them out of models. In such circumstances, we have computed that one-unit increase of AST or CRP increases the odds of HF against CIHD for approximately 12 % on average.
The small number of patients that we worked with (totally 167), was identified as limitation and reason why ROC AUC scored 0.805 for the best model selection, that on the contrary was expected to be higher. However, we provide model for development of reliable software for better-informed decision-making processes and time-saving benefits in emergency situations. Our model, with ongoing research and development, can be further improved in addition to other chronic diseases. Meanwhile the number of available patients has increased, that opens the possibility for development of well-trained application with ultimate diagnostic precision.
7 Ethics statement
This is anonymous, retrospective, observational study that complies with the principles outlined in the Declaration of Helsinki.
8 Data availability
Appendix: DataSetVillaScassiCardiologyWard.xlsx file.
Declaration of Competing Interest
The authors declare that they have no known competing financial interests or personal relationships that could have appeared to influence the work reported in this paper.
References
- C-reactive protein in heart failure: prognostic value and the effect of valsartan. Circulation. 2005;112(10):1428-1434.
- [Google Scholar]
- Clinical importance of high-sensitivity troponin T in patients without coronary artery disease. Northern Clin. İstanbul. 2020;7(3):305.
- [Google Scholar]
- LDL-cholesterol versus HDL-cholesterol in the atherosclerotic plaque: inflammatory resolution versus thrombotic chaos. Ann. N. Y. Acad. Sci.. 2012;1254(1):18-32.
- [Google Scholar]
- Borodulin, K., Tolonen, H., Jousilahti, P., Jula, A., Juolevi, A., Koskinen, S., Kuulasmaa, K., Laatikainen, T., Männistö, S., Peltonen, M., & Perola, M. (2018). Cohort profile: the National FINRISK study. International journal of epidemiology, 47(3), 696-696i.
- September). Area under the precision-recall curve: point estimates and confidence intervals. Berlin, Heidelberg: Springer; 2013. p. :451-466.
- Universal definition and classification of heart failure: a report of the heart failure society of America, heart failure association of the European society of cardiology, Japanese heart failure society and writing committee of the universal definition of heart failure. J. Card. Fail.. 2021;27(4):387-413.
- [Google Scholar]
- The use of the area under the ROC curve in the evaluation of machine learning algorithms. Pattern Recogn.. 1997;30(7):1145-1159.
- [Google Scholar]
- Brown, J. C., Gerhardt, T. E., & Kwon, E. (2020). Risk factors for coronary artery disease.
- Cassar, A., Holmes Jr, D. R., Rihal, C. S., & Gersh, B. J. (2009, December). Chronic coronary artery disease: diagnosis and management. In Mayo Clinic Proceedings (Vol. 84, No. 12, pp. 1130-1146). Elsevier.
- Performance evaluation of different machine learning techniques for prediction of heart disease. Neural Comput. & Applic.. 2018;29(10):685-693.
- [Google Scholar]
- Applied logistic regression. Vol Vol. 398. John Wiley & Sons; 2013.
- Triglyceride concentration and ischemic heart disease: an eight-year follow-up in the Copenhagen Male Study. Circulation. 1998;97(11):1029-1036.
- [Google Scholar]
- Cholesterol levels and development of cardiovascular disease in Koreans with type 2 diabetes mellitus and without pre-existing cardiovascular disease. Cardiovasc. Diabetol.. 2019;18(1):1-11.
- [Google Scholar]
- Persistent elevation of C-reactive protein and ischemic heart disease in patients with continuous ambulatory peritoneal dialysis. Am. J. Kidney Dis.. 2002;39(2):342-346.
- [Google Scholar]
- Krishnan, G. S., & Kamath S, S. (2019). Ontology-driven text feature modeling for disease prediction using unstructured radiological notes. Computación y Sistemas, 23(3), 915-922
- Prediction of cardiovascular risk by measuring carotid intima media thickness from an ultrasound image for type II diabetic mellitus subjects using machine learning and transfer learning techniques. J. Supercomput.. 2021;77(9):10289-10306.
- [Google Scholar]
- Receiver operating characteristic curve in diagnostic test assessment. J. Thorac. Oncol.. 2010;5(9):1315-1316.
- [Google Scholar]
- On the effectiveness of receptors in recognition systems. IEEE Trans. Inf. Theory. 1963;9(1):11-17.
- [Google Scholar]
- McFadden, D. (1973). Conditional logit analysis of qualitative choice behavior.
- May). Prediction of cardiac disease using supervised machine learning algorithms. IEEE; 2020. p. :570-575.
- Innovative transcatheter procedures for the treatment of heart failure. Cardiovasc. Diagn. Ther.. 2021;11(1):292.
- [Google Scholar]
- The precision-recall plot is more informative than the ROC plot when evaluating binary classifiers on imbalanced datasets. PLoS one. 2015;10(3):e0118432.
- [Google Scholar]
- Correlation of serum alanine aminotransferase and aspartate aminotransferase with coronary heart disease. Int. J. Clin. Exp. Med.. 2015;8(3):4399.
- [Google Scholar]
- Nonparametric statistics for the behavorial sciences. McGraw-Hill; 1956.
- SVM parameter optimization using grid search and genetic algorithm to improve classification performance. Telkomnika. 2016;14(4):1502.
- [Google Scholar]
- Estimation of low-density lipoprotein cholesterol by machine learning methods. Clin. Chim. Acta. 2021;517:108-116.
- [Google Scholar]
- Modelling and prediction of global non-communicable diseases. BMC Public Health. 2020;20(1):1-13.
- [Google Scholar]
- Serum creatinine concentration and risk of cardiovascular disease: a possible marker for increased risk of stroke. Stroke. 1997;28(3):557-563.
- [Google Scholar]
- Machine learning and atherosclerotic cardiovascular disease risk prediction in a multi-ethnic population. npj Digital Med.. 2020;3(1):1-7.
- [Google Scholar]
- Laboratory parameter-based machine learning model for excluding non-alcoholic fatty liver disease (NAFLD) in the general population. Aliment. Pharmacol. Ther.. 2017;46(4):447-456.
- [Google Scholar]
- Effect of potentially modifiable risk factors associated with myocardial infarction in 52 countries (the INTERHEART study): case-control study. Lancet. 2004;364(9438):937-952.
- [Google Scholar]
- Anemia as a risk factor for ischemic heart disease. Isr. Med. Assoc. J.. 2004;6(1):16-18.
- [Google Scholar]
- miRNAS in cardiovascular diseases: potential biomarkers, therapeutic targets and challenges. Acta Pharmacol. Sin.. 2018;39(7):1073-1084.
- [Google Scholar]
- Receiver-operating characteristic (ROC) plots: a fundamental evaluation tool in clinical medicine. Clin. Chem.. 1993;39(4):561-577.
- [Google Scholar]
Appendix A
Supplementary material
Supplementary data to this article can be found online at https://doi.org/10.1016/j.jksus.2023.102573.
Appendix A
Supplementary material
The following are the Supplementary data to this article:


