

Translate this page into:
Predicting hydraulic conductivity around septic tank systems using soil physico-chemical properties and determination of principal soil factors by multivariate analysis
⁎Corresponding author. ganiyusa@funaab.edu.ng (S.A. Ganiyu)
-
Received: ,
Accepted: ,
This article was originally published by Elsevier and was migrated to Scientific Scholar after the change of Publisher.
Peer review under responsibility of King Saud University.
Abstract
The knowledge of soil hydraulic conductivity is essential for the study of waste water infiltration rate into the soil subsurface. This study assesses selected soil hydraulic properties of soil around septic tank systems. Twelve soil samples were collected from four different locations within Ido Local Government Area, Oyo State, Nigeria. The analyzed parameters were done based on standard procedures. The measured values of soil physico-chemical properties were used to predict Ksat using multiple linear regression analysis. The soil water content, porosity, Organic Carbon, Soil pH, bulk density, soil resistivity and saturated hydraulic conductivity (Ksat) ranged from 20.6 to 26.2%, 34.3 to 47.2%, 0.11 to 0.37%, 5.8 to 6.2, 1.40 to 1.74 g/cm3, 4.55 to 5.80 O cm and 1.34 to 10.52 mm/hr respectively. The relationship obtained from regression analysis on data (R2 = 86.8) is a new model with empirical linear equation which allows a new relation to estimate Ksat from the selected parameters. Principal component analysis (PCA) identified 3 major factors accounting for 92.7% of the total variation in the soil hydraulic variables. The result of Cluster Analysis (CA) shows groups based on correlation between hydraulic parameters and topographic settings.
Keywords
Hydraulic conductivity
Soil water content
Bulk density
Infiltration
Septic tank
PCA

1 Introduction
Soils are the major sink for both household and industrial wastes released into the environment. Therefore soils may become enriched in various wastes and atmospheric deposition (Ma et al., 2016). An important soil property to study the behaviour of soil water flow is the soil permeability to water. Hydraulic conductivity determination is one of the most important parameters for flow and transport related mechanism in soil (Brouwer and Bugeja, 1979; Jadczyszyn and Niedzwiecki, 2005; Olorunfemi and Fasinmirin, 2011). The knowledge of soil hydraulic conductivity have many valuable applications in ecological monitoring, waste-water infiltration, irrigation, rate of evaporation, water uptake by root, drainage and construction of water storage facilities (Kutilek and Nielsen, 1994; Sarki et al., 2014; Niec and Spychala, 2014; Welsh and Allen, 2014).
The hydraulic conductivity indicates the rate at which water can flow through a material. It determines the potential for the transport of leachate bearing contaminants/wastewater effluents to move through the soil into underlying strata and eventually into nearby groundwater (Kogbara et al., 2014). Hydraulic conductivity depends on soil physical characteristics such as porosity, soil type, bulk density, water content, intrinsic permeability, organic carbon, clay mineralogy, particle size distribution, soil structures and soil texture (Sarki et al., 2014; Olorunfemi and Fasinmirin, 2011; Vereechen et al., 1990; Bouma, 1981; Delgado-Rodriguez et al., 2011). The variability of saturated hydraulic conductivity may be due to occurrence of macropores and soil texture (Hillel, 1982; Vepraskas et al., 1991). The study of soil hydraulic conductivity is important when designing and installing a septic tank system. Septic tank is a means of disposal of household domestic wastes in form of black waste (toilet wastes) and human excrements from the comfort of living area. In waste water infiltration, the amount of water passing through depends greatly on the soil hydraulic conductivity. Central to performance of septic system is the ease of soil permeability. In order to treat waste water effluent properly, soil in the absorption field must be able to move water away from the trenches fast enough to prevent water from rising to the surface. The soil type, percolation rate, depth to impermeable layer and average water table depth are factors needed for consideration when determining the suitability of a particular site for a septic system (Collick et al., 2006). Several published work on determination of soil permeability and its associated physical properties have been well documented (Sarki et al., 2014; Niec and Spychala, 2014; Olorunfemi and Fasinmirin, 2011; Mbagwu, 1983; Salako and Adepelumi, 2016; Shevnin et al., 2006; Dec et al., 2008; Tatiana et al., 2015) while scientists have also analyzed soil properties and associated geochemical components based on Principal Component Analysis (PCA) (Ma et al., 2016; Adhikari et al., 2011; Gergen and Harmanescu, 2012; Satyanarayanan et al., 2016).
Several Scientists have also worked on prediction of soil hydraulic conductivity using both physico-chemical and morphological properties (Wösten et al., 2001; Lilly et al., 2008; Pachepsky et al., 2008; Karahan and Ersahin, 2016). The knowledge of saturated hydraulic conductivity (Ksat) can be used to assess the infiltration of wastewater from the trenches into the soil and also to determine the direction of transfer of water from the drainfield area. Thus, there is need to take hydraulic conductivity of soil around septic tank system into consideration among other factors such as hydraulic loading rate, clogging of the infiltrative surface, relationship between soil morphological properties to soil water movement, etc (EPA, 2000). In this research work, an estimation of hydraulic conductivity of soil samples within the vicinity of septic tank systems was studied. The objectives were to determine the saturated hydraulic conductivity in relation to waste water infiltration rate to the soil subsurface, develop a new model equation to estimate Ksat from analyzed soil parameters in the laboratory and to apply multivariate statistical techniques to study interrelationship among soil hydraulic parameters.
2 Material and methods
2.1 Description of the study area
The study area lies within the latitudes 7.20oN–7.23° N of the equator and longitude 3.49oE–3.52oE of the Greenwich meridian. Ido Local Government Area is within Ibadan metropolis, Nigeria. Ibadan has tropical wet and dry seasons. The wet season starts from April-October with an average temperature of 26.5 °C and relative humidity of 81% (Olorunfemi and Fasinmirin, 2011) while dry season runs from November-March. Ibadan is within the humid tropics with a mean rainfall of 1237 mm (Akintola, 1986). Ibadan falls under Guinea zone with bimodal rainfall patterns (Omotosho and Abiodun, 2007; Ogolo and Adeyemi, 2009; Oguntunde et al., 2012; and Ogungbenro and Morakinyo, 2014). The climate in Ibadan is classified as Aw based on Kȯȯpen-Geiger system (Essenwanger, 2003). This implies a tropical region with dry winter season and a wet summer season. The prevalent wind in Ibadan during wet season is the moist maritime southwest monsoon that blows inland from Atlantic Ocean. The dry season in Ibadan city is controlled by tropical continental air mass from Sahara desert (Oyenuga et al., 2016; and Egbinola and Amobichukwu, 2013). This period is characterized with low relative humidity and high rate of evaporation (Ogolo and Adeyemi, 2009). In Ibadan, the months of January and September are the months of lowest and highest relative humidity (Adeyemi and Aro, 2004; and Audu et al., 2015). The sampling locations are Ajanla-Oluyole, Elebu-Oluyole, Aba-Alamu, Apata/Dogo and Institute of Agricultural Research & Training (IAR&T) premises (Fig. 1) within the metropolis. The geographical data of the sampling locations were presented in Table 1. The study area falls within the Basement Complex Terrain of southwestern Nigeria. The basement complex rock consists of crystalline igneous and metamorphic rocks which form a part of the African crystalline shield with rocks belonging to the youngest of the three major provinces of the west African craton (Adetoyinbo et al., 2010). The dominant rock types are quartzites of the meta-sedimentary series and banded gneisses, augen gneisses and migmatites, which constitute the gneiss-miginatite complex. Other minor rock types include pegmatites, quartz, aplites, dolerite dykes, amphibolites and xenoliths (Okunlola et al., 2009). Banded gneiss constitutes over 75% of the rocks in and around Ibadan while the augen gneiss and quartzites share the remaining in equal percentages (Okunlola et al., 2009). The dominant rock type in the study area is migmatite gneiss (as shown in Fig. 1). *USDA = United State Department of Agriculture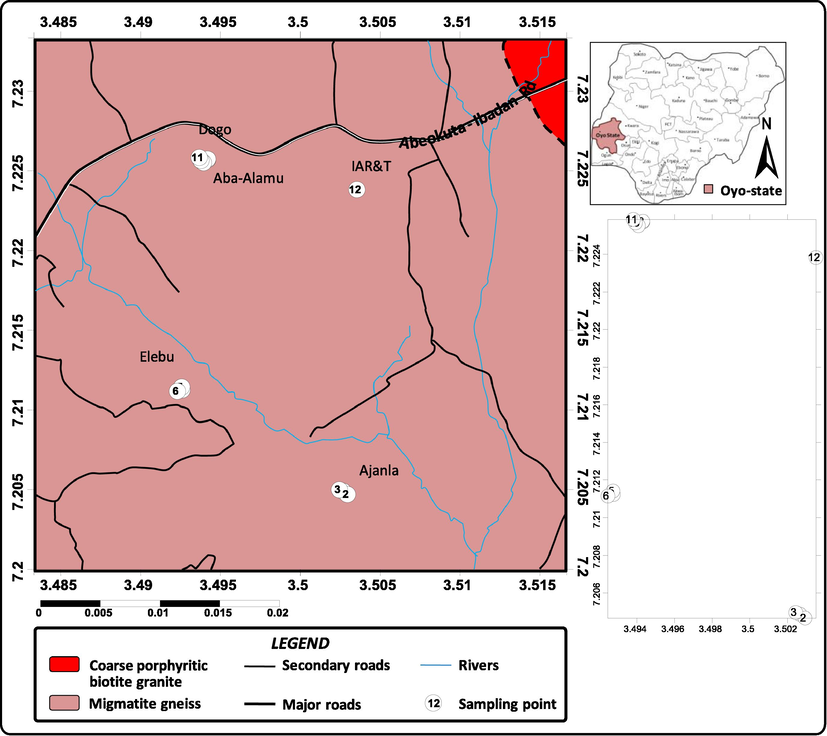
Geological map showing the rock type that underlies the sampled area and field layout of the sampling points.
Location
Sample code
Coordinates
Elevation (m)
Position
Local classification
USDA classification
Ajanla
S1
7° 2048.7N
3° 5026.6E253
Middle slope
Egbeda
Aquic kanha pludalf
S2
7° 2046.6N
3° 5029.4E190
Lower slope
Apomu
Dystric Eutru dept
S3
7° 2049.6N
3° 5024.4E175
Upper slope
Iwo
Typic Kandiu staff
Elebu
S4
7° 2112.3N
3° 4927.4E173
Upper slope
Ibadan
Typic Kanhaplustalf
S5
7° 2114.5N
3° 4927.4E190
Upper slope
Ibadan
Typic Kanhaplustalf
S6
7° 2111.5N
3° 4924.4E189
Upper slope
Iwo
Typic Kandiu stalf
Aba-Alamu
S7
7° 2257.1N
3° 4931.8E175
Upper slope
Iwo
Typic Kandiu Stalf
S8
7° 2257.5N
3° 4931.2E197
Middle slope
Egbeda
Aquic Kanhaplu dalf
Dogo
S9
7° 2256.2N
3° 4939.8E177
Middle slope
Egbeda
Aquic Kanhaplu dalf
S10
7° 2256.6N
3° 4939.2E193
Upper slope
Ibadan
Typic Kanhaplus stalf
S11
7° 2258.5N
3° 4938.1E188
Middle slope
Egbeda
Aquic Kanhaplu staff
IAR&T
S12
7° 2258.3N
3° 5035.2E152
Middle slope
Iwo
Typic Kandiu stalf
2.2 Soil sampling and laboratory analysis
Twelve composite soil samples were randomly collected around septic systems at a depth of 0–30 cm with the aid of soil auger and core samplers at four different locations within Ido Local Government area. The locations are Ajanla (S1, S2, S3), Elebu ((S4, S5, S6); Aba-Alamu (S7, S8); Dogo (S9, S10, S11) and IAR&T ((S12). Soil samples were collected at a distance of about 0.5 m–1.0 m from the septic tanks. Soil samples were packed in a well labeled polythene bags and conveyed to soil physics laboratory of the IAR & T for samples preparation and parameters of interest were: soil pH, organic matter, organic carbon, bulk density, porosity, particle size analysis, resistivity, water content and saturated hydraulic conductivity (Ksat)
Particle size distribution was determined by modified Boyoucos hydrometer method as described by Gee and Or, (2002) while textural classification was done using the United State Department of Agriculture (USDA) classification system. The determination of bulk density was carried out by gravimetric soil core method as described by Grossman and Reinsch (2002) and the particle density was assumed to be 2.65 g/cm3. The porosity in % was calculated from the bulk density using the equation as described by Hillel, (2004) where
where = bulk density in g/cm3 and .
Soil moisture content was determined using the method of weight loss in accordance with the ASTM D4959-07 standards (ASTM D4959–07, 2007). The soil pH in water of each soil sample was measured via a digital pH meter in accordance with ASTM G51–95 (2012) standards. The soil resistivity was measured using the M.C. miller soil boxes according to the ASTM G57-05 standards (ASTM G57–05, 2005). The dimension of each box and pin spacing was chosen so that soil resistivity is expressed in Ohm cm according to
The organic carbon (OC) was determined using the loss on ignition method (Cambardella et al., 2001).
The soil saturated hydraulic conductivity (Ksat) was measured using the constant head permeameter method based on Reynolds and Elrick (2002).
2.2.1 Statistical analysis
The relationship between the dependent variable (Ksat) and the associated parameters (predictors) was evaluated using the multiple Regression Analysis. The significance of the observed correlation coefficient results was analyzed using the factor analysis and Pearson’s correlation method to explain relationship between sample parameters and/or variables. Principal Component Analysis (PCA) is one of the multivariate statistical techniques based on data reduction of an original data set while retaining the inherent interdependencies present in the original data set (Satyanarayanan et al., 2016; Liu et al., 2003; and Jianqin et al., 2010). The rotation of the PC was executed by the varimax method with Kaiser normalization. Cluster analysis (CA) is a method of sectioning a group of physical/Sample parameters into classes so that similar properties are in the same class. Samples/variables within a particular cluster are similar to each other but dissimilar from other clusters (Zhang et al., 2014). CA was performed with the aid of Ward’s linkage method and squared Euclidean distance as a measure of similarity between samples and/or parameters (Zhang et al., 2014).
3 Results and discussion
3.1 Physio-chemical analyses
The result of analyzed parameters on collected soil samples within the distance of 0.5–1.0 m to the septic tank systems is presented in Table 2. Four soil samples have sandy loam (SL) texture while the remains eight soil samples belong to sandy clay loam (SCL). This is in agreement with the earlier work by (Olorunfemi and Fasinmirin, 2011) where the predominant soil texture within Ibadan metropolis is SCL. However, the predominant soil type of analyzed soil samples according to USDA soil classification system is Typic Kandiustalf which account for 33.3% of analyzed samples. The bulk density values ranged from 1.40 to 1.74 g/cm3. Samples 5 and 10 with sandy loam textural class has the highest BD value (1.74 g/cm3) This may be due to the same value of least porosity (34.34%). Note: SL = Sandy Loam, WC = Water Content, OC = Organic Carbon, BD = Bulk Density. SCL = Sandy Clay Loam.
Location
Sampling code
Textural class
BD (g/cm3)
Ksatmm/hr
Porosity (%)
Resistivity (Ohm cm)
WC
OC
pH
Ajanla
S1
SL
1.42
10.11
46.42
5.69
21.02
0.15
6.10
S2
SCL
1.40
6.15
47.17
4.82
24.81
0.37
6.15
S3
SCL
1.58
4.12
40.38
5.10
23.43
0.23
6.05
Elebu
S4
SCL
1.68
6.56
36.60
5.33
22.42
0.21
5.95
S5
SL
1.74
7.32
34.34
5.63
21.24
0.15
6.10
S6
SL
1.41
10.52
46.79
5.10
23.41
0.11
6.10
Aba-Alamu
S7
SCL
1.56
3.23
41.13
5.80
20.62
0.23
5.80
S8
SCL
1.63
2.92
38.49
4.58
26.11
0.22
5.90
Dogo
S9
SCL
1.72
1.34
35.09
4.55
26.24
0.28
5.80
S10
SL
1.74
7.34
34.34
5.66
21.12
0.13
5.95
S11
SCL
1.52
4.52
42.64
5.34
22.40
0.31
5.90
IAR&T
S12
SCL
1.62
3.31
38.87
4.76
25.12
0.33
5.85
Sample1 = 1.42 g/cm3, Ksat = 10.11 mm/hr, Porosity = 46.4% and WC = 21.02%) and sample 6 (BD = 1.41 g/cm3, Ksat = 10.52 mm/hr, Porosity = 46.8% and WC = 23.41%) have favourable physical condition. e porosity values ranged from 34.3% (with BD = 1.74 g/cm3) and to 47.2% (with BD = 1.40 g/cm3). This result agrees with the range of porosity obtained for tropical sandy soils by Lamotte et al. (1979), Osunbitan et al. (2005) and Lesturgez (2005). The soil water content ranged from 20.6% to 26.2% with a mean water content of 23.2% for all soil samples. The soil resistivity (Ohm-cm) values range from 4.55 to 5.80 Ohm-cm with a mean value of 5.19 Ohm-cm. The lowest soil resistivity was observed in sample 9 while sample 7 has the highest value of soil resistivity. The soil organic carbon (OC) ranged from 0.11 to 0.37%. The soil pH ranged from 5.8 to 6.2 with a mean pH value of 5.9. The saturated hydraulic conductivity values ranged from 1.34 to 10.52 mm/hr. It should be noted that samples 1 and 6 with highest values have the least values of BD out of analyzed SL soil samples. The variability of may be due to different amount of macropores and existence of pore continuity in the soil samples (Iversen et al., 2001; Cameira et al., 2003; and Buczko et al., 2006).
3.2 Interpretation of the regression analysis result
Table 3 shows the result of the Regression analysis to formulate a model (linear equation) for the relationship between the dependent variable (Ksat) and the predictors: bulk density, resistivity, water content (WC), OC and pH. The result reveals that relationship exists at 10% level between Ksat and predictors OC and pH. This is an indication that OC and pH contribute at 10% level to the variation in the Ksat of the soil. The R-square value of 86.8% indicates that the predictors in the model account for 86.8% of the total variation in the Ksat of the soil while F-value 7.878 which is significant at 5% level (P < 0.05) implies the feasibility of the model. The equation modeling the existing relationship between Ksat and the predictors as extracted from the regression table is
where BD = Bulk density, RES = resistivity, WC = water content and OC = organic carbon. ns = Not significant at 10% (p < 0.1) level.
Variables
Coefficients
t-Value
(Constant)
82.087
0.435 ns
Bulk density
−5.932
−1.428 ns
Resistivity
−10.979
−0.649 ns
water content
−2.692
−0.718 ns
Organic carbon
−16.120
−2.382*
pH
9.378
1.969*
R2
86.8%
F-value
7.878**
The result of regression analysis showed that the lower BD, RES, WC, OC and higher values of pH increases soil hydraulic conductivity. The result in equation showed that only soil pH has positive relationship with the dependent variable ( However, hydraulic conductivity also depends on other properties such as pore size distribution, pore structure and tortuosity (Messing and Jarvis, 1995).
3.3 Result of correlation coefficient, PCA and CA
The degree of a linear association between any two of the analyzed parameters measured by Pearson’s correlation coefficients is presented in Table 4. Factor Analysis and PCA were performed on the normalized data set of 8 physical parameters of soil samples collected within the study area. The rotation of the principal components was converged in five (5) iterations. Table 5 shows the factor loading and eigen values of extracted components while Figs. 2a and 2b show the dendrogram of analyzed soil parameters and soil sampling points respectively. From Table 4, there are very strong positive associations between Ksat and pH (0.767**). Correlation analysis showed a negative relationship between Ksat and OC (−0.647*). Hu et al. (2008) established similar relationship between Ksat and OC content. There is expected negative correlation between porosity and BD at 0.01 level. Soil BD showed negative but not significant relationship with OC (−0.146) and pH (−0.485). The correlation between soil BD and pH is supported by a similar observation by Chaudhari et al. (2013). A very strong negative correlation also exist between water content (WC) and resistivity (−0.998**). The negative correlation between WC and Resistivity is expected because a decrease in soil water content leads to increase in resistivity.
Correlations
Bulk density
Saturated hydraulic conductivity
Porosity
Resistivity)
water content
Organic carbon
Organic Matter
pH
Bulk density
1
Saturated hydraulic conductivity
−0.429
1
Porosity
−1.000**
0.429
1
Resistivity
0.004
0.507
−0.004
1
water content
0.017
−0.533
−0.017
−0.998**
1
Organic carbon
−0.146
−0.647*
0.146
−0.544
0.544
1
pH
−0.485
0.767**
0.485
0.184
−0.216
−0.298
−0.298
1
Parameters
Component
1
2
Bulk density
−0.499
−0.818
Saturated hydraulic conductivity
0.922
0.054
Porosity
0.499
0.818
Resistivity
0.721
−0.551
Water content
−0.741
0.530
Organic carbon
−0.628
0.521
pH
0.718
0.350
Initial eigenvalue
3.327
2.320
% of variance
47.531
33.149
Cumulative %
47.531
80.680
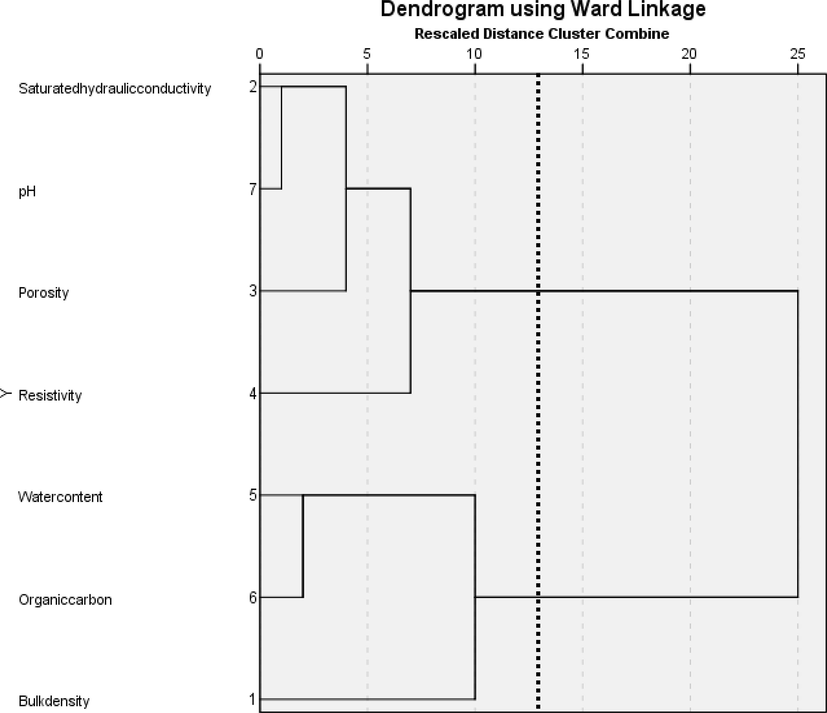
Dendrogram of Analyzed parameters of Soil samples.
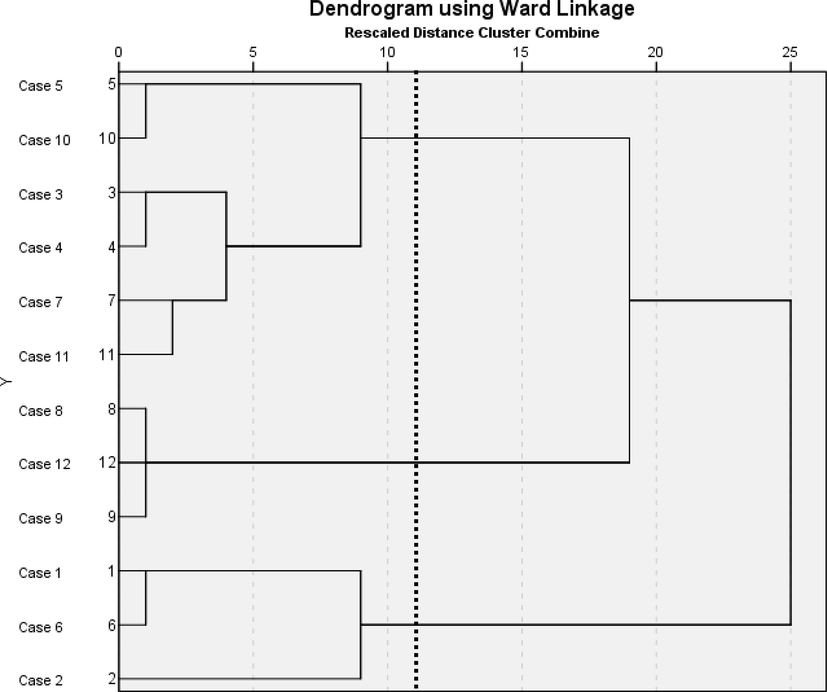
Dendrogram of soil sampling locations.
Two principal components were extracted and accounted for 80.7% of the total variation in the original data set. PCI (factor1) accounts for 47.5% of the total variance and characterized by strong positive loading on Ksat, moderate positive loadings on resistivity and pH, with moderate negative loadings on OC and WC. The positive loadings on Ksat, resistivity and pH agrees with correlation coefficient analysis result. Negative loading of resistivity with WC means a decrease in resistivity as WC rises. Similarly, negative loading of BD with porosity means a decrease in BD leads to rise in porosity value. PC 2 accounted for 33.1% of the total variance, showing strong positive loading on porosity and strong negative loading on BD. This agrees with the result of correlation coefficient analysis.
Two clusters were identified on the dendrogram of analyzed soil’s properties (Fig. 2a). Cluster 1 formed by Ksat, pH, porosity and resistivity are completely in accordance with positive loadings on PC1 and correlation coefficient. Cluster 2 comprises WC, OC and BD and correlates very well with negative loadings on PC1. The dendrogram schedule based on soil sampling sites depicts three (3) clusters (Fig. 2b). Cluster 1 comprises S3, S4, S5, S7, S10 and S11, cluster 2 consist of S8, S9 and S12 while cluster 3 comprises S1, S2 and S6. Cluster 1 comprises of samples belonging to the resistivity range of 5.10–5.66 Ohm cm. Cluster 2 contains samples with similar soil texture (SCL) and resistivity range (4.55–4.76 Ohm cm). Cluster 3 comprises of soil samples with similar BD range (1.40–1.42 g/cm3) and porosity range (46.4–47.1%).
These clusters of sampling points were grouped based on soil textural class, bulk density, resistivity and porosity values.
The component loadings of PC 1 and PC 2 are plotted in Fig. 3. There is correlation between the two components defined by FA and the generated plot. The figure showed the variation from positive to negative loading of each principal component. Resistivity is grouped in the positive side of PC1. Porosity, pH, saturated hydraulic conductivity, OC and WC are grouped in the positive side of PC2 while BD is grouped in the negative side of the two PCs.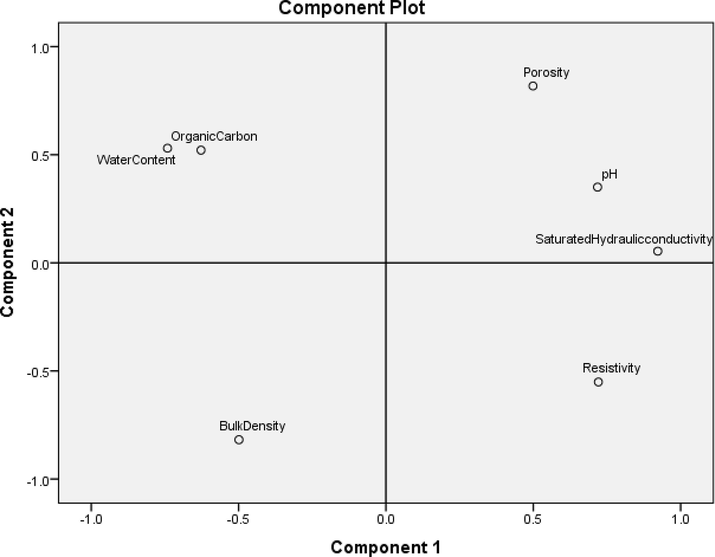
Component loadings for soil parameters data.
4 Conclusions
This study investigated the variability of hydraulic conductivity and the associated physical properties of soil samples within the vicinity of septic tank systems in four different locations in southwestern Nigeria. There is negative correlation between porosity and BD, soil water content and resistivity at 0.01 levels. The modeled linear equation showed that Ksat has inverse relationship with BD, RES, WC, OC and direct correlation with soil pH. PCA on analyzed soil samples identified two principal factors accounting for 80.7% of the total variation in the original data set while cluster analysis sectioning a group of samples/physical parameters based on similar soil physical characteristics and soil textural class.
References
- An assessment of Quarry Blasting vibration impacts in Ibadan and Abeokuta, Nigeria. Eur. J. Sci. Res.. 2010;4:228-252.
- [Google Scholar]
- Variation in surface water vapour density over four Nigerian stations. Niger. J. Pure Appl. Phys.. 2004;3(1):37-43.
- [Google Scholar]
- Assessment of the soil physical and chemical properties of desert soils irrigated with treated waste water using principal component analysis. Soil Sci.. 2011;176(7):1-11.
- [CrossRef] [Google Scholar]
- Rainfall distribution in Nigeria, 1892–1983. Ibadan: Impact publishers; 1986. p. :380.
- Standard Test method for determination of water (moisture) content of soil by direct heating. In: Annual Book of ASTM standards. American society for Testing materials; 2007.
- [Google Scholar]
- Standard Test method for measurement of pH of soil for use in Corrosion Testing. In: Annual Book of ASTM standards. American society for Testing materials, New York; 2012.
- [Google Scholar]
- Standard Test method for measurement of soil resistivity using two-electrode soil box method. In: Annual Book of ASTM standards. American society for Testing materials; 2005.
- [Google Scholar]
- Evaluation of seasonal and annual variations of evapotranspiration with climatic parameters in Ibadan, Nigeria. J. Earth Sci. Geotech. Eng.. 2015;15(2):69-79.
- [Google Scholar]
- Comment on micro-meso, and macro porosity of soil. Soil Sci. Soc. Am. J. 1981;45:1244-1245.
- [Google Scholar]
- Land Capability for Septic Tank Effluent Absorption Trenches. Armadale, Victoria: State Rivers and Water Supply Commission; 1979. Report A.W.R.C Project 79/118
- Tillage effects on hydraulic properties and macro porosity in silty and sandy soils. Soil. Sci. Soc. Am. J.. 2006;70:1998-2002.
- [Google Scholar]
- Estimation of particulate and total organic matter by weight loss-on-ignition. In: Lal R., Kimbe J.M., Follet R.F., Steward B.A., eds. Assessment Methods for Soil Carbon. Boca Raton, FL: Lewis Publishers; 2001. p. :349-359.
- [Google Scholar]
- Soil macropore dynamic affected by tillage and irrigation for a silty loam alluvial soil in southern Portugal. Soil Tillage Res.. 2003;70:131-140.
- [Google Scholar]
- Soil bulk density as related to soil texture, organic matter content and available total nutrients of Coimbatore soil. Int. J. Sci. Res. Publ.. 2013;3(2):1-8.
- [Google Scholar]
- Hydrological evaluation of septic disposal field design in slopping Terrain. J. Environ. Eng.. 2006;132(10)
- [CrossRef] [Google Scholar]
- Effect of bulk density on hydraulic properties of homogenized and structured soils. J. Soil. Sci. Plant Nutr.. 2008;8(1):1-13.
- [Google Scholar]
- Determination of hydraulic conductivity and fines content in soils near an unlined irrigation canal in Guasave, Sinaloa, Mexico. J. Soil Sci. Plant Nutr.. 2011;11(3):13-31.
- [Google Scholar]
- Climate variation assessment based on rainfall and temperature in Ibadan, SouthWestern, Nigeria. J. Environ. Earth Sci.. 2013;3(11):32-45.
- [Google Scholar]
- EPA, 2000. Decentralized Systems Technology Fact Sheet. <http://www.epa.gov/owmitnet/mtbfact.htm>.
- Classification of climates. Amsterdam: Elsevier; 2003.
- Particle-size analysis. In: Dane J.H., Topp G.C., eds. Methods of Soil Analysis. Part 4, Physical Methods. Madison, WI: SSSA, Inc.; 2002. p. :255-294.
- [Google Scholar]
- Application of PCA in the pollution assessment with heavy metals of vegetable food chain in the old mining areas. Chem. Cent. J.. 2012;6:156.
- [Google Scholar]
- Bulk density and linear extensibility: Core method. In: Dane J.H., Topp G.C., eds. Methods of Soil Analyss, Part 4, Physical Methods. Madison, WI: SSSA, Inc.; 2002. p. :208-228.
- [Google Scholar]
- Introduction to Soil Physics. Orlando, FL: Academic Press; 1982.
- Introduction to Experimental Soil Physics. London, UK: Elsevier Science; 2004.
- Spatial variability of soil hydraulic properties on a steep slope in the loess plateau of China. Sci. Agric. (Piracicaba, Braz). 2008;65(3):268-276.
- [Google Scholar]
- Air and water permeability in differently textured soils at two measurement scales. Soil Sci.. 2001;166:643-659.
- [Google Scholar]
- Relation of saturated hydraulic conductivity to soil losses. Pol. J. Environ. Stud.. 2005;17(4):431-435.
- [Google Scholar]
- Water quality evaluation model based on PCA and information entropy. Application in Jinshui River. J. Resour. Ecol.. 2010;1(3):249-252.
- [Google Scholar]
- Predicting saturated hydraulic conductivity using soil morphological properties. Eurasian J. Soil Sci.. 2016;5(1):30-38.
- [Google Scholar]
- Comparisons of operating envelopes for contaminated soil stabilized/solidified with different cementitious binders. Environ. Sci. Pollut. Res.. 2014;21(5):3395-3414.
- [Google Scholar]
- Kutilek, M., Nielsen, D.R., 1994. Soil hydrology. Catena Verlagi 38162 Cremlingen-Destedt, Germany. ISBN3-923381-26-3.
- A Hard sandy-loam soil from semi arid Northern Cameron. I. fabric of the groundmass. Eur. J. Soil Sci.. 1979;48:213-225.
- [Google Scholar]
- Densification des sols sableux Sous culture mecanisee. Cas du Nord-Est Thailandais. These universite. Henri Poincare Nancy. 2005;1:160p.
- [Google Scholar]
- Probabilistic approach to the identification of input variables to estimate hydraulic conductivity. Soil Sci. Soc. Am. J.. 2008;72:16-24.
- [Google Scholar]
- Application of factor analysis in the assessment of groundwater quality in a black foot disease area in Taiwan. Sci. Total Environ.. 2003;313(1–3):77-89.
- [Google Scholar]
- Source Identification and risk assessment of heavy metal contaminations in urban soils of Changsha, a mine impacted city in southern China. Environ. Sci. Pollut. Res.. 2016;23:17058-17066.
- [CrossRef] [Google Scholar]
- Analysis of physical properties controlled steady-state infiltration rates on tropical savannah soils. International centre for Theoretical physics, Italy. Int. Rep. 1983 IC/93/289
- [Google Scholar]
- A comparison of near-saturated hydraulic properties measured in small cores and large monoliths in a clay soil. Soil Technol.. 1995;7:291-302.
- [Google Scholar]
- Hydraulic conductivity estimation test impact on long term acceptance rate and soil absorption system design. Water. 2014;6:2808-2820.
- [Google Scholar]
- Variations and Trends of some meteorological parameters at Ibadan, Nigeria. Pac. J. Sci. Technol.. 2009;10(2):980-987.
- [Google Scholar]
- Rainfall distribution and change detection across climatic zones in Nigeria. Weather Clim. Extremes. 2014;5(6):1-6.
- [Google Scholar]
- Trends and Variability in pan evaporation and other climatic variables at Ibadan, Nigeria, 1973–2008. Metorol. Appl.. 2012;19:464-472.
- [Google Scholar]
- Composition and Petrogenetic features of Schitose rocks of Ibadan area, Southwestern Nigeria. Earth Sci. Res. J.. 2009;13(2):29-43.
- [Google Scholar]
- Olorunfemi, I.E., Fasinmirin, J.T., 2011. Hydraulic conductivity and infiltration of soils of Tropical Rain forest climate of Nigeria. In: Proceedings of the Environmental Management Conference, Federal University of Agriculture, Abeokuta, Nigeria. pp 397–413.
- A numerical study of moisture build-up and rainfall over West Africa. Meteorol. Appl.. 2007;14(3):209-225.
- [Google Scholar]
- Tillage effects on bulk density, Hydraulic conductivity and strength of a loamy sand soil in southwestern Nigeria. Soil Tillage Res.. 2005;82:57-64.
- [Google Scholar]
- Statistical modeling of Quarterly record of rainfall distribution in South West, Nigeria. Sci. J. Appl. Math. Stat.. 2016;4(2):52-58.
- [Google Scholar]
- Promise of hydropedology. CAB Rev.: Perspect. Agric. Vet. Sci. Nutr. Nat. Resour.. 2008;3(040):1-19.
- [Google Scholar]
- Constant head soil core (tank) method. In: Dane J.H., Topp G.C., eds. Methods of Soil Analysis, Part 4, Physical Methods, SSS A Book Series, 5. Madison, Wisconsin: Soil Science Society of America; 2002. p. :804-808.
- [Google Scholar]
- Evaluation of hydraulic conductivity of subsoil using electrical resistivity and ground penetrating radar data: example from southwestern Nigeria. Int. J. of Geo-Eng.. 2016;7(5):1-26.
- [CrossRef] [Google Scholar]
- Determination of saturated hydraulic conductivity of different soil texture materials. IOSR J. Agric. Vet. Sci. (IOSR-JAVS). 2014;7(12):56-62.
- [Google Scholar]
- Factor analysis of rock, soil and water geochemical data from salem magnesite mines and surrounding area, Salem, Southern India. Appl. Water Sci. 2016
- [CrossRef] [Google Scholar]
- Estimation of hydraulic conductivity on clay content in soil determined from resistivty data. Geofis. Int.. 2006;45:195-207.
- [Google Scholar]
- Hydraulic characterization from porous aquifers of the Brazillian Federal District. Braz. J. Geol.. 2015;45(2):259-271.
- [CrossRef] [Google Scholar]
- Hydraulic conductivity of saporoliteious determined by channels and porous groundmass. Soil. Sci. Soc. Am. J.. 1991;55:932-938.
- [Google Scholar]
- Estimating unsaturated hydraulic conductivity from easily measured properties. Soil Sci.. 1990;149:1-5.
- [Google Scholar]
- Hydraulic conductivity characteristics in mountains and implications for conceptualizing bedrock groundwater flow. Hydrogeology. J. 2014
- [Google Scholar]
- Pedotransfer functions: bridging the gap between available basic soil data and missing soil hydraulic characteristics. J. Hydrol.. 2001;251:123-150.
- [Google Scholar]
- Assessment of Groundwater chemistry and status in a heavily used semi-arid region with multivariate statistical analysis. Water. 2014;6:2212-2232.
- [CrossRef] [Google Scholar]


