

Translate this page into:
PPARG expression patterns and correlations in obesity
⁎Corresponding author. melshikh@ksu.edu.sa (Mohamed S. Elshikh)
-
Received: ,
Accepted: ,
This article was originally published by Elsevier and was migrated to Scientific Scholar after the change of Publisher.
Peer review under responsibility of King Saud University.
Abstract
Background
Obesity is a result of excess fat storage in tissues and may lead to local insulin resistance and inflammation. Obesity is a multifactorial event and may include dysregulation of certain genes, such as peroxisome proliferator activated receptor gamma (PPARG). PPARG plays a key role in adipogenesis and adipocyte gene expression.
Aim
Our study aimed to determine the regulatory role of PPARG in obesity.
Methods
Serum samples from obese, non-obese(controls), diabetic obese and diabetic individuals were collected, and total RNA was extracted. RNA was reversed to cDNA and real time PCR technology was used to quantify differential PPARG gene expression in serum of obese patients and in diabetic obese patients (BMI > 30 kg/m2) versus non-obese and diabetic controls. Anthropometric parameters were recorded, and laboratory measurements were performed for each subject. Demographic and biochemical characteristics were studied for their correlation to PPARG mRNA in each group. The data were analyzed using an ANOVA analysis (p < 0.05).
Results
PPARG mRNA expression is most abundant in serum of obese patients both diabetic and non-diabetic. However, differential level of PPARG mRNA expression was seen in diabetic patients without obesity being only 40% of group subjects showed overexpressed PPARG in serum. A statistically significant differences were observed for mean TGs, TC, LDLc and HDLc levels among groups. There was a strong positive correlation between PPARG mRNA and the body mass index, waist circumference (WC) and waist–hip ratio (WHR) of obese patients.
Keywords
Obesity
PPARG
BMI
WC

1 Introduction
Obesity is a metabolic disease that results from high-caloric diet which causes excessive fat accumulation. Excess fat mass accumulation in adipose tissue is strongly associated with elevated inflammatory status and numerous metabolic abnormalities that increase overall morbidity risk (Jung and Choi, 2014). The metabolic abnormalities that often accompany obesity include hypertension, impaired glucose tolerance, insulin resistance leading to hyperinsulinemia, and dyslipidemia (Ormazabal et al., 2018).
Obesity has reached epidemic proportions with morbidity rate over 4 million people each year (McQuaid et al., 2011). Obesity increases risk of developing several chronic diseases including type 2 diabetes, fatty liver diseases and cancers (Lumeng and Saltiel, 2011). Due to the obesity epidemic, dire efforts were taken to face a decline in life expectancy in the 21st century (Hruby and Hu, 2015). A better understanding is needed for obesity mechanisms to ensure better prevention and treatment strategies (Chan and Woo, 2010). The majority of genes associated with obesity seem to regulate metabolic events (Choquet and Meyre, 2011).
The transcription factor, Peroxisome proliferator-activated receptor gamma (PPARG) is one of the most investigated genes associated with the pathogenesis of obesity as it is expressed predominantly in adipose tissue (Lefterova et al., 2014). PPARG is a major player regulating the expression of numerous genes involved in lipid metabolism, obesity-induced inflammation, metabolic syndrome, and atherosclerosis (Fig. 1) (Black et al., 2015). PPARG stimulates differentiation of resident adipose tissue preadipocytes to adipocytes and promotes the mobilization of bone marrow-derived circulating progenitor cells to white adipose tissue and their subsequent differentiation into adipocytes (Lauterbach and Wunderlich, 2017). PPARG also promotes the release of free fatty acids (FFA) from circulating lipoproteins and stimulates their uptake enhancing lipid storage. Activated PPARG induces hyperlipidemia, insulin resistance, hepatic steatosis, Lipid storage and stimulates de novo fatty acid synthesis (Fig. 1) (Sarhangi, et al., 2020).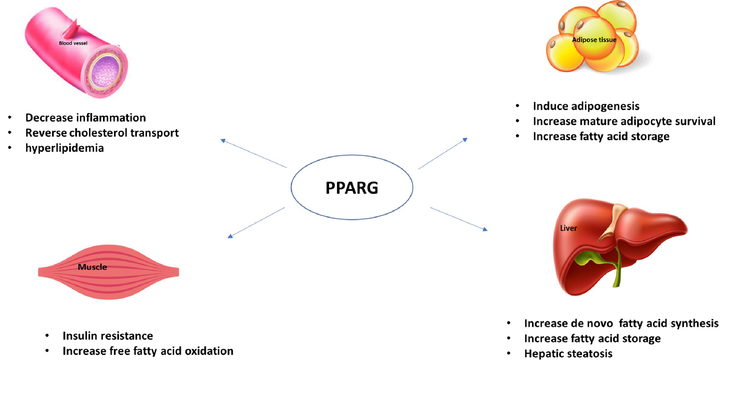
Schematic representation of the effect of PPARG on adipose tissue, liver, muscle and blood vessels.
A genetic link between PPARG and type 2 diabetes has been proved (Lefterova et al., 2014). PPARG exerts a counteracting effect against obesity-induced inflammation by controlling the inflammatory response either by downregulation of proinflammatory genes, or by affecting lipid metabolism. The ability to reduce inflammatory cell infiltration further underlines the central role of PPARG in obesity-induced inflammation (Lauterbach and Wunderlich, 2017).
In our study we used serum samples to avoid gene expression changes during handling and processing (Debey et al., 2004). Although, adipose tissue would be an ideal tissue to study gene expression changes in obese population, blood samples are accessible to obtain (Longo et al., 2019). Furthermore, gene expression profiling in serum has been shown to be useful for screening of diseases of non-blood tissue (He et al., 2019).
The aim of this study was to assess the expression pattern of PPARG gene in both obese and diabetic obese patients versus control and diabetic patients and to study the correlation between PPARG gene expression and both biochemical and demographic characteristics of the study populations.
2 Subjects and methods
2.1 Participants and study design
The participants were recruited from hospitals affiliated with Tanta University from April 2020 to May 2021. Our study included 100 subjects who were divided into four main groups: Group 1: 25 (15 women/10 men) normal control subjects had no family history of obesity or T2DM, exhibited normal BMI, and were free of any major chronic diseases. Group 2: 25 (18 women/7 men) obese subjects. Group 3: 25 diabetic non obese subjects (15 women/10 men). Group 4: 25 diabetic obese subjects (18 women/7 men).
2.2 Diagnostic criteria
Obesity was defined based on BMI. Subjects<25 kg/m2 were considered lean, and subjects with a BMI ≥ 30 kg/m2 were defined as obese. Table 2.1 shows the guideline for BMI classification (Gahagan et al., 2011). Diagnosis of diabetes (T2DM) based on Diabetic Care Association criteria at baseline for a fasting glucose was ≥ 126 mg/dl or a 2 h postprandial blood glucose ≥ 200 mg/dl and HbA1c > 6.5% (Addendum et al., 2021). All groups (group 2 group3 and group 4) were characterized according to the current criteria for diabetes and obesity diagnosis.
Classification
BMI (kg/m2)
Underweight
<18.5
Normal weight
18.5–22.9
Overweight
23–24.9
Obese I
25–29.9
Obese II
>30
2.3 Exclusion criteria
Exclusion criteria included underweight subject, pregnant women, persons with chronic heart disease, malignancies and infections. Patients with type 1 diabetes mellites and patients with chronic liver diseases and chronic renal diseases are all excluded from this study. Smokers were also excluded from our study. Patients with any clinically observable diabetic complications were excluded from the T2DM (group 3). The use of oral glucose or lipid-lowering agents, weight reduction therapies, or antihypertensive drugs constituted exclusion criteria.
2.4 Body measurements
Weight measurement was done after asking all population of study to remove their shoes using weighing scale. Height was measured on stand straight position from the top of their heads until the top of their toes using a stadiometer. Waist circumference (cm) was measured using a measuring tape, from mid-point of the costal margin to the iliac crest in the mid-axillary line. The hip measurement was taken by measuring their widest point of the greater trochanter. The waist to hip ratio was then being calculated by the waist measurement divided by the hip measurement. The BMI was computed by using the standard formula. Systolic and diastolic blood pressure were recorded from all subjects. Table 2.1 shows the guideline for BMI (Gahagan et al., 2011) and Table 2.2 show guidelines for waist to hip ratio (Odenigbo et al., 2011), based on these criteria, subjects were grouped as normal weight and obese subjects.
Men waist to hip ratio
Women waist to hip ratio
<0.95
<0.80
2.5 Sample collection and clinical parameters
Blood samples were collected in the morning after 8 h of fasting. All serum samples were frozen at −80 °C until laboratory testing. Triglyceride (TG), total cholesterol (TC), high density lipoprotein cholesterol (HDL-C), plasma glucose and creatinine were assessed enzymatically using commercial reagents whereas hemoglobin A1c (HbA1c) was measured by HPLC. LDL cholesterol was calculated Friedwald’s formula (Friedewald et al., 1972). The acute phase proteins, C-reactive protein (CRP), was measured by turbidimetry (Jain et al., 2011).
2.6 RNA preparation and analysis
To assess PPARG mRNA expression in our study, total RNA was extracted from serum using Trizol (Invitrogen) according to the manufacturer’s instructions. RNA was extracted from 500 µl serum. 750 µl of Trizol® reagent (Invitrogen, California, USA) were added to 500 µl serum mixed and incubated for 15 min and then 200 µl of chloroform were added and incubated 5 mins.
Samples were then centrifuged at 12,000 r.p.m. for 15 min at 4 °C and the upper phase was then added to 500 µl isopropanol, incubated for 30 min at 4 °C and centrifuged at 12,000 r.p.m 4 °C. Pellets were washed with 70% ethanol air-dried at room temperature for 30 mins. Total RNA (30 μg) was solubilized in 20 μl of diethyl pyrocarbonate (DEPC)-treated water and stored at −80 °C until additional analysis. RNA was quantified by Nanodrop spectrophotometer, and its quality and integrity were assessed after electrophoresis in nondenaturing 1% agarose gels by ethidium bromide staining.
2.7 Reverse transcription and real-time qPCR
Approximately 2 μg of total RNA were reverse transcribed using SuperScript III (Invitrogen, Carlsbad, CA, USA) and random hexamers in a final reaction volume of 20 μl according to the manufacturer's instructions. Control reactions without reverse transcriptase were performed in parallel. cDNA was obtained and stored until using as template for RT-PCR. cDNA was diluted 20× with double-distilled water before PCR amplification. The reaction mixture included 2 μl of the diluted cDNA, 1 μl of the specific forward and reverse primer and 10 μl SYBR Green I SuperMix-UDG in a final volume of 20 μl. PCR was performed in an GDS Rotor-Gene Q Thermocycler, and each gene-specific primer set was used at concentrations of 150 nM. The sequence for primers used for amplification was as follow:
PPARG, forward: 5′-CGTGGCCGCAGATTTGAA-3′ and reverse: 5′-CTTCCATTACGGAGAGATCCAC-3′. GAPDH, forward: 5′-TGGGTGTGAACCATGAGAAG-3′ and reverse 5′-GCTAAGCAGTTGGTGGTGC-3′. Relative quantification of gene expression was performed by the 2 − ΔΔCt method using the endogenous reference GAPDH for normalization purposes. Representative amplification, melting curves for certain PPARG gene indicatively presented in Fig. 2.1.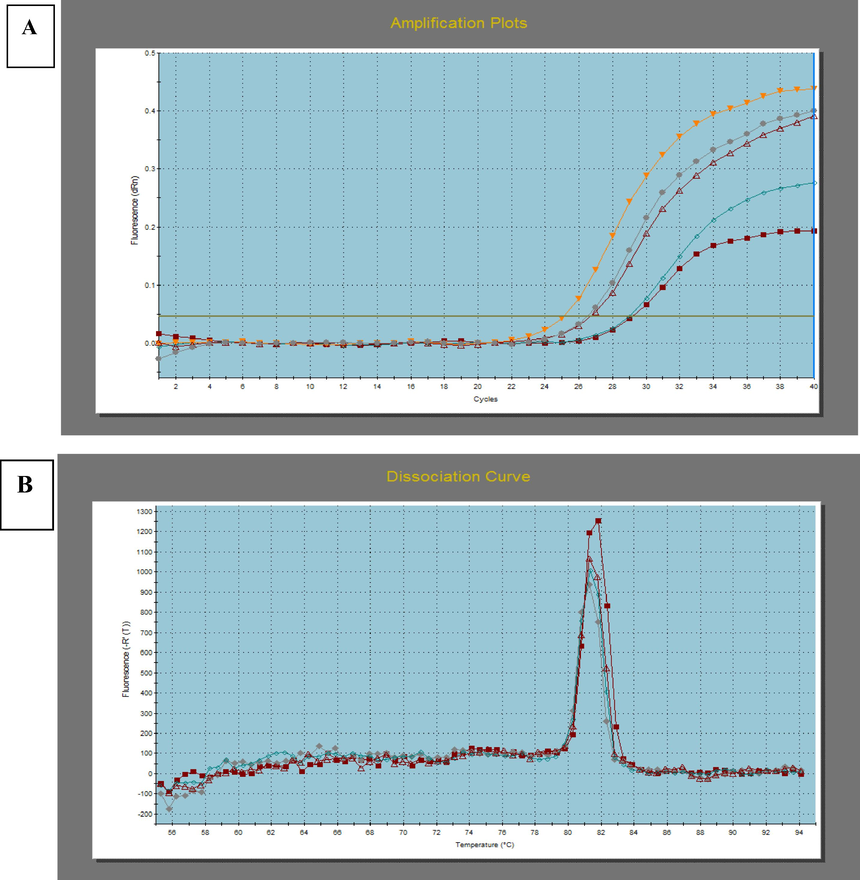
A) Amplification plot for PPARG on real-time PCR system. A higher CT value is indicative of lower mRNA levels. CT represents the threshold cycle at which fluorescence is first detected above background. B) Melting curves for pcr product of PPARG.
2.8 Statistical analysis
Statistical analyses were carried out using SPSS 11.0 software (SPSS Inc., Chicago). All analyses were considered significant with p-values <0.05. Biochemical parameters and real-time qPCR results are presented as mean ± SEM. Correlations between variables were tested by Spearman’s correlations.
3 Results
3.1 Demographic characteristics
In total, one hundred subjects were included in the study. Demographic characteristics are shown in Table 3.1. This study included a gender inequality distribution this is because in most populations the prevalence of obesity exceeds in women than in men. As shown in Table 3.1 control group (G1) include 15 females and 10 males, and obesity group (G2) include 18 females and 7 males. Diabetic group (G3) include 10 males and 15 females while obese diabetic group (G4) include18 females and 7 males. All subjects were on the mean age of fifties. Both G2 and G4 groups had a significantly higher BMI, waistline and hipline and WHR than control with no significant difference between them. As compared to control and G2, G3 and G4 groups had significantly higher SBP and DBP. Abbreviations: n: number; M: male; F: female; BMI: Body mass index; SBP: systolic blood pressure; DBP: diastolic blood pressure. Values represent …… means ± SEM for the number of patients indicated. *P < 0.05 was considered statistically significant when compared with control group.
Parameter
G1 (Control)
G2 (Obese)
G3(T2DM)
G4 (T2DM&Obese)
P-value
n
25
25
25
25
……
Gender M/F ratio
10/15
7/18
10/15
7/18
F > M
Age (years)
57 ± 2.56
58 ± 6.43
55 ± 5.23
59 ± 4.65
>0.05
Weight (kg)
70 ± 10.56
99 ± 5.87*
66 ± 3.21
107 ± 4.32*
<0.05
BMI (<25 kg/m2)
26 ± 2.13
43 ± 4.3*
25 ± 4.23
38.64 ± 3.45*
<0.05
Waistline (cm)
87.6 ± 4.23
120 ± 3.7a*
89.5 ± 3.21
117.6 ± 2.8*
<0.05
Hipline (cm)
104 ± 6.54
127.5 ± 5.45*
101.2 ± 4.65
128 ± 4.54*
<0.05
Waist-to-hip ratio
0.84 ± 0.1
0.94 ± 0.06*
0.88 ± 0.09
0.92 ± 0.08*
<0.05
SBP (mmHg)
118.3 ± 12.1
126.8 ± 13.0*
122 ± 6.23
125 ± 11.1*
<0.05
DBP (mmHg)
72 ± 3.56
86 ± 7.5*
78.7 ± 9.7
86.00 ± 12.00*
<0.05
3.2 Biochemical characteristics
Clinical characteristics of the studied groups are presented in Table 3.2. Glycemic control markers (FBG, PPBG, and HbA1c) showed no significant difference between obese (G2) and control (G1) group while both T2MD (G3) and diabetic obese (G4) still higher than control. Both obese (G2) and diabetic obese (G4) patients had significantly higher TGs, TC, LDLc as well as lower HDLc. A marked difference in the liver function test (S.GPT) was demonstrated between obese group (G2) and obese with diabetes (G4) with T2DM (G3) and control (G1) groups whereas SGOT showed no significant difference between study groups. Normal kidney function parameter (creatinine) was found in all groups of study. Significant (p < 0.05) decrease in Hb was found in both obese (G2) and diabetic obese (G4) patients when compared to those of control (G1). CRP showed marked increase in all groups when compared to control group with the highest level in obese group (G2). Abbreviations: FBS: Fasting blood glucose; PBG: postprandial blood glucose; HbA1C: glycosylated hemoglobin A1C. TG: Triglyceride; TC: Total Cholesterol; LDL-C: Low density lipoprotein cholesterol; HDL-C: High density lipoprotein cholesterol; S.Cr: serum creatinine; S.GPT: Glutamat- pyruvic transaminase; S.GOT: Glutamat- oxaloacetate transaminase; CRP: C-reactive protein; Hb: Hemoglobin. *P < 0.05 was considered statistically significant when compared with control group.
Parameter
G1 (Control)
G2 (Obese)
G3 (T2DM)
G4 (T2DM&Obese)
P-value
FBG
90 ± 9.7
106.0 ± 22.6
170 ± 27.2*
157 ± 22.34*
<0.05
PBG
110.16 ± 14.11
108.34 ± 10.98
215.05 ± 18.31*
245.55 ± 13.15*
<0.05
HbA1c
5.1 ± 1
5.9 ± 0.6
6.65 ± 0.65*
8.45 ± 0.76*
<0.05
TG
87.45 ± 16.7
155.0 ± 44.0*
98.75 ± 13.17
173 ± 34.32*
<0.05
TC
157 ± 10.54
209 ± 45.4*
180 ± 23.45
227.9 ± 66.8*
<0.05
LDLc
67.5 ± 16.21
122.1 ± 23.43*
88.54 ± 20.21
130 ± 11.21*
<0.05
HDLc
85.1 ± 10.3
45.1 ± 9.53*
76 ± 7.76
39.32 ± 6.32*
<0.05
S.Cr.
0.1 ± 0.88
0.11 ± 0.75
± 0.680.06
0.12 ± 0.78
>0.05
S.GPT
18 ± 3.34
52 ± 5.41*
26 ± 4.14
66 ± 7.41*
<0.05
S.GOT
22 ± 5.43
30 ± 10.3
20 ± 3.47
27 ± 6.11
>0.05
CRP
1.28 ± 0.47
29.5 ± 5.87
12.6 ± 2.65*
22 ± 3.87*
<0.05
Hb
13.52 ± 0.53
10.05 ± 0.31*
11.82 ± 0.84
10.08 ± 0.75*
<0.05
3.3 RTq-PCR relative expression
PPARG gene has a known function in obesity and glucose metabolism therefore we checked the expression of the gene of interest in healthy non obese, obese, diabetic non obese and diabetic obese subjects.
The fold change of PPARG gene expression was determined by real-time PCR. Real-time PCR showed differential expression between groups of interest with obesity group showing the highest expression level. Table 3.3 summarizes the differential pattern of PPARG expression in all groups of study. Obesity group (G2) showed a significant (P < 0.05, 5.11 ± 1.21) increase in PPARG relative expression in serum. However, PPARG gene expression in diabetic obese group (G4) also showed a significant PPARG gene expression (P < 0.05, 3. 8 ± 0.86) but is not as high as such increase in expression of obese patients (G2). On contrast, diabetic non obese subjects (G3) showed differential pattern of expression within the same group. 40% of group (10 subjects) showed overexpressed PPARG expression and 28% (7 subjects) showed down regulated PPARG gene expression while 32% of group subjects showed no change in PPARG gene expression. Data are expressed as mean ± SEM.
Group
PPARG gene expression
P
G 2 (Obese)
(5.11 ± 1.21) *
<0.05
G 3 (T2DM)
No Change
(1.1 ± 0.08) (32%)
>0.05
Overexpressed
(1.8 ± 0.56) * (40%)
<0.05
Downregulated
(-2.1 ± 0.32) * (28%)
<0.05
Group 4 (Obese & T2DM)
(3.8 ± 0.86) *
<0.05
3.4 Correlation between gene expression and demographic markers
A significant positive correlation was found between PPARG gene expression and BMI, WC and WHR in both obese group (G2) and diabetic obese (G4). Positive correlation was also found between PPARG gene expression and WC in the same both groups (G 2 & G4). It was also observed that there was a positive correlation between PPARG expression and hipline in obese patients (G2). There was no significant correlation observed among PPARG gene expression and demographic markers in the control (G1) and diabetic (G3) group. No correlation found with age and systolic and diastolic blood pressure in both groups (G2 and G4). Data are shown in Tables 3.4 and 3.5. Abbreviations: r: Spearman correlation coefficient; PPARG: peroxisome proliferator activated receptor gamma; BMI: Body mass index; WC: Waist circumference; WHR: Waist to hip ratio; TG: Triglyceride; TC: Total Cholesterol; LDL-C: Low density lipoprotein cholesterol; HDL-C: High density lipoprotein cholesterol; CRP: C-reactive protein; Hb: Hemoglobin. *: P < 0.05 statistically significant. Abbreviations: r: Spearman correlation coefficient; PPARG: peroxisome proliferator activated receptor gamma; BMI: Body mass index; WC: Waist circumference; WHR: Waist to hip ratio; FBS: Fasting blood glucose; TG: Triglyceride; TC: Total Cholesterol; LDL-C: Low density lipoprotein cholesterol; HDL-C: High density lipoprotein cholesterol; CRP: C-reactive protein; Hb: Hemoglobin.*: P < 0.05 statistically significant.
R
PPARG
BMI
Hipline (cm)
WC
(cm)WHR
TG
TC
LDLc
HDLc
GPT
CRP
Hb
PPARG
-----
0.65*
0.46*
0.51*
0.64*
0.74*
0.21
0.72*
0.32
0.51*
0.66*
−0.53*
BMI
0.65*
-----
0.43*
0.71*
0.54*
0.54*
0.43*
0.52*
−0.40*
0.47*
0.57*
0.31
Hipline (cm)
0.46*
0.43*
-----
0.50*
0.50*
0.41
0.26
0.31
0.05
0.11
0.41
0.26
WC (cm)
0.51*
0.71*
0.50*
-----
0.68*
0.65*
0.30
0.45
0.21
0.13
0.51*
0.16
WHR
0.64*
0.54*
0.50*
0.68*
-----
0.53*
0.32
0.21
0.30
0.11
0.44
0.30
TG
0.74*
0.54*
0.41
0.65*
0.53*
-----
0.41*
0.22
0.08
0.51*
0.55*
0.35
TC
0.21
0.43*
0.26
0.30
0.32
0.41*
----
0.65*
0.22
0.12
0.19
0.21
LDLc
0.72*
0.52*
0.31
0.45
0.21
0.22
0.65*
-----
0.32
0.41
0.48*
0.34
HDLc
0.32
−0.40*
0.05
0.21
0.30
0.08
0.22
0.32
-----
0.09
0.17
0.08
GPT
0.51*
0.47*
0.11
0.13
0.11
0.51*
0.12
0.41
0.09
-----
0.31
0.23
CRP
0.66*
0.57*
0.41
0.51*
0.44
0.55*
0.19
0.48*
0.17
0.31
-----
0.11
Hb
−0.53*
0.31
0.26
0.16
0.30
0.35
0.21
0.34
0.08
0.23
0.11
-----
R
PPARG
BMI
Hipline
(cm)WC
(cm)WHR
FBG
PBG
HbA1c
TG
TC
LDLc
HDLc
GPT
CRP
Hb
PPARG
-----
0.61*
0.31
0.51*
0.65*
0.55*
0.39
0.67*
0.74*
0.12
0.60*
0.11
0.81*
0.46*
0.19
BMI
0.61*
-----
0.41*
0.71*
0.48*
0.16
0.40*
0.21
0.55*
0.41
0.47*
0.38
0.51*
0.57*
0.31
Hipline (cm)
0.31
0.41*
-----
0.39*
0.54*
0.09
0.44*
0.29
0.51*
0.19
0.28
0.15
−0.21
0.27
0.26
WC (cm)
0.51*
0.71*
0.39*
-----
0.61*
0.35
0.29
0.18
0.58*
0.65*
0.40
−0.11
0.16
0.51*
0.16
WHR
0.65*
0.48*
0.54*
0.61*
-----
0.32
0.17
0.11
0.34
0.40
0.16
0.21
0.18
0.42
0.33
FBG
0.55*
0.16
0.09
0.35
0.32
-----
0.57*
0.69*
0.42
0.29
0.43
−0.35
−0.20
0.70*
−0.61*
PBG
0.39
0.40*
0.44*
0.29
0.17
0.57*
-----
0.43
0.54*
0.11
o.27
−0.13
0.18
0.21
0.11
HbA1c
0.67*
0.21
0.29
0.18
0.11
0.69*
0.43
-----
0.11
0.08
0.03
0.05
0.11
0.44
0.41
TG
0.74*
0.55*
0.51*
0.58*
0.34
0.42
0.54*
0.11
-----
0.41*
0.08
0.16
0.34
0.12
0.35
TC
0.12
0.41
0.19
0.65*
0.40
0.29
0.11
0.08
0.41*
----
0.56*
−0.05
0.12
0.07
0.21
LDLc
0.60*
0.47*
0.28
0.40*
0.16
0.43
0.27
0.03
0.08
0.56*
-----
−0.03
0.11
0.13
0.34
HDLc
0.11
0.38
0.15
−0.11
0.21
−0.35
−0.13
0.05
0.16
−0.05
−0.03
-----
0.21
−0.08
0.04
GPT
0.81*
0.51*
−0.21
0.16
0.18
−0.20
0.18
0.11
0.34
0.12
0.11
0.21
-----
0.17
0.23
CRP
0.46*
0.57*
0.27
0.51*
0.42
0.70*
0.21
0.44
0.12
0.07
0.13
−0.08
0.17
-----
−0.05
Hb
0.19
0.31
0.26
0.16
0.33
−0.61*
0.11
0.41
0.35
0.21
0.34
0.04
0.23
−0.05
-----
3.5 Correlation between PPARG expression and biochemical characteristics
There was a significant (P < 0.05) positive correlation between PPARG gene expression with in both obese (G2) and diabetic obese (G4) group and TG, LDLc and GPT. The obese category of patients also showed a significantly negative intercorrelation with PPARG gene expression and hemoglobin. In addition, there was a strong positive correlation between PPARG gene expression and both fasting and glycated hemoglobin in diabetic obese group (G4) indicating the strength of the relationship between these PPARG gene expression and the glycemic control profile of patients. A strong positive correlation was found between PPARG gene expression and the acute phase protein CRP in both groups of obesity (G2 and G4) confirming the synergetic regulatory effect of PPARG on inflammation. PPARG gene expression did not show any correlation with biochemical parameters in both control and T2DM groups suggesting its important impact on obesity. Correlation coefficient (r) and significance (p) are shown in Table 3.4 and Table 3.5.
3.6 Correlation between demographic and biochemical markers
In obese group (G2), there was a direct positive relationship between BMI and TG, TC, LDL-C, and TG and a negative correlation between BMI and HDLc. This correlation between BMI and lipoprotein levels, has been proposed to be a strong contributing risk factor for obesity development. A positive correlation was also observed between BMI and CRP and GPT. It was also observed a significant positive correlation between Waistline and both TC and CRP in obese patients (G2). In diabetic obese group of patients (G4), BMI exerted a positive correlation with all of PPBG, TG, LDLc, GPT and CRP. Waistline exerted a positive correlation with TG, TC, LDLc and CRP. A good intercorrelation was observed between glycemic biomarkers (FBG, PPBG and HbA1C) in diabetic obese group (G4). There was significant positive intercorrelation between lipid profile markers in both obese and diabetic obese patients. Data are shown in Table 3.4. No significant correlations were observed in both control and T2DM group except for a good correlation between glycemic markers in T2DM group.
4 Discussion
Obesity is an important public health problem as it increases the risk of developing diabetes, heart disease, stroke, and atherosclerosis. Understanding molecular mechanisms of fat deposition and hyperlipidemia may help to identify patients under risk of obesity (Manna and Jain, 2015). However, there is a limited genetic background of obesity. PPARG has been reported to regulate lipid and glucose metabolism, cell proliferation and inflammation (Wagner et al., 2020). PPARG is required for adipocyte differentiation and is a key transcription factor for the expression of fat-specific genes during adipogenesis and can modulate systemic insulin resistance (Evseeva et al., 2021).
Obesity is known to be associated with increased expression of genes associated with inflammation in adipose tissue (Torres et al., 2022). PPARG was shown to modulate these inflammatory actions by suppression of inflammatory gene transcription and reversing macrophage infiltration (Nair et al., 2019). PPARG can control both macrophage and adipocyte differentiation in adipose tissue depending on the local environment enabling increased lipid storage capacity (Abaj et al., 2021). During inflammation process, PPARG can direct cell towards adipocyte differentiation resulting in retaining inflammatory genes in a suppressed state in adipose tissue during obesity (Gao et al., 2021). Thus, PPARG induction appears to be necessary and sufficient for obesity development to protect against obesity induced inflammation (Decara et al., 2020).
Gene expression studies in different tissues may help to identify genes that predispose individuals to obesity. In addition, peripheral blood samples are a convenient source of cells for genetic studies because it is difficult to obtain permission from a clinic to use tissue samples (Aarøe et al., 2010).
Therefore, the present study aimed to investigate the changes in relative PPARG gene expression profiling in serum of obese and diabetic obese patients in comparison to control and diabetic subjects. Also, to assess its pathogenic role in obese and diabetic obese patients. We also assessed the correlation of expression of PPARG with biochemical characteristics of patients. We also, estimated the PPARG potential for deteriorated kidney and liver functions during obesity progression.
Our results clearly showed that obese (G2) and diabetic obese (G4) individuals exerted increased PPARG mRNA levels in serum when compared to diabetic nonobese patients (G3) (Table 3.3) and is directly correlated with their BMI, WC and WHR (Tables 3.4 & 3.5). On contrast, such directed trend of PPARG relative expression toward increase was not observed in serum of diabetic group (G3) but a differential expression was observed within the same group (Table 3.3). Based on previous results of PPARG gene expression between group, we could suggest the regulatory role of PPARG in fat deposition in tissue and could be related to the expansion of the adipose tissue mass observed in obese patients. PPARG mRNA was previously reported to be dysregulated in adipose tissue secondary to obesity and increased food intake and could be of pathogenic importance (Wagner et al., 2020). In addition, PPARG variant was reported to be associated with increased body mass index (Sarhangi et al., 2020).
Our results showed that there was a significant (P < 0.05) positive correlation between PPARG gene expression with in both obese (G2) and diabetic obese (G4) group and TG and LDLc. These data are consistent with previous study that proved PPARG activation also regulates the transcription of genes that promote the synthesis of triglycerides (El Akoum, 2014). Based on the results of correlation analysis, PPARG relative expression was suggested to be used as potential molecule to monitor up in obesity progression as it is crucial for multiple lipid metabolic pathways and lipid homeostasis. Upregulation of PPARG in serum of both obese and diabetic obese patients may lead to increased lipid accumulation based on the proven positive correlation between the expression of PPARG with TG, LDL and BMI.
Positive correlation was also found between PPARG mRNA in serum of obese individuals (G2 and G4) and S.GPT activity suggesting obesity induced liver disease. In previous studies, it was shown that PPARG induce lipogenic transcription factor in the liver that contributes to steatosis (Vanessa, 2015). In accordance with the previously reported data by (Darwish et al., 2021) that PPARG overexpression has a role in diabetic complications in type 2 diabetes, our study showed a positive correlation between PPARG mRNA expression and glycemic control markers in diabetic obese patients (G4).
The link between inflammation and obesity is well-known and is proved by increased acute phase proteins like C-reactive protein (CRP) which is considered as an independent biomarker for the development of obesity (Sun et al., 2021). PPARG is expressed on numerous immune cells and can modulate inflammatory response especially in macrophages by shifting production from pro to anti-inflammatory mediators. PPARG could exert anti-inflammatory properties against obesity induced inflammation by modulation of immune cell by directing its differentiation to adipocyte rather than being macrophage (Cataldi et al., 2021).
Was previously proved to Our data also showed a marked positive correlation between serum PPARG mRNA and CRP in both groups of obesity (G2 and G4) emphasizing the counteracting effect of PPARG in obesity induced inflammation. These data suggest that a low-grade of chronic inflammatory state is induced during obesity progression and PPARG expression is activated to protect against obesity induced inflammation.
5 Conclusion
Our data now demonstrated differential pattern of PPARG expression between the studied groups. Together with its significant correlation with lipid profile and demographic characteristics (BMI, hipline, and WC) of obese subjects we could suggest that PPARG may have regulatory role in absolute fat mass storage and in obesity development. In addition, the correlation of PPARG transcript with glycemic control profile in diabetic obese subjects may underlie PPARG role of in the insulin signaling pathway and its possible pathophysiological importance in the development of complications of obesity. Altogether, these results will suggest that the potential change in PPARG expression may provide complementary data on obesity and type 2 diabetes susceptibility. Sample size was one of the limitations of this study due to the lack of large numbers of RT-PCR tests to quantify differential PPARG gene expression in our canter. Therefore, experiments with large sample size will be necessary to validate our results to reach more precise conclusion.
Acknowledgements
The authors extend their appreciation to the Researchers supporting project number (RSP2022R470), King Saud University, Riyadh, Saudi Arabia.
Declaration of Competing Interest
The authors declare that they have no known competing financial interests or personal relationships that could have appeared to influence the work reported in this paper.
References
- Gene expression profiling of peripheral blood cells for early detection of breast cancer. Breast Cancer Res.. 2010;12:R7.
- [CrossRef] [Google Scholar]
- Interaction between the dietary indices and PPAR-γ Pro12Ala gene variants on cardiovascular risk factors in patients with type 2 diabetes mellitus. Int. J. Clin. Pract.. 2021;75(8):e14307.
- [CrossRef] [Google Scholar]
- Addendum. 2. Classification and Diagnosis of Diabetes: Standards of Medical Care in Diabetes—2021. Diabetes Care 2021;44 (Suppl. 1): S15–S33 - September 01, 2021.
- Variation in PPARG is associated with longitudinal change in insulin resistance in Mexican Americans at risk for type 2 diabetes. J. Clin. Endocrinol Metab.. 2015;100(3):1187-1195.
- [CrossRef] [Google Scholar]
- TNFα mediates inflammation-induced effects on PPARG splicing in adipose tissue and mesenchymal precursor cells. Cells. 2021;11(1):42.
- [CrossRef] [Google Scholar]
- Prevention of overweight and obesity: how effective is the current public health approach. Int. J. Environ. Re.s Public Health.. 2010;7(3):765-783.
- [CrossRef] [Google Scholar]
- Genetics of obesity: What have we learned? Curr. Genomics.. 2011;12(3):169-179.
- [CrossRef] [Google Scholar]
- Diabetes induced renal complications by leukocyte activation of nuclear factor κ-B and its regulated genes expression. Saudi J. Biol. Sci.. 2021;28(1):541-549.
- [CrossRef] [Google Scholar]
- Comparison of different isolation techniques prior gene expression profiling of blood derived cells: impact on physiological responses, on overall expression and the role of different cell types. Pharmacogenomics J.. 2004;4(3):193-207.
- [Google Scholar]
- Peroxisome proliferatoractivated receptors: experimental targeting for the treatment of inflammatory bowel diseases. Front. Pharmacol.. 2020;11:730.
- [CrossRef] [Google Scholar]
- PPAR gamma at the crossroads of health and disease: a masterchef in metabolic homeostasis. Endocrinol. Metab. Syndr.. 2014;3:2161-11017.
- [CrossRef] [Google Scholar]
- Evseeva, M.N., Balashova, M.S., Kulebyakin, K.Y., Rubtsov, Y.P. Adipocyte biology from the perspective of in vivo research: review of key transcription factors. Int. J. Mol. Sci. 2021;23(1):322. Published 2021 Dec 28. doi:10.3390/ijms23010322.
- Estimation of the concentration of low-density lipoprotein cholesterol in plasma, without use of the preparative ultracentrifuge. Clin. Chem.. 1972;18:499-502. PMID: 4337382
- [Google Scholar]
- Gahagan, S.R.M, Kliegman, R.E, Behrman, H.B, Jenson B.F. Overweight and obesity. Nelson textbook of paediatrics. 2011: 19th edition, Philadelphia, Pa: Saunders Elsevier. Chap., 44.
- Mechanistic insight into PPARc and Tregs in atherosclerotic immune inflammation. Front. Pharmacol.. 2021;12:750078
- [CrossRef] [Google Scholar]
- Whole blood vs PBMC: compartmental differences in gene expression profiling exemplified in asthma. Allergy Asthma Clin. Immunol.. 2019;15
- [CrossRef] [Google Scholar]
- The epidemiology of obesity: a big picture. Pharmacoeconomics. 2015;33(7):673-689.
- [CrossRef] [Google Scholar]
- Acute-phase proteins: as diagnostic tool. J. Pharm. Bioallied Sci.. 2011;3(1):118-127.
- [CrossRef] [Google Scholar]
- Obesity and its metabolic complications: the role of adipokines and the relationship between obesity, inflammation, insulin resistance, dyslipidemia and nonalcoholic fatty liver disease. Int. J. Mol. Sci.. 2014;15(4):6184-6223.
- [CrossRef] [Google Scholar]
- Macrophage function in obesity-induced inflammation and insulin resistance. Pflugers Arch. Eur. J. Physiol.. 2017;469:385-396.
- [CrossRef] [Google Scholar]
- PPARγ and the global map of adipogenesis and beyond. Trends Endocrinol. Metab.. 2014;25(6):293-302.
- [CrossRef] [Google Scholar]
- Adipose tissue dysfunction as determinant of obesity-associated metabolic complications. Int. J. Mol. Sci.. 2019;20(9):2358.
- [CrossRef] [Google Scholar]
- Inflammatory links between obesity and metabolic disease. J. Clin Invest.. 2011;121(6):2111-2117.
- [CrossRef] [Google Scholar]
- Obesity, oxidative stress, adipose tissue dysfunction, and the associated health risks: causes and therapeutic strategies. Metab. Syndr. Relat. Disord.. 2015;13(10):423-444.
- [CrossRef] [Google Scholar]
- Downregulation of adipose tissue fatty acid trafficking in obesity: a driver for ectopic fat deposition? Diabetes. 2011;60(1):47-55.
- [CrossRef] [Google Scholar]
- Endothelial PPARγ (Peroxisome Proliferator-Activated Receptor-γ) protects from angiotensin II-induced endothelial dysfunction in adult offspring born from pregnancies complicated by hypertension. Hypertension. 2019;74(1):173-183.
- [Google Scholar]
- Relationship of waist circumference, waist hip ratio and body mass index as predictors of obesity in adult Nigerians. Pak. J. Nutr.. 2011;10:15-18.
- [CrossRef] [Google Scholar]
- Association between insulin resistance and the development of cardiovascular disease. Cardiovasc Diabetol. 2018;17:122.
- [CrossRef] [Google Scholar]
- PPARG (Pro12Ala) genetic variant and risk of T2DM: a systematic review and meta-analysis. Sci. Rep.. 2020;10:12764.
- [CrossRef] [Google Scholar]
- PPARs-orchestrated metabolic homeostasis in the adipose tissue. Int. J. Mol. Sci.. 2021;22(16):8974.
- [CrossRef] [Google Scholar]
- PPAR-γ gene expression in human adipose tissue is associated with weight loss after sleeve gastrectomy. J. Gastrointest. Surg.. 2022;26:286-297.
- [CrossRef] [Google Scholar]
- Peroxisome proliferator-activated receptors as targets to treat non-alcoholic fatty liver disease. World J. Hepatol.. 2015;7(8):1012-1019.
- [CrossRef] [Google Scholar]
- Wagner, Nicole, Kay-Dietrich Wagner. The role of PPARs in disease. Cells 9(11) 2367. 2020, doi:10.3390/cells9112367.


