

Translate this page into:
Potability assessment of packaged sachet water sold within a tertiary institution in southwestern Nigeria
⁎Corresponding author. omobolaji.opafola@oouagoiwoye.edu.ng (Omobolaji Taofeek Opafola)
-
Received: ,
Accepted: ,
This article was originally published by Elsevier and was migrated to Scientific Scholar after the change of Publisher.
Peer review under responsibility of King Saud University.
Abstract
Production of quality and safe potable water is vital to human health. This research examined the potability of the packaged sachet water being marketed within the Federal University of Agriculture, Abeokuta (FUNAAB) campus. Seven sachet water brands were purchased randomly and the physicochemical and bacteriological qualities were determined. The results acquired are as follows: pH, 6.57–6.79 ± 0.02; electrical conductivity (EC), 0–145.00 ± 5.00 μScm−1, turbidity, 0.00–0.59 ± 0.02 NTU; total dissolved solids (TDS) 0.00–70.00 ± 0.00 mg/L; total suspended solids (TSS), 0.00–0.01 ± 0.00 mg/L; calcium, 42.00–161.00 ± 1.00 mg/L; iron, 0.65–1.25 ± 0.05 mg/L; alkalinity, 0.65–1.25 ± 0.05 mg/L; sulphate, 0.95–33.71 ± 0.01 mg/L; and nitrate, 0.01–0.04 ± 0.00 mg/L. Magnesium and phosphate were below detection level. The odour and taste were also unobjectionable. The physicochemical test results conformed with the World Health Organization World Health Organisation (WHO) (2004) and Nigerian Standard for Drinking Water Quality (NSDWQ) standards for drinking water. However, bacteriological analysis established the presence of total bacteria count in all water samples (100%) while two brands, (sample C and G), of the packaged sachet water (28.57%) were contaminated with total coliforms which failed to comply with WHO and NSDWQ standard. The analysed physicochemical and bacteriological parameters of the water samples exhibited significant differences (P < 0.05). Sustainable measures such as scientific examination of the water quality during preproduction, production and postproduction stages to determine the means of access of contaminants as its directly affect public health and safely should be routinely performed by the water producers. The National Agency for Food and Drug Administration and Control should implement established regulations and execute their statutory responsibilities through routine checks and effective monitoring of the operation and production facilities. Furthermore, Standard Organisation of Nigeria should intensify its effort through restrictions of the manufacturers using substandard packaging materials for their production. Consequently, there is need to invest in sustainable water infrastructure (water supply systems, treatment plants, storage and water resource management) that will cater for the populace of the entire university community through partnership with relevant stakeholders in the water industry and donations from non-governmental, national and international organizations hence, reducing the dependence on water supply from substandard private vendors.
Keywords
Physicochemical analysis
Sachet water
Total coliform
Water quality
Waterborne infections

Nomenclatures
- NTU
Nephelometric Turbidity Unit
- TCU
Visual colour measured in True Colour Unit
- TBC
Total Bacterial Count, cfu/mL
- TCC
Total Coliform count, cfu/mL
- TSS
Total Suspended Solid,
- TDS
Total Dissolved Solid, mg/L
- TS
Total Solid, mg/L
Greek symbols
- μSiemen
Electrical conductivity measured in micro Siemen/cm
Abbreviations
- NSDWQ
Nigerian Standard for Drinking Water Quality
- WHO
World Health Organization
- FUNAAB
Federal University of Agriculture, Abeokuta
1 Introduction
Drinking water quality is one of the major significances affecting human health, lifestyle and economic well-being. Water is life, only when it’s safe and wholesome, and therefore a vital element for the maintenance of life as well as safe and healthy environment (Rajiv et al., 2012; Ajibade et al., 2015; Thliza et al., 2015; Hassan et al., 2016; Li and Wu, 2019). According to Li and Wu (2019), drinking water quality is solemnly dependent on the quality of source water, the treatment in water treatment plants before distributed, the water distribution system and the containers/tanks used for water storage and the household filters. Groundwater is a primary water resource for drinking, irrigation, and industrial uses in many countries. However, the quality is determined by various water quality parameters. The seriousness of groundwater contamination has aroused the attention from the public and produced an enthusiasm of groundwater quality research among scholars (Li et al., 2017; Ilori et al., 2019; Wu et al., 2019). The inadequacy of groundwater resources and its deficient management could be traced to groundwater depletion, groundwater quality deterioration and environmental degradation such as soil salinization (Li and Qian, 2018). The increase in human population has increased the demand for potable drinking water. Vendors are well patronized for this commodity within tertiary institutions as a means to satisfying their need for safe drinking water owing to its low unit cost price compared to bottled water. However, the potability and suitability of this sachet water for human consumption have been questioned over the years due to the working environment and unhygienic practices surrounding its production. The raw water used for the production is mainly sourced from deep infiltration wells and boreholes. In a layman’s term, sachet water is mostly referred to as ‘pure water’, a label it earned from the false impression that sachet packaged water is totally pure and free from physicochemical and microbiological contaminants. The major health challenges confronting most developing nations could be traced to the lack of adequate potable water. However, the application and consumption of contaminated water poses serious health issues amidst the infants with poor immune system to combat water-related diseases. Ibrahim et al., (2015) investigated the potability of randomly selected sachet and bottled water marketed within Bauchi metropolis in Nigeria. The findings revealed that the physical and chemical characteristics of the water brands do not wholly meet the recommended standards while the microbiological evaluation revealed that only 26.67% and 75.00% of the sachet and bottled water respectively had total bacteria coli form within the recommended standards. They concluded that 73.30% and 25.00% of sachet and bottled water considered in the study are not fit for Human consumption at the time of the studies. Emenike et al. (2017) assessed the health risk and variability of heavy metal such as chromium (Cr), iron (Fe), manganese (Mn), copper (Cu), aluminum (Al), and zinc (Zn) in sachet water sold in Ado-Odo Ota, South-Western Nigeria. High concentrations of Cr, Fe, and Al were found in all the samples exceeded the maximum allowable limits of all the standards considered. However, the concentrations of Zn, Mn, and Cu were within permissible limits. They recommended that proper and effective treatment is required to safeguard the health of consumers. Duru et al. (2017) investigated the effect of storage on some sachet water quality indicators over a twelve-week period. The brands showed various degree of variation over the period of study for the chemical quality indicators. All brands analyzed were within permissible limit by World Health Organization World Health Organisation (WHO) (2004). Nevertheless, the continuous storage can significantly alter the chemical quality indicators to a level that exceeds the limit set by WHO. The researchers recommended that sachet water should not be stored for more than 12 weeks from the date of production. Consequently, several studies have pointed out diverse variation in water quality indicators. These studies have reported chemical and microbial contamination in drinking water (Balogun et al., 2014; Michael et al., 2015; Addo et al., 2016; Chinenye and Amos 2017), the outcome of these investigative reports is a rationale to perform another water quality investigation. Most residential students of the Federal University of Agriculture, Abeokuta (FUNAAB) rely on sachet water as a source of potable water and hold it in such regard. Hence, it becomes imperative to assess the potability of the packaged sachet water sold within the FUNAAB campus by determining the physicochemical and bacteriological qualities of the products to establish whether or not they adapt to the recommended standards for potable water.
2 Materials and methods
2.1 Sample collection
Seven different brands of sachet-packed drinking water sold within the campus premises labelled (A, B, C, D, E, F, and G) were collected for the study. The purchase of the samples was made from selected vendors and restaurants situated within the FUNAAB premises. The selection of the purchase outlets was based on high student traffic influx at the respective locations namely the university’s halls of residence, commercial car park and lecture theatres. The water samples used for the research were collected within 2 weeks of production in accordance with the assertions of Duwiejuah et al. (2013), Akinde et al. 2011, and Ojekunle et al. (2015) which says the effects of room temperature storage technique on sachet water have been established to manifest after 2 weeks of production. They were placed in ice-cooled insulated coolers and transported to the laboratory. Samples were refrigerated at 4 °C upon arrival at the laboratory prior to analysis to serve as preservative measure as stated by APHA (2012) and USEPA (2016). A total of twenty-one samples (three samples each for each brand) were purchased randomly from vendors and restaurants situated within the FUNAAB premises. Analysis for each brand was done in triplicate to determine the physical, chemical and microbiological properties of the samples. Fig. 1 exhibits the map of the study area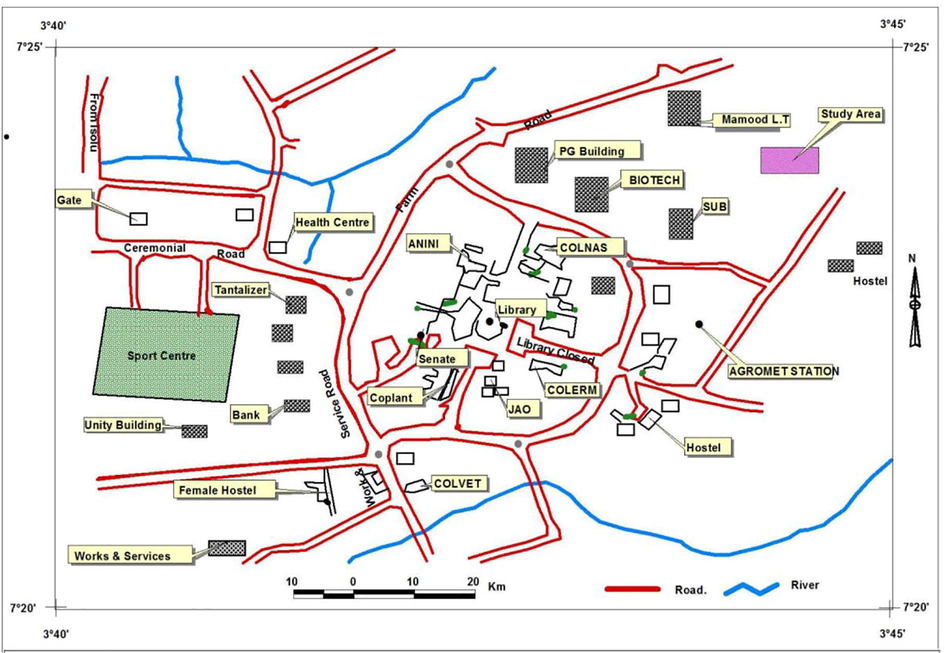
Map of the study area (Alabi et al., 2017).
2.2 Physicochemical assessment
pH, electrical conductivity (EC) and total dissolved solids (TDS) were determined using HANNA Combo Hi 98130. The Total suspended solid (TSS) was determined by the gravimetric method and the total solids (TS) was estimated from the values of Total Dissolved Solids (TDS) and Total Suspended Solids (TSS) respectively, Calcium, magnesium, iron and alkalinity were examined by the procedures illustrated in APHA, (2012).
2.3 Bacteriological assessment
Bacteriological analysis of the samples was assessed by multiple tube fermentation technique by procedures described in APHA (2012) and Adetunde et al. (2014). The reagents used for the microbial analysis are Nutrient agar (MERCK, Darmstadt, Germany) and MacConkey agar. Quality assurance was asserted by adequate cleaning and sterilization of containers and apparatus, appropriate sample tag and aseptic environment prior to the bacteriological analysis to eliminate external contamination.
2.4 Statistical analysis
Data analysis was done by one-way Analysis of Variance (ANOVA) using Statistical Package for Social Sciences (SPSS) version 20.0 software. All experiments were conducted in triplicates. The means were compared by Duncan’s multiple range tests. Differences were considered significant at p < 0.05.
3 Results and discussion
3.1 Physical assessment
Table 1 illustrates the physical assessment of the sachet water samples. The taste and odour of all the water samples was innocuous (Table 1). pH values ranged from 6.57to 6.79 ± 0.02 with sample E having the lowest pH value of 6.57 and sample C having the highest pH value of 6.79. The pH values obtained are significantly different. The pH values of all the water samples were within the recommended standard of NSDWQ/WHO drinking water quality guidelines which ranged pH of potable water between 6.5 and 8.5. A pH below 7 is considered to be slightly acidic. However, slightly acidic water has no adverse effect on human health but can cause corrosion to metallic pipes. The electrical conductivity (EC) of the sachet water samples ranged from 0to 145.00 ± 5.00 μScm−1. There were significant differences between the EC values were relatively low compared to the maximum of 1000 µScm−1 recommended by NSDWQ and WHO for drinking water. The concentration of ions present in the water will determine the degree of its conductivity. According to Ndinwa et al. (2012), low electrical conductivity values connote that the concentration of dissolved salts present in the water is low. The maximum turbidity content recommended by WHO in drinking water is 5.0 NTU. Sample B has the highest turbidity value of 0.59 NTU while sample C is a non-turbid water sample. Okechukwu et al. (2015) obtained a similar result for turbidity which ranged from 0.24 to 0.43 NTU. The amount of particulate matter present in a water sample affects its level of turbidness. Turbidity is known to have effects on taste, odour, and colour of water (Ndinwa et al., 2012). All the water samples had a uniform mean colour value of 5.00 TCU which was within the NSDWQ/WHO limits of 15 TCU. This result is in tandem with that of Taiwo et al. (2012), and Nwosu and Ogueke (2004) which reported 5 TCU for all the samples assessed. The TSS and TDS analysis disclosed that only sample C has zero TS. This result indicated that there is no particulate matter present in sample C. TS values of other samples vary from 0.00 to 70.05 ± 0.05 mg/L, this is lower than the maximum value of (500 mg/L) permissible by WHO. There was significant difference in the TS values obtained expect for samples A and B. Data are presented as Mean ± Standard Error (n = 3). Values with the same superscript letter(s) along the same column are not significantly different (P < 0.05). EC, TDS, TSS, and TS represent Electrical Conductivity, Total Dissolved Solid; Total Suspended Solid and Total Solid respectively.
Sample
pH
EC µScm-1
Colour ±0.00 (TCU)
Turbidity (NTU)
TDS (mg/L)
TSS (mg/L)
TS (mg/L)
A
6.78 ± 0.02c
105.00 ± 5.00b
5.00
0.47 ± 0.01e
60.00 ± 0.00c
0.01 ± 0.00b
60.05 ± 0.04c
B
6.68 ± 0.03b
135.00 ± 5.00c
5.00
0.59 ± 0.02f
60.00 ± 0.00c
0.01 ± 0.00b
60.05 ± 0.04c
C
6.79 ± 0.02c
0.00 ± 0.00a
5.00
0.00 ± 0.00a
0.00 ± 0.00a
0.00 ± 0.00a
0.00 ± 0.00a
D
6.64 ± 0.02ab
0.00 ± 0.00a
5.00
0.35 ± 0.01d
0.00 ± 0.00a
0.009 ± 0.00ab
0.02 ± 0.00a
E
6.57 ± 0.01a
145.00 ± 5.00c
5.00
0.30 ± 0.01c
70.00 ± 0.00
0.009 ± 0.00ab
70.05 ± 0.05d
F
6.74 ± 0.01bc
105.00 ± 5.00b
5.00
0.17 ± 0.01b
50.00 ± 0.00b
0.006 ± 0.00ab
50.05 ± 0.05b
G
6.65 ± 0.05ab
115.00 ± 5.00b
5.00
0.31 ± 0.01c
0.00 ± 0.00a
0.008 ± 0.00ab
0.01 ± 0.00a
*WHO
6.5–8.5
1000
15
5
500
–
500
**NSDWQ
6.5–8.5
1000
15
5
–
–
–
3.2 Chemical assessment
The holistic summary of the analytic investigation is graphically presented in (Fig. 2). Table 2 showed the results of the chemical analysis of the sachet water. The alkalinity ranged between 0.65 and 1.25 ± 0.05 mg/L. Sample E has the lowest alkalinity value of 0.65 mg/L while samples B, C and D possess the highest alkalinity value of 1.25 mg/L. There were significant differences in Alkalinity The concentration of iron in the water samples varied from 0.02 to 0.06 ± 0.01 mg/L. Meanwhile, significant difference was observed relatively lower than the guideline value of 0.3 mg/L recommended by WHO and NSDWQ. The value obtained in this study is akin to Mustapha et al. (2015) which reported that iron present in sachet water sold within Bauchi metropolis ranged from 0.01 to 0.07 mg/L. Calcium is a vital nutrient required by the body for bone formation, development and healthy sustainable maintenance of the teeth. The maximum concentration of calcium stipulated by the WHO in drinking water is 250 mg/L All the water samples analysed were within this guideline value. From the analysis, the Calcium concentration of the water samples ranged between 42.00 and 161.00 mg/L. Sample D has the least concentration of 40 mg/L while sample B has the highest concentration of 160 mg/L as shown in Table 2. However, all the samples were significantly different except for samples A and E. Water hardness is induced by the excess concentration of calcium present in water. The results of other inorganic constituents such as nitrate and sulphate analysed are presented in Table 2. Phosphate and magnesium contents in all the water samples were undetected below detection level. All the water samples had nitrate content below detection level except sample A and B which had 0.04 and 0.01 mg/L values respectively. There was significant difference in nitrate. Sulphate content of water samples A, B, E, F and G ranged from 0.95 to 33.71 ± 0.01 mg/L while, water samples C and D had sulphate content below detection level. The analytical outcome revealed that all the sachet water brands was significantly different and the values conform to the recommended NSDWQ guideline of maximum sulphate content at 100 mg/L. Data are presented as Mean ± Standard Error (n = 3). Values with the same superscript letter(s) along the same column are not significantly different (P < 0.05). WHO, NSDWQ and BDL represent World Health Organisation; Nigeria Standard for Drinking Water Quality and Below Detection Level respectively.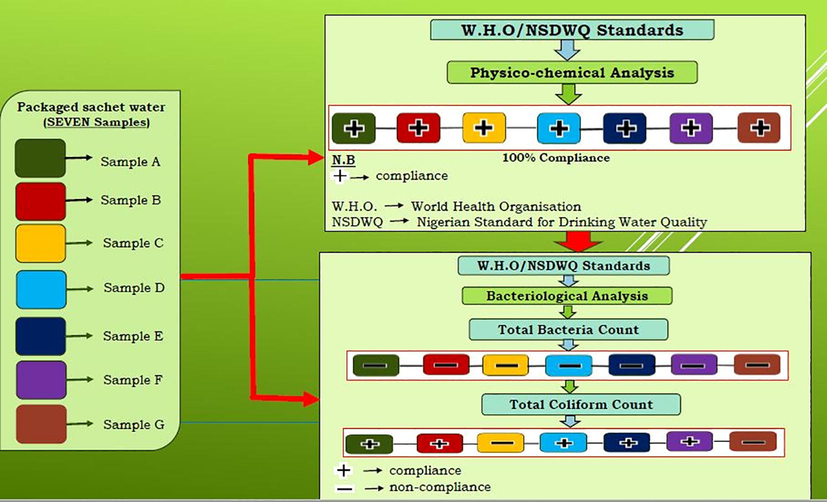
Graphical representation of the analytical research.
Samples
Calcium (mg/L)
Magnesium (mg/L)
Iron (mg/L)
Alkalinity (mg/L)
Sulphate (mg/L)
Phosphate (mg/L)
Nitrate (mg/L)
A
121.50 ± 1.50c
BDL
0.03 ± 0.01b
1.00 ± 0.00b
0.95 ± 0.01b
BDL
0.04 ± 0.00c
B
161.00 ± 1.50f
“ ”
0.02 ± 0.01a
1.25 ± 0.05c
20.18 ± 0.02d
“ ”
0.01 ± 0.00b
C
65.00 ± 1.00b
“ ”
0.04 ± 0.01b
1.25 ± 0.05c
BDL
“ ”
BDL
D
42.00 ± 2.00a
“ ”
0.02 ± 0.01a
1.25 ± 0.05c
BDL
“ ”
“ ”
E
121.50 ± 1.50c
“ ”
0.03 ± 0.01b
0.65 ± 0.05a
2.43 ± 0.01c
“ ”
“ ”
F
139.00 ± 1.00e
“ ”
0.06 ± 0.01c
0.85 ± 0.05b
32.75 ± 0.01e
“ ”
“ ”
G
129.00 ± 1.00d
“ ”
0.04 ± 0.01b
0.85 ± 0.05b
33.71 ± 0.01f
“ ”
“ ”
*WHO
250
–
0.3
500
250
–
50
**NSDWQ
–
0.2
0.3
–
100
3.5
50
3.3 Bacteriological assessment
Table 3 presents the results of the bacteriological analysis of the water samples. The Total bacteria count (TBC) observed in all the brands ranged from 200 to 1700 cfu/mL (Table 3). Sample F had the highest TBC of 1700 cfu/mL while sample A had the lowest TBC of 200 cfu/mL. All the water samples fail to comply with WHO recommended standard of 100 cfu/mL for total heterotrophic count in drinking water. Hence, the water samples are unsuitable for drinking. Samples C and G representing (28.57%) had TCC of 0.1 and 0.9 cfu/mL respectively. All the water samples except sample C and G comply with the WHO guideline for coliform bacteria in drinking water which is at zero total coliforms per 100 mL of water. There were significant differences in the values of TBC and TCC obtained for the samples. The total coliform count value obtained in this study is similar to that of Ndinwa et al. (2012) and Ojo (2015) which reported zero coliform present in sachet water sold within Southern and Southwestern Nigeria respectively. The existence of coliform bacteria in sample C and G make the brands unsuitable for human consumption. The existence of coliforms in potable water is used as an indicator of water contamination and represents a greater risk to infectious pathogens (Opara and Nnodim, 2014; Musa et al., 2014). Data are presented as Mean ± Standard Error (n = 3). Values with the same superscript letter(s) along the same column are not significantly different (P < 0.05).
Samples
Total Bacteria Count × 103 (cfu/mL)
Total Coliform Count × 103 (cfu/mL)
A
0.2 ± 0.05a
0.00 ± 0.00a
B
0.7 ± 0.10b
0.00 ± 0.00a
C
1.5 ± 0.10d
0.01 ± 0.00b
D
1.2 ± 0.05cd
0.00 ± 0.00a
E
1.2 ± 0.05cd
0.00 ± 0.00a
F
1.7 ± 0.05e
0.00 ± 0.00a
G
1.0 ± 0.05c
0.9 ± 0.02c
*WHO
102
–
3.4 Recommendations and measures
The determination of microbial contamination exceeding the recommended guidelines is an eminent threat to public health and safety. This investigative outcome necessitates effective quality control measures. However, the menace could be mitigated through following measures;
The management needs to conduct public awareness seminars on water quality protection which is a key significance to ensuring and improving public health and safety.
Policies and regulations should be constituted by the university management to address the poor hygiene, handling and storage of the packaged sachet water marketed by vendors within the institution. However, the constituted policies and regulations should be accompanied with routine monitoring and enforcement to achieve total and comprehensive compliance.
The packaged sachet water producers should scientifically examine the water quality during preproduction, production and postproduction stages to determine the means of access of contaminants in order to improve their quality as its directly affect public health and safely.
The National Agency for Food and Drug Administration and Control should implement established regulations and execute their statutory responsibilities through routine checks and effective monitoring of the operation units and production facilities. Furthermore, Standard Organisation of Nigeria should intensify its effort through restriction of the manufacturers using substandard packaging materials for their production.
Consequently, there is need to invest in sustainable water infrastructure (water supply systems, treatment plants, storage and water resource management) that will cater for the populace of the entire university community through partnership with relevant stakeholders in the water industry and donations from non-governmental, national and international organizations hence, reducing the dependence on water supply from substandard private vendors.
4 Conclusion
The qualities of selected brands of packaged sachet drinking water marketed within the FUNAAB Campus were assessed qualitatively by examining their physicochemical and bacteriological qualities. The results of the physicochemical analysis showed that all the water samples (100%) complied with the WHO and NSDWQ recommendations and guidelines. The results of the bacteriological analysis revealed the presence of total bacteria count in all the water samples (100%) while two brands (sample C and G) of the sachet water (28.57%) were contaminated with total coliforms which failed to comply with WHO and NSDWQ standard for coliform bacteria in drinking water which is at zero total coliforms per 100 mL of water. The existence of coliform bacteria in sample C and G make the brands unsuitable for human consumption.
Declaration of Competing Interest
The authors declare that they have no known competing financial interests or personal relationships that could have appeared to influence the work reported in this paper.
References
- Effect of varying storage temperatures on the microbiological quality of street sold water in the Kumasi Metropolis, Ghana. Res. J. Microbiol.. 2016;11(2–3):56-63.
- [Google Scholar]
- Bacteriological quality of sachet water produced and sold in the Bolgatanga Municipal in the Upper East Region of Ghana. Int. J. Mod. Soc Sci.. 2014;3:36-43.
- [Google Scholar]
- Issues, Challenges and Management of Water Supply and Sanitation in Nigeria: An Overview. In: Conference Proceedings on National Development Strategies towards Sustainable Civil Infrastructure. In: 13th International Civil Engineering Conference and Annual General Meeting held at Kwara Hotel, Ilorin, Nigeria, 28th – 30th October. Nigerian Institution of Civil Engineers; 2015. p. :19-34.
- [Google Scholar]
- Storage effects on the quality of sachet water produced within port harcourt metropolis, Nigeria. Jordan J. Biol. Sci.. 2011;4(3):157-164. ISSN 1995-6673
- [Google Scholar]
- Site characterization for construction purposes at FUNAAB using geophysical and geotechnical. Methods RMZ – M & G. 2017;64:1-14.
- [Google Scholar]
- Standard Methods for the Examination of Water and Wastewater (21st ed.). Washington, DC: American Public Health Association; 2012. p. :10-15.
- Physicochemical and microbiological profile of drinking water sold in Abeokuta, Ogun State, Nigeria. Nat. Sci.. 2014;12(3):103-105.
- [Google Scholar]
- Effect of storage and exposure to sunlight on the quality of sachet water sold in ibadan metropolis. Sci. J. Public Health.. 2017;5(4):321-328.
- [CrossRef] [Google Scholar]
- Storage and its effect on chemical quality indicators in sachet water brands sold in Owerri Municipal, Imo State, Nigeria. World News Nat. Sci.. 2017;12:73-81.
- [Google Scholar]
- Effect of storage on the quality of sachet-vended water in the tamale metropolis, Ghana. J. Environ. Protect.. 2013;4:629-637.
- [CrossRef] [Google Scholar]
- Health risk assessment of heavy metal variability in sachet water sold in Ado-Odo Ota, South-Western Nigeria. Environ. Monit. Assess.. 2017;189:480.
- [CrossRef] [Google Scholar]
- The influence of drinking water quality on health and food security in Taraba State, Nigeria. Eur. J. Earth Environ.. 2016;3(2):1-16.
- [Google Scholar]
- Qualitative assessment of sachet and bottled water marketed in Bauchi metropolis, Nigeria. Chem. Process Eng. Res.. 2015;37:11-23.
- [Google Scholar]
- Qualitative assessment of some available water resources in Efon-alaaye, Nigeria. J. Appl. Sci. Environ. Manage.. 2019;23(1):29-34.
- [CrossRef] [Google Scholar]
- Water resources research to support a sustainable China. Int. J. Water Res. Dev.. 2018;34(3):327-336.
- [CrossRef] [Google Scholar]
- Progress, opportunities and key fields for groundwater quality research under the impacts of human activities in China with a special focus on western China. Environ. Sci. Pollut. Res.. 2017;24(15):13224-13234.
- [CrossRef] [Google Scholar]
- Drinking water quality and public health. Expos. Health. 2019;11(2):73-79.
- [CrossRef] [Google Scholar]
- Microbiological and chemical quality of packaged sachet water and household stored drinking water in Freetown, Sierra Leone. PLoS One. 2015;10(7):1-17.
- [Google Scholar]
- Quality Assessment of Sachet Water in Minna Metropolis of Niger State, Nigeria. In: Proceedings of 44th Annual Conference, Exhibition of Nigerian Society of Chemical Engineers (NSChE), Nov. 20 – 22nd, 2014, Owerri, Imo State. 2014.
- [Google Scholar]
- Qualitative assessment of sachet and bottled water marketed in Bauchi Metropolis, Nigeria. Chem. Process Eng. Res.. 2015;37:11-23.
- [Google Scholar]
- Physio-chemical and bacteriological characteristics of bottled and sachet brand of packaged water in Warri and Abraka, Southern Niger. J. Environ. Manage. Safety. 2012;3(2):145-160.
- [Google Scholar]
- Nigerian Standard for Drinking Water Quality (NSDWQ), 2007. Parameters and Maximum allowable limits, Nigerian Industrial Standards, 15 - 17.
- Evaluation of sachet water samples in Owerri Metropolis. Nig. Food J.. 2004;22:0189-7241.
- [Google Scholar]
- The effects of storage on sachet water quality in Ogun State, Nigeria. J. Appl. Sci. Environ. Manage.. 2015;19(2):183-189.
- [CrossRef] [Google Scholar]
- Quality assessment of selected sachet water brands in Akure metropolis, south western Nigeria. Eur. Int. J. Sci. Technol.. 2015;4(2):1-8.
- [Google Scholar]
- Physico-chemical quality of different brands of sachet water sold in federal university of technology campus Imo State, Nigeria. Res. J. Chem. Sci.. 2015;5(1):83-87.
- [Google Scholar]
- Prevalence of Bacteria in bottled and sachet water sold in Owerri metropolis. Int. J. Sci Innov. Discov.. 2014;4:117-122.
- [Google Scholar]
- Physicochemical and microbial analysis of different river waters in western Tamil Nadu, India. Res. J. Environ Sci.. 2012;1(1):2-6.
- [Google Scholar]
- Physicochemical and bacteriological analyses of sachet water samples in abeokuta metropolis. Global Adv. Res. J. Agric. Sci.. 2012;1(1):001-006.
- [Google Scholar]
- Study of some bacterial load of some brands of sachet water sold in Ahmadu Bello University (Main Campus), Zaria, Nigeria. Int. J. Curr. Sci.. 2015;14:91-97.
- [Google Scholar]
- United States Environmental Protection Agency (2016). Quick Guide to Drinking Water Sample Collection. Region 8 Laboratory, Second Edition. Washington D.C., 1-20.
- Guidelines for Drinking Water Quality (third ed.). Geneva, Switzerland: WHO press; 2004. p. :355-398.
- Statistical and multivariate statistical techniques to trace the sources and affecting factors of groundwater pollution in a rapidly growing city on the Chinese Loess Plateau. Risk Assess Human Ecol. 2019
- [CrossRef] [Google Scholar]


