

Translate this page into:
Pollinators and pollination effects on three canola (Brassica napus L.) cultivars: A case study in Upper Egypt
-
Received: ,
Accepted: ,
This article was originally published by Elsevier and was migrated to Scientific Scholar after the change of Publisher.
Peer review under responsibility of King Saud University.
Abstract
This research aimed to survey the insect pollinators and visitors of canola, to assay their foraging activities and to study their effects on three canola cultivars (Pactol, Serw-4 and Serw-6) at the Experimental Field Station in Assiut region, Upper Egypt during two flowering seasons 2017/18 and 2018/19. The results manifested that there were nine species of insect pollinators and visitors belonging to four orders and eight families. The majority of the pollinators were Hymenoptera (83%), especially honey bees (Apis mellifera L.), Diptera (12%), Butterflies (Lepidoptera; 3%) and the beetles (Coleoptera; 2%). The peak activity of honey bees was recorded between 9 am and 11 am while for the other insect pollinators, except, syrphid flies was 11 am. The caged cultivars (without insect pollination) had statistically significant lower yield parameters (silique number per plant, seed number per silique, weight of 1000 seeds, oil content and seed germination) than the uncaged cultivars (accessible to insect pollinators and visitors). Uncaged plants of canola Pactol and Serw-4 cultivars had high seed oil content (44.34, 51.40%), seed yield (681.8, 429.0 kg/ha.) and seed germination percentage (80, 86%), respectively. Serw-4 cultivar had the first rank in the weight of siliques and seeds. This study indicated that the yield of the canola crop was positively influenced by insect pollinators. Serw-4 is a promising cultivar for large-scale production of edible oil.
Keywords
Canola cultivars
Apis mellifera L.
Production yield
Foraging activity

1 Introduction
Canola or oilseed rape (Brassica napus L.) has rapidly become one of the most important sources of edible oil in the world (Lamb, 1989). Brassica napus has been recently introduced into Egypt and has pulled the focus of a considerable attention as an excellent economic alternative to other human consumable oils and biodiesels (Hozayn and EL-Mahdy, 2017).
Canola is 70% self-pollinated (Downey et al., 1970). However, several studies have shown the importance of pollinators for maximizing the economic value of canola (Halinski et al., 2018). High numbers of insect species belonging to different orders have been recorded as pollinators of canola plants. However, the honey bee is considered the most effective pollinator (Rosa et al., 2010). Variations in the activity peaks and the day time foraging activity of honey bees on canola flowers were reported under the European conditions (Steffan-Dewenter, 2003), in America and Brazil (Witter et al., 2014), and in North Egypt (Kamel et al., 2015).
Open pollination of canola has several positive effects on the quantity and quality of canola development and productivity. Several investigators studied the canola productivity characters i.e. number of siliques per plant (Kamel et al., 2015), the seed number per silique (Steffan-Dewenter, 2003), the weight of 1000 seeds (Free and Nuttall, 1968), the yield per plant/ha. (Oz et al., 2008), seed germination (Kevan and Eisikowitch, 1990) and oil content of seed (Bommarco et al., 2012). The large variance between canola cultivars in plant and oil yields has encouraged investigators to study these variations (Mekki, 2013; Farrag et al., 2019). Also, Hozayn and EL-Mahdy (2017) highlighted the performance of different canola genotypes for enhancing yield and production considering genotype as a key factor affecting productivity of canola.
Pollinator species and their foraging activity on canola flowers have not been studied sufficiently in Upper Egypt. Also, the impacts of pollinators on the canola yield have not been well documented. Therefore, the objectives of this study are to survey insect pollinator and visitor species, to assess their foraging activities and to determine the effects of pollinators on the yield quantity and quality of three canola cultivars in Assiut region, Upper Egypt.
2 Materials and methods
2.1 Experimental design
The observations were conducted on canola plants at the Experimental Field Station (27° 11′ 04″ N and 31° 09′ 19 ” E) of Plant Protection Department, Faculty of Agriculture, Assiut University, Upper Egypt during 2017/18 and 2018/19 growing seasons. The experimental plots located 500-meter distance near the apiary of the department which consists of 20 colonies. An area of about 0.42 ha (ha) was divided into plots, each plot was 0.105 ha (6 rows/plot). Three canola cultivars were planted, Serw-4, Serw-6 and Pactol. These cultivars were planted on 1 October 2017 for the season 2017/18 and 1 October 2018 for the season 2018/19. The flowering period of canola extends from December to March. Regular conventional agricultural practices were used, and no insecticide treatments were applied.
Experimental plots (4 replicates/ cultivar, each replicate contained 25 plants with a total of 100 plants per cultivar) were divided into two areas, one accessible for insect pollinators and visitors (uncaged plant) and the other inaccessible (caged plant). Distance between seeds was 30 cm within the row and 50 cm between rows and one plant per hill was thinned. To prevent the entry of insect pollinators and ensure adequate ventilation; wood framed cages (150 × 60 × 60 cm) covered with a white muslin cloth, with 1 mm mesh were placed in each plot center. For the other treatments (caged conditions), the remaining area/plot was left open and freely accessible to pollinators and flower visitors.
2.2 Activities of insect pollinators and visitors on canola flowers
This experiment was done on uncaged canola plants (accessible by insect pollinators and visitors). This experiment aimed to identify species and activity of insects on canola flowers regardless canola cultivars. The small study area with uncaged plants enabled insects to visit all cultivars without clear preference. In this way, data were collected randomly from all tested plots and not collected separately on each canola cultivar.
2.2.1 Species abundance
Insect pollinators and visitors on uncaged canola plants were observed weekly from 15 December to 15 March during the two flowering seasons 2017/18 and 2018/19. A standard aerial net (35 cm diameter) was used to collect all insects (Borror et al., 1989). The collected insects were killed in a killing jar using a piece of cotton saturated with chloroform (70%) in polyethylene pages and were transferred to the laboratory. Insects were pinned or pointed and labeled. All insect specimens were curated in the laboratory and identified by Agricultural Research Center taxonomists (Giza, Egypt). Abundance percentages of the collected insect pollinators from different species were estimated using the formula of Facylate (1971) as following:
Where:
A = Abundance percentages.
n = Total number of samples in which each species appeared.
N = Total number of samples taken all over the season.
2.2.2 Foraging activity of honey bees and other insect pollinators at day-time
The day-time activity of insect pollinators throughout canola flowering seasons of 2017/18 and 2018/19 was estimated on uncaged canola plants. Observations were made at 9 am, 11 am, 1 pm, 3 pm and 5 pm each day during the two flowering seasons (from 15 December to 15 March) to determine the time activity of insect pollinators. A wooden frame of 1 m2 area was used to count the number of pollinators visiting each square meter area for five minutes in each period for each replica (insects per m2 per 5 min).
2.3 Effects of pollinators on canola yield
2.3.1 Seeds and silique set
Number of seeds per silique and weight of 1000 seeds in addition to number of siliques per plant and silique weight were monitored to examine the effect of pollinators on the tested canola cultivars. The crop was harvested when most of the siliques darkened and the seeds inside siliques turned black (seed moisture ≤10%). These conditions prevent the shattering of seeds from the siliques. Samples were taken and kept in paper bags in the laboratory.
Twenty siliques were collected randomly from each caged and uncaged treatment plot in each replication. Seed numbers per silique were counted and 1000 seeds were randomly collected from the combined seeds and were weighed to determine the average seed weight. The number of siliques per plant was calculated by counting the number of siliques of 24 plants selected from the caged and uncaged plots of all replications. Seed yield bushels/acre was calculated following the Canola Council of Canada (2012) and then converted to kg/ha.
where:
Sq. = square inch, Ft = foot
2.3.2 Germination of seeds and oil content percentage
Seed germination was assessed by placing 50 seeds from each treatment in a plastic petri dish with double layers of Whatman filter paper #1 and incubated in a growth chamber at 20 ± 2 °C. On the sowing date, the filter paper was saturated with doubly distilled water and then kept moist for 5 days. Germination was scored as successful if the two cotyledons developed (Kevan and Eisikowitch, 1990). Also, the percentage of oil seed content was recorded. Crude oil percentage in the seeds were determined according to AOCS – American Oil Chemists Society (1985) using a Soxhlet apparatus and petroleum ether 40–60 °C as a solvent.
2.4 Statistical analysis
The data presented no deviation from normality accordingly with Shapiro-Wilk’s W test (Shapiro and Wilk, 1965). Data in a percentage form were subjected to arcsine transformation before the statistical analysis. The numbers of insect species per month and at day were statistically compared using Univariate analysis (GLM) and the multiple comparison were achieved using Tukey’s Honestly Significant Difference (Tukey HSD) test (Tukey, 1949). Unpaired T-test was used to compare the obtained results of each cultivar under caged and uncaged conditions at 5% level of probability (Student, 1908). Comparison among the cultivars, regardless the caged and uncaged plants was done by the Analysis of Variance (ANOVA) at 5% level of significance, while the multiple comparison were achieved using Tukey’s Honestly Significant Difference (Tukey HSD) test (Tukey, 1949). Data were depicted as means ± standard deviation to show the data deviation. The statistical analysis was performed using SAS software (SAS Institute 2004). The increase in the studied parameters due to pollination (uncaged plants) was expressed as follows:
3 Results
3.1 Activities of insect pollinators and visitors on canola flowers
3.1.1 Species and abundance
The list of insect pollinators and visitors collected from canola plants during the two successive growing seasons (2017/18 and 2018/19) is presented in Table 1. The insect pollinators and visitors were nine species belonging to nine genera, eight families and four orders. Hymenoptera comprised 83% of the total number of species, followed by Diptera (12%), Lepidoptera (3%), and Coleoptera (2%), respectively. Of the Hymenoptera, a single species was recorded for each family except Apidae, where two species were collected: A. mellifera L. and Xylocopa aestuans (L.). These two species and Andrena ovatula (Kirby) (Andrenidae) were the most abundant floral pollinators with an average of 58, 15 and 10%, respectively. The dipteran family Syrphidae was the most abundant of the flies with Syrphus corolla (F.) followed by Tabanidae and Muscidae. Other occasional families included butterfly family Pieridae (Pieris rapae (L.)) for Lepidoptera, Scarabaeidae (Tropinota squalida (Scopoli)), Coccinellidae (Coccinella undecimpunctata (L.)) visited flowers of canola during our study. All Hymenoptera pollinators were recorded as pollen and nectar foragers, whereas the other insects were recorded as only nectar foragers except the Coleoptera. *N – Nectar forager; *P – Pollen forager; C – Casual; **P – Pollinators; V – Visitors.
Order
Family
Species
Common name
Abundance(%)
Forage source
StatusP** - V
Hymenoptera83%
Apidae
Apis mellifera L.
Honey bee
58
N*+P*
√
Xylocopa aestuans L.
Carpenter bee
15
N + P
√
Andrenidae
Andrena ovatula Kirby
Sand bee
10
N + P
√
Coleoptera2%
Scarabaeidae
Tropinota squalida (Scop.)
Hairy rose beetle
1
C
√
Coccinellidae
Coccinella undecimpunctata L.
Eleven-spotted lady beetles
1
C
√
Diptera12%
Tabanidae
Tabanus sulcifrons Macquart.
Horse fly
4
N
√
Syrphidae
Syrphus corolla F.
Hover fly
6
N
√
Muscidae
Musca domestica L.
House fly
2
N
√
Lepidoptera3%
Pieridae
Pieris rapae (L.)
Cabbage white butterfly
3
N
√
3.1.2 Foraging activity of honey bees and other insect pollinators
The foraging activity of insect pollinators and visitors during canola flowering period in both season 2017/18 and 2018/19 are presented in Fig. 1 A&B. The differences between the two successive years considered statistically non-significant for each pollinator (p > 0.05). The activity peaks of honey bees were observed during the flowering seasons of canola at January 2018 (Fig. 1A) and January 2019 (Fig. 1B). However, the lowest activities were recorded during December 2017 and March 2018. In the second year (2018/19), the same trend of honey bee activity was observed with more foraging in January 2019 than in 2018 (Fig. 1B). The numbers of honey bees were statistically significant higher (p < 0.05) than the other insect species from December to February during the first season, and during January of the second season.
Changes in numbers of X. aestuans, A. ovatula, T. sulcifrons, S. corolla, P. rapae and A. mellifera in canola fields in Assiut region, Upper Egypt during flowering seasons of 2017/18 (A) and 2018/19 (B). Bars with different letters within each month indicate statistically significant differences (p < 0.05).
Foraging activity of insect pollinators during the flowering season of 2017/18 (Fig. 1A) and 2018/19 (Fig. 1B) considered statistically non-significant (p > 0.05). Not all species were present in the plots throughout the canola flowering period. The numbers of X. aestuans recorded in the second rank after A. mellifera during December, January and March of the two seasons while A. ovatula was in the second rank (F = 0.750, p < 0.05) during February of the two seasons.
The diurnal pattern of honey bees and other insect pollinators and visitor during the flowering period of canola in 2017/18 and 2018/19 are shown in Fig. 2 A&B. Statistical analysis (t-test) showed no difference between insect pollinators/h. at different observation times during two successive years (p > 0.05). A. mellifera initiated foraging activity at 9 am (24 individual/ h.) with a sharp increase at 11 am (111 individual/ h.) and a gradual decrease until 5 pm (8 individual/ h.) during the first season (2017/18) (Fig. 2A). T. sulcifrons and S. corolla were first observed about 9 am, reaching peak activity by 11 am and then sharply decreased by 5 pm (Fig. 2B). The foraging activity of X. aestuans at 9 am (F = 19.509, p < 0.05), A. mellifera at 11 am (F = 252.654, p < 0.05) and A. ovatula at 3 pm (F = 9.439, p < 0.05) were statistically considered the highest active species (Fig. 2 A&B).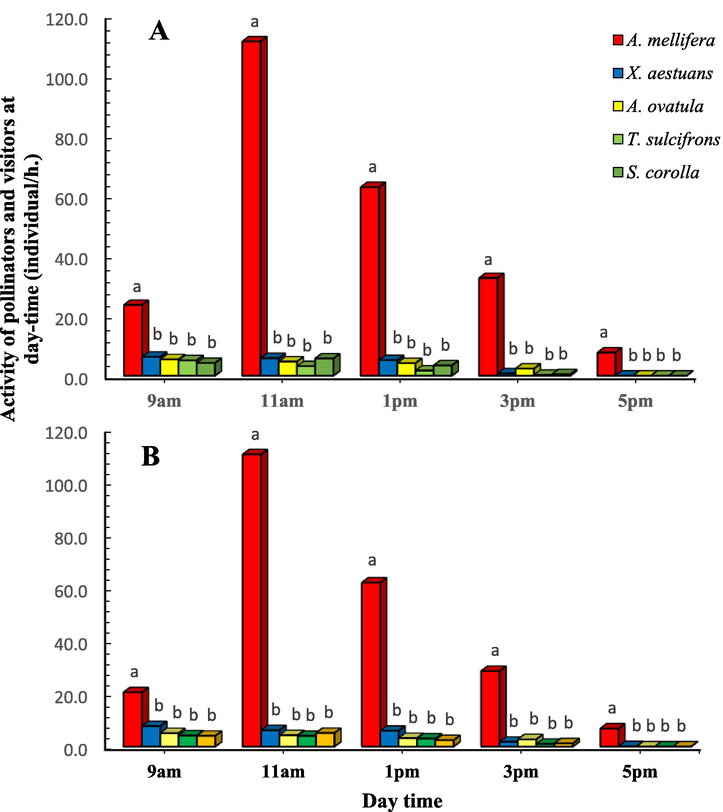
Diurnal patterns of X. aestuans, A. ovatula, T. sulcifrons, S. corolla and A. mellifera in canola fields in Assiut region, Upper Egypt during the flowering seasons of 2017/18 (A) and 2018/19 (B). Bars with different letters within each time indicate statistically significant differences (p < 0.05).
3.2 Effects of pollinators on canola yield
3.2.1 Seeds and silique set
The effects of insect pollinators on different yield characters of three canola cultivars during first season (2017/18) are presented in Table 2. Generally, in caged conditions, there is no statistically significant difference between the two successive years for all tested parameters in tested cultivars except for siliques weight and seed yield (p > 0.05). Pactol had the highest number of silique/plant, number of seeds/silique, and seed yield; an average of 285.5 siliques/plant, 22.63 seeds/silique, and 1492.4 kg/ha, respectively. However, Serw-4 ranked the first in silique weight (2.60 g) and weight of 1000 seeds (4.01 g), whereas Serw-6 had the lowest values of tested parameters. Parameters of the uncaged plants for tested canola cultivar were considered statistically significant higher than those of the caged plants. The average of increase percentage in silique no./plant due to pollinators (uncaged plants) was statistically significant higher in Pactol than the other two cultivars. Pactol had the lowest average of increase percentage in silique weight (g) and seed no./silique than the other cultivars. The average of increase percentage considered statistically non-significant among the three cultivars in 1000-seed weight (g) and seed yield (kg/ha.). T-test was used to compare each cultivar under caged and uncaged conditions (* denotes significant differences at p < 0.05). Tukey test was used to compare average increase% among cultivars (means followed by different letters denote significant differences at p < 0.05).
Parameters
Serw-4
Serw-6
Pactol
Uncaged plant
Caged Plant
Uncaged plant
Caged Plant
Uncaged plant
Caged Plant
Siliques No./plant(t value -p value)
142.9 ± 5.23*(3.95–0.007)
112.4 ± 9.93
87.1 ± 10.02*(3.47–0.013)
60.7 ± 8.62
285.5 ± 33.07*(7.37-<0.0001)
156.7 ± 15.24
Average increase %
21.34 ± 1.58b
30.31 ± 4.61b
45.11 ± 5.54a
Siliques weight (g.)(t value-p value)
2.60 ± 0.10*(4.16–0.006)
1.60 ± 0.08
2.52 ± 0.03*(5.10–0.002)
1.52 ± 0.08
2.48 ± 0.07*(4.29–0.005)
1.88 ± 0.03
Average increase %
38.46 ± 3.96a
39.68 ± 4.83a
24.19 ± 2.82b
Seeds No./silique(t value-p value)
21.81 ± 1.05*(4.01–0.007)
15.24 ± 0.96
19.84 ± 0.67*(4.74–0.003)
12.73 ± 0.64
22.63 ± 1.14*(3.03–0.023)
17.51 ± 1.23
Average increase %
30.12 ± 3.48a
35.84 ± 3.15a
22.62 ± 2.16b
1000 Seeds Weight (g.)(t value-p value)
4.01 ± 0.03*(7.10-<0.0001)
1.90 ± 0.05
3.43 ± 0.02*(8.33– <0.0001)
1.26 ± 0.03
3.30 ± 0.01*(9.15-<0.0001)
1.41 ± 0.01
Average increase %
52.62 ± 5.31a
63.27 ± 6.46a
57.27 ± 6.33a
Seed yield (kg. /ha.)(t value-p value)
874.8 ± 133.11*(17.92-<0.0001)
227.8 ± 88.52
414.9 ± 107.25*(8.83-<0.0001)
68.15 ± 28.44
1492.4 ± 325.14*(7.68-<0.0001)
270.8 ± 96.56
Average increase %
92.21 ± 8.40a
83.57 ± 7.65a
81.85 ± 8.84a
Parameters of the second season (2018/19) are presented in Table 3. A similar trend occurred, especially for seed yield per ha, but with an increment of seed production for all tested canola cultivars either caged or uncaged plants. The weight of 1000 seeds was 3.92 g for the uncaged treatment of Serw-4, compared to 3.37 and 3.31 g for the Serw-6 and canola Pactol, respectively. At the uncaged plots, Pactol canola cultivar exceeded Serw-4 and Serw-6 in the number of siliques per plant and seed number per silique, whereas Serw-4 was superior in silique weight and weight of 1000 seeds. Significant differences between parameters of the uncaged plants and the caged plants for the three cultivars according to t-test, except silique no./plant of cultivar Serw-6. Pactol had the significantly highest average of increase percentage in silique no./plant and the lowest silique weight (g) than the other two cultivars. No significant differences in the average of increase percentage of seed no./silique, 1000 seeds weight (g), and seed yield (kg/ha.) were detected among the three cultivars. T-test was used to compare each cultivar under caged and uncaged conditions (* denotes significant differences at p < 0.05). Tukey test was used to compare average increase% among cultivars (means followed by different letters denote significant differences at p < 0.05).
Parameters
Serw-4
Serw-6
Pactol
Uncaged plant
Caged Plant
Uncaged plant
Caged Plant
Uncaged plant
Caged Plant
Siliques No./plant(t value-p value)
156.2 ± 9.6*(2.94–0.026)
137.0 ± 8.87
94.50 ± 11.15(1.85–0.114)
82.75 ± 6.08
291.75 ± 27.55*(7.78-<0.0001)
169.25 ± 15.24
Average increase %
12.29 ± 1.25b
12.43 ± 1.78b
42.00 ± 3.12a
Siliques weight (g.)(t value-p value)
2.62 ± 0.07*(13.62- <0.0001)
1.68 ± 0.05
2.58 ± 0.03*(9.82-<0.0001)
1.55 ± 0.11
2.54 ± 0.05*(11.61-<0.0001)
1.84 ± 0.03
Average increase %
35.88 ± 4.00ab
39.92 ± 3.97a
27.56 ± 3.60b
Seeds No./silique(t value-p value)
23.83 ± 1.14*(10.84- <0.0001)
15.68 ± 0.98
20.68 ± 0.83*(10.45-<0.0001)
14.05 ± 0.96
24.02 ± 1.57*(7.21-<0.0001)
17.48 ± 0.91
Average increase %
34.20 ± 3.45a
32.06 ± 3.86a
27.23 ± 3.05a
1000 Seeds Weight (g.)(t value-p value)
3.92 ± 0.03*(13.72- <0.0001)
1.91 ± 0.01
3.37 ± 0.02*(22.96-<0.0001)
1.36 ± 0.02
3.31 ± 0.02*(19.19-<0.0001)
1.32 ± 0.01
Average increase %
51.28 ± 5.74a
59.64 ± 5.06a
60.12 ± 5.89a
Seed yield (kg. /ha.)(t value-p value)
1021.4 ± 336.14*(5.99–0.001)
273.3 ± 110.04
461.0 ± 125.02*(3.27–0.017)
110.7 ± 23.18
1623.4 ± 377.32*(5.40–0.002)
287.2 ± 95.21
Average increase %
73.24 ± 7.08a
75.99 ± 7.85a
82.31 ± 7.45a
As shown in Table 4, the pollinators of uncaged plants significantly increased the measured parameters than caged plants during 2017/18 except for siliques weight. The same trend was observed in 2018/19 for all parameters except siliques weight and seed no./silique. The average of increase percentage in silique no./plant was only statistically significant higher in season 2017/18 than 2018/19 while no significant differences between the two seasons were found for the average of increase percentage of the other parameters. T-test was used to compare each cultivar under caged and uncaged conditions (* denotes significant differences at p < 0.05). Average increase % was compared between 2017/18 and 2018/19 using t-test (* denotes significant differences at p < 0.05).
Parameters
2017/18
2018/19
Uncaged plant
Caged Plant
Uncaged plant
Caged Plant
Siliques No./plant(t value-p value)
171.83 ± 39.17*(6.30–0.001)
109.93 ± 24.29
180.81 ± 39.17*(5.09–0.002)
129.65 ± 28.53
Average increase %
36.02 ± 2.74*
28.29 ± 2.23
Siliques weight (g.)(t value-p value)
2.53 ± 0.04(1.84–0.114)
1.67 ± 0.01
2.58 ± 0.09(1.79–0.123)
1.69 ± 0.09
Average increase %
33.99 ± 2.18
34.50 ± 2.68
Seeds No./silique(t value-p value)
21.43 ± 1.49*(3.47–0.013)
15.16 ± 2.22
22.84 ± 1.49(2.15–0.074)
15.73 ± 1.70
Average increase %
29.26 ± 1.77
31.13 ± 2.02
1000 Seeds Weight (g.)(t value-p value)
3.58 ± 0.04*(4.69–0.003)
1.52 ± 0.06
3.53 ± 0.04*(3.62–0.011)
1.53 ± 0.01
Average increase %
57.54 ± 2.53
56.66 ± 2.47
Seed yield (kg. / ha.)(t value-p value)
927.37 ± 201.93*(9.05-<0.0001)
188.92 ± 66.84
1035.27 ± 252.1*(16.06-<0.0001)
223.72 ± 90.32
Average increase %
79.63 ± 3.85
78.39 ± 3.37
3.2.2 Germination of seeds and oil content percentage
Seed germination and oil content percentage of the tested canola cultivars of this study is presented as the averages of the two successive years 2017/18 and 2018/19 in Table 5. Seed germination was significantly higher in uncaged plants than in caged one for all tested cultivars. Maximum values of seed germination were recorded for Serw-4 (86%) followed by Pactol and Serw-6 cultivars with an average of 80% and 40%, respectively. The average of increase percentage in seed germination due to uncaging conditions was statistically significant higher in Serw-6 and Serw-4 than Pactol. The oil content of seeds (%) was higher in uncaged plants than in caged plants for Serw-4, and considered statistically non-significant for the other cultivars. Serw-4 significantly was the highest average of increase percentage in oil content of seed (%) than the other cultivars. T-test was used to compare each cultivar under caged and uncaged conditions (* denotes significant differences at p < 0.05). Tukey test was used to compare average increase% among cultivars (means followed by different letters denote significant differences at p < 0.05).
Parameters
Serw-4
Serw-6
Pactol
Uncaged plant
Caged Plant
Uncaged plant
Caged Plant
Uncaged plant
Caged Plant
Seeds germination (%)(t value-p value)
86.25 ± 2.31(1.88–0.108)
78.31 ± 1.47
40.41 ± 1.04(1.18–0.28)
35.51 ± 0.94
80.22 ± 1.95(1.04–0.336)
75.31 ± 1.25
Average increase %
9.21 ± 1.21ab
12.13 ± 1.31a
6.12 ± 1.01b
Oil content of seed (%)(t value-p value)
51.4 ± 2.27*(3.72–0.01)
41.38 ± 2.03
39.23 ± 1.31(1.05–0.33)
35.35 ± 1.74
44.34 ± 2.04(1.47–0.191)
38.46 ± 1.96
Average increase %
19.49 ± 2.03a
9.89 ± 1.64b
13.26 ± 1.83b
4 Discussion
4.1 Species abundance of insect pollinators
Hymenoptera included the main pollinators (83%) of B. napus especially honey bees, which recorded the most abundant pollinator (58%) of canola plants. Several studies have also shown honey bees as the most important pollinator for canola (Sushil et al., 2013; CHAMBÓ et al., 2014). In contrast, Kamel et al. (2015) in different geographical area of Egypt, have shown that wild bees (Colletes lacunatus Dours) were more abundant pollinator than honey bees that was absent in the present study. Also, the same authors recorded the highest foraging activity peak for honey bee from 1:00 to 3:00 pm which in reverse to our finding from 9:00 to 11:00 am. So, Pollinator abundance and composition vary with geographical area, latitude, and time (Ollerton and Cranmer, 2002).
All species of Hymenoptera were observed as both pollen and nectar foragers, while species of the other orders were only nectar foragers or casual pollinators (Ali et al., 2011). The present results supported by the observation of Abrol, (2007) in which he stated that attractiveness and preference for canola by A. mellifera can be attributed to the higher volume of flower nectar with high sugar concentrations. In this study, the floral rich location around canola plots plays an important role in the abundance of pollinators. Sharma and Reddy (2020) stated that increasing plant biodiversity near canola fields to provide habitat and food resources can also improve bee population size and health. In addition, the nearby apiary from our study location (500-meter distance from tested plots) which included 20 colonies ensured sufficient bee abundance. Sabbahi et al., (2005) suggested that three colonies of honey bees should be used for each hectare of canola for the best results in terms of productivity.
In the absence condition of the honey bees, wild solitary bees are the major pollinators of canola. They increase the yield by enhancing the plant to set seeds earlier and allowing for easier harvesting (Halinski et al., 2018; Sharma and Reddy, 2020). The present results illustrated that A. ovatula and X. aestuans were the second and the third most abundant pollinators after honey bees. Thus, the presence of the native bee pollinators (A. ovatula and X. aestuans) may compensate the absence of honey bees. The hoverflies composed 6% of insect pollinators on studied canola plots which suggests that they might play a complementary role with bees as pollinators of oilseed rape. This result agrees with Jauker and Wolters (2008) who stated that hoverflies are the most efficient anthophilous dipterans of canola.
4.2 Effects of pollinators on canola yield
The field experiments indicated statistically significant differences among tested canola cultivars either uncaged or caged plants for all quantitative and qualitative yield parameters. Numerous studies have confirmed that high densities of pollinators (Steffan-Dewenter, 2003; Ali et al., 2011) enhance the quantity and quality of canola yield compared to non-pollinated plants. Although, canola is a self-pollinating crop, and it does not produce large numbers of mature siliques in the absence of insect pollination (Sabbahi et al., 2006).
In this study, canola Pactol came in the first ranked in silique no./plant which described by (Angadi et al., 2003) as the most important yield component in rapeseed canola production and increases with the number of primary and secondary branches. Also, the same cultivar recorded the highest seed no./silique, and seed yield kg/ha. On the other hand, Serw-4 was superior in qualitative parameters as compared to Pactol or Serw-6 including seed germination and seed oil content %. In sandy soil in Northern Egypt, canola Pactol was the best in seed oil content percentage and Serw 4 showed superiority in seed yield (Mekki, 2013). These inconsistencies in yield parameters between different geographical regions in Egypt beyond a reasonable doubt emphasizes that canola highly responses to soil type and climatic factors.
The obtained results showed that germinability of the seeds for all tested canola cultivar in uncaged plants were statistically significant higher than caged plants especially for Serw-4. In the same line Kevan and Eisikowitch, (1990) conclude that cross-pollination by insects increases the germinability of the resulting seeds. Moreover, Hozayn and EL-Mahdy (2017) recorded large variance between canola cultivars in seed germination with superiority for Serw-4. Weight of 1000 seeds in the uncaged plants of Pactol cultivar (3.31 g) was smaller than those of Serw-4 (3.92 g). Manning and Wallis (2005) concluded that the lower seed weight is due to a higher number of fertile siliques, which producing more seeds but lower in individual weight and size. Statistically, the highest seed oil content % was recorded by cultivar Serw-4. The same cultivar was planted in North of Egypt by Hozayn and EL-Mahdy (2017) in different edaphic and climatic conditions and also gives a reasonable seed oil content %.
Response and productivity of different canola cultivars were assessed under different edaphic (Mekki, 2013) and climatic (Pokharel et al., 2020) stresses. The latter stated that canola hybrids are better suited to regions experiencing heat stress. Moreover, traditional cultivation systems have a vital role in the production for this plant (Halinski et al., 2020). These studies inspired us that further investigations about soil quality, heat stress and traditional cultivation systems are required to improve and enhance canola production.
5 Conclusion
A. mellifera is the most efficient pollinator for enhancing canola crop yield in Assiut region, Upper Egypt. Serw-4 gave a reasonable seed oil content, seed yield and seed germination percentage. This cultivar is promising for a large-scale production of canola edible oil and for increasing canola yields in this region. Hence, the expansion of cultivated areas from this canola cultivar ensured maximizing the edible oil production to meet the increasing demands.
Acknowledgement
Author thanks the Agriculture Research Center for providing the seeds of tested canola cultivars. Special thanks are extended to Prof. Boris C. Kondratieff and Dr. Hossam Abou-Sharaa for proofreading the manuscript.
Conflict of interest
In accordance with Elsevier policy and my ethical obligation as a researcher, i am reporting that I don’t have a financial and/or business interests. I receive funding from Bee Research Department, Plant Protection Research Institute, Agricultural Research Centre, Dokki, Giza, Egypt.
References
- Foraging behavior of Apis mellifera L. and Apis cerana F. as determined by the energetics of nectar production in different cultivars of Brassica campestris var. toria. J. Apicultural Sci.. 2007;51(2):19-24.
- [Google Scholar]
- In search of the best pollinators for canola (Brassica napus L.) production in Pakistan. Appl. Entomol. Zool.. 2011;46(3):353-361.
- [Google Scholar]
- Yield adjustment by canola grown at different plant populations under semiarid conditions. Crop Sci.. 2003;43(4):1358-1366.
- [Google Scholar]
- Official and Tentative Methods (third ed.). Chicago: EUA; 1985.
- Insect pollination enhances seed yield, quality, and market value in oilseed rape. Oecologia. 2012;169(4):1025-1032.
- [Google Scholar]
- An Introduction to the Study of Insects (sixth ed.). Philadelphia: Saunders College Publishing; 1989. 875pp
- Canola council of Canada. 2012. https://www.canolawatch.org/2012/08/15/yield-estimate-before-harvest/ (accessed 25 October 2020).
- Pollination of Rapeseed (Brassica napus) by Africanized Honeybees (Hymenoptera: Apidae) on Two Sowing Dates. An. Acad. Bras. Ciênc.. 2014;86(4):2087-2100.
- [Google Scholar]
- Downey, R., Pawlowski, S., Mcansh, J. 1970. Rapeseed – Canada’s Cinderella Crop. Rapeseed Association of Canada; Publication No. 32.
- Field studies of soil invertebrate (second ed.). Moscow: Vishia Shkoola Press; 1971. p. :424.
- Genetic evaluation of new promising mutant lines of canola (Brassica napus l.) under three generations and two different locations. Zagazig J. Agric. Res.. 2019;46(1):143-155.
- [Google Scholar]
- The pollination of oilseed rape (Brassica napus) and the behaviour of bees on the crop. J. Agric. Sci.. 1968;71(1):91-94.
- [Google Scholar]
- Influence of wild bee diversity on canola crop yields. Sociobiology. 2018;65(4):751.
- [CrossRef] [Google Scholar]
- Forest fragments and natural vegetation patches within crop fields contribute to higher oilseed rape yields in Brazil. Agric. Syst.. 2020;180(102768):1-10.
- [CrossRef] [Google Scholar]
- Evaluation of Yield and oil quality traits of some exotic canola (Brassica napus L.) genotypes grown under sandy soil in Egypt. Middle East J. Appl. Sci.. 2017;7(4):1148-1156.
- [Google Scholar]
- Hover flies are efficient pollinators of oilseed rape. Oecologia. 2008;156(4):819-823.
- [Google Scholar]
- Diversity of insect pollinators with reference to their impact on yield production of canola (Brassica napus L.) in Ismailia, Egypt. Pesticidi i fitomedicina. 2015;30(3):161-168.
- [Google Scholar]
- The effects of insect pollination on canola (Brassica napus L. cv. OAC Triton) seed germination. Euphytica. 1990;45(1):39-41.
- [CrossRef] [Google Scholar]
- Seed yields in canola (Brassica napus cv. Karoo) depend on the distance of plants from honeybee apiaries. Aust. J. Exp. Agric.. 2005;45(10):1307-1313.
- [CrossRef] [Google Scholar]
- Yield and quality traits of some canola varieties grown in newly reclaimed sandy soils in Egypt. World Appl. Sci. J.. 2013;25(2):258-263.
- [CrossRef] [Google Scholar]
- Latitudinal trends in plant-pollinator interactions: are tropical plants more specialised? Oikos. 2002;98(2):340-350.
- [Google Scholar]
- Effect of honey bees pollination on seed setting, yield and quality characteristics of rapeseed (Brassica napus oleifera) Indian J. Agric. Sci.. 2008;78(8):680-683.
- [Google Scholar]
- High night‐time temperature during flowering and pod filling affects flower opening, yield and seed fatty acid composition in canola. J. Agro. Crop Sci.. 2020;206(5):579-596.
- [Google Scholar]
- Apis mellifera (Hymenoptera: Apidae) as a potential Brassica napus pollinator (cv. Hyola 432) (Brassicaceae), in Southern Brazil. Braz. J. Biol.. 2010;70(4):1075-1081.
- [Google Scholar]
- Influence of honey bee (Hymenopetra: Apidae) density on the production of canola (Cruciferae: Brassicaceae) J. Econ. Entomol.. 2005;98(2):367-372.
- [CrossRef] [Google Scholar]
- Does the honeybee (Hymenoptera: Apidae) reduce the blooming period of canola? J. Agron. Crop Sci.. 2006;192(3):233-237.
- [Google Scholar]
- The SAS System Version 9.1.3. Cary, NC: SAS Institute; 2004.
- An analysis of variance test for normality (complete samples) Biometrika. 1965;52(3–4):591-611.
- [Google Scholar]
- IPM and pollinator protection in canola production in the USA. In: Integrative Biological Control. Cham: Springer; 2020. p. :165-176.
- [CrossRef] [Google Scholar]
- Seed set of male-sterile and male-fertile oilseed rape (Brassica napus) in relation to pollinator density. Apidologie. 2003;34(3):227-235.
- [Google Scholar]
- Enhancing seed production of three Brassica vegetables by honey bee pollination in north-western Himalayas of India. Univ. J. Agric. Res.. 2013;1(3):49-53.
- [Google Scholar]
- Comparing of individual means in the analysis of variance. Biometrics. 1949;5:99-l14.
- [Google Scholar]
- The bee community and its relationship to canola seed production in homogenous agricultural areas. J. Poll. Ecology. 2014;12(3):15-21.
- [Google Scholar]


