

Translate this page into:
Plant-mediated biosynthesis of zein–pectin nanoparticle: Preparation, characterization and in vitro drug release study
⁎Corresponding author. sudheeshs@knruty.ac.in (Sudheesh Sudhakaran)
-
Received: ,
Accepted: ,
This article was originally published by Elsevier and was migrated to Scientific Scholar after the change of Publisher.
Peer review under responsibility of King Saud University.
Abstract
Plant mediated biosynthesis of zein–pectin nanoparticles by sonication method. Characterization studies by means of SEM, FT-IR, TGA and DSC. The studies revealed that they are amorphous, spherical in shape with a size ranging from 150 to 200 nm diameters and FT-IR characterization confirmed the incorporation of all components in nanoparticles. The thermogravimetric and differential scanning calorimetric studies revealed that the particles are stable upto120 °C. Sustained drug release was observed in in vitro drug release studies at intestinal pH and was found to follow zero order and Higuchi mechanisms.
Abstract
The present study was designed to investigate the potential of the biopolymeric nanoparticle, formulated solely from natural resources using zein from maize as the core, pectin from ivy gourd as shell and ethyl acetate fraction of the plant Mimosa pudica as the drug. The plant-mediated biosynthesis of the biopolymeric nanoparticle was done by sonication method. The morphology and size of nanoparticles were characterized by Scanning Electron Microscopy and the thermal stability was studied with the aid of Thermogravimetric Analysis and Differential Scanning Calorimetric studies. An in vitro drug release study was conducted to study the release of the plant extract from the nanoparticle and the mechanism of release was deduced by substituting the values to various mathematical models. The SEM investigation of developed nanoparticles revealed that the particles are amorphous, spherical in shape with a size ranging from 150 to 200 nm diameters. The FT-IR characterization study confirmed the incorporation of all the components in Nanoparticle. The investigation on thermal stability was achieved by thermogravimetric and differential scanning calorimetric studies and the results revealed that the particles are stable upto120 °C. Sustained drug release was observed in in vitro drug release studies at intestinal pH. To establish the mechanism of release the data were substituted to various mathematical models and was found to follow zero order and Higuchi mechanisms.
Keywords
Anti-diabetic
Nanoparticle
Mimosa pudica
Zein
Pectin

1 Introduction
Despite the fact that plants are exemplary sources of drugs which are used as traditional medicine and are considered safe, they are more biodegradable with less drug resistance when compared to synthetic drugs (Chandran et al., 2016; Jose et al., 2016). The bioavailability and in vivo stability of plant-derived compounds may be very low (Merrell et al., 2009). Furthermore, the therapeutic efficacy of most drugs is often confined by their possibility to reach the site of action (Tiyaboonchai, 2003). Besides the chemical therapeutic agents, nanoencapsulation overcome susceptibility, improves the stability, achieve targeted delivery and controlled release of bioactive compounds from natural sources to the specific site which are otherwise poorly bioavailable because of weak absorption or rapid elimination (Dhana Lekshmi et al., 2010; Ribnicky et al., 2009). Nanoparticles have enormous potential as a drug delivery system as they are taken up by the cells more efficiently than larger macromolecules (Suri et al., 2007). Nowadays biopolymeric nanoparticles made from natural biodegradable polymers have evoked great importance as they display interesting features like low toxicity, biodegradability and biocompatibility. The nanoparticles synthesized by the colligation of chemical constituents of plants impart stability to the system, obstruct aggregation and enhances biological interactions by interjecting biocompatible functionalities. Natural polymers like albumin, zein, pectin, chitosan, alginate, cellulose and collagen are employed for this purpose (Dhanya et al., 2012; Dorosti and Jamshidi, 2016; Li et al., 2008; Müller et al., 2011). Silver phytonanoparticle (Swarnalatha et al., 2012), gold nanoparticles conjugated with plant extract (Barathmanikanth et al., 2010), zinc oxide nanoparticles (Umrani and Paknikar, 2015) insulin incorporated chitosan nanoparticles (Prusty and Sahu, 2013) etc have been reported earlier. The plant Mimosa pudica, commonly known as ‘Touch me not plant' is a creeping annual or perennial herb is known for its medicinal properties. The plant is rich in phytochemicals such as a non-protein amino acid (mimosine), steroids, alkaloids, terpenes, tannins, fatty acids, flavonoids and cardiac glycosyl flavones. All the parts of plants are considered to have medicinal properties and are used in the traditional health care systems such as Ayurveda, Siddha and Unani. It is used in the treatment of hydrocele, dysentery, skin disorders, inflammation, uterine disorders, urinary infections, burning sensations, smallpox and fever (Doss et al., 2011). The plant is also reported to have antiproliferative and anticancer activity (Jose et al., 2014; Sutar et al., 2009). Hypoglycaemic activity of leaves and choorna (dried powder) of Mimosa pudica has been reported earlier (Chen et al., 2005; Viswanathan et al., 2013). In this context, we investigated the potential of zein–pectin nanoparticle as a drug carrier for Mimosa pudica extract and its release from the nanoparticle. The synthesized nanoparticles have been characterized by SEM, FT-IR spectroscopy, Differential Scanning Calorimetry and Thermogravimetric analysis. The drug release mechanism of the nanoparticles was deduced by substituting the values to various mathematical models.
2 Materials and methods
2.1 Preparation of plant extract
The shade dried plants were powdered mechanically and were stored in an airtight container. About 100 g of dried plant powder was subjected to hot extraction with 30 mL of ethyl acetate. The extract was concentrated to dryness under a controlled temperature of 70–80 °C. The percentage yield was found to be 0.6%. The extract was preserved in a desiccator until further use.
2.2 Isolation of pectin from Coccinia indica
250 g of Ivy gourd fruit was macerated and boiled in 750 mL of acidified water with HCl (maintained at pH 2.3) for 30 min. It was filtered hot and cooled rapidly to room temperature (30 °C) by keeping it in a water bath. Cooled extract was then treated with chilled 95% ethanol. The precipitate formed was filtered using Whatmann No.1 filter paper, washed repeatedly with 95% ethanol and dried.
2.3 Plant-mediated biosynthesis of a core-shell nanoparticle
Encapsulation of the extract into the core-shell zein–pectin nanoparticle was done as reported earlier (Dhanya et al., 2012). 1 mL of extract in 80% ethanol and O.25 g zein dissolved in 3.75 mL 80% ethanol was added to 0.001% silicone oil solution kept under ultrasonication at 150 V. After 10 min 4 mL pectin solution was added to the mixture drop by drop and continued sonication for another 5 min. The mixture was then frozen and lyophilized. The lyophilized powder was then characterized.
2.4 Nanoparticle recovery and encapsulation efficiency
Nanoparticle yield or recovery (Dhana lekshmi et al., 2010) was calculated using equation 1.
Encapsulation efficiency was delineated by calculating the drug entrapped and drug content in zein–pectin nanoparticles by Eqs. (2) and (3).
The total amount of extract is the added ethyl acetate extract during nanoparticle preparation. Amount of free extract was figured by filtering the non encapsulated extract from the total mixture. The absorbance of the filtrate was measured at 344 nm using a UV–Visible spectrophotometer. The amount of free extract was calculated by an appropriate calibration curve of free extract in 80% ethanol.
2.5 Characterization of encapsulated nanoparticles
The shape, size and surface morphology of nanoparticles were investigated by scanning electron microscope (SEM) (Hitachi SU 6600, Japan). The nanoparticle surfaces were vacuum sputter coated with gold for allowing the SEM visualization. The diameters of nanoparticles were determined. The particle size and polydispersity index was also studied with the aid of Zetasizer (LitesizerTM Particle analyzer, Anton Paar GmbH). FT-IR analysis was carried out to study the change in chemical structure and to confirm the encapsulation of the extract in nanoparticles by using the instrument Model 8400S, Shimadzu, Japan. The absorption maxima of the extract and nanoparticles were studied using UV–Visible spectroscopy (Shimadzu, UV–Visible spectrophotometer Pharmaspec 1700). Temperature stability of the extract encapsulated nanoparticles were analyzed by means of thermogravimetric and differential scanning calorimetric analysis (DSC). Thermogravimetric analysis of the sample was performed on a Perkin Elmer, STA 6000, U.S.A. TGA-DTA analyzer. The heating rate was at 20 °C min−1 in a temperature range from 40 to 730 °C. DSC analysis was carried out on a Calorimeter Mettler Toledo DSC 822e, U.S.A. at a heating rate of 10 °C min−1 and temperature range 30–300 °C.
2.6 In vitro release study and evaluation of its kinetics
Among the different methods used to assess the release mechanism from nanoparticles, dialysis method (DM) is the most versatile one (Luo et al., 2015). The freeze-dried samples were then subjected to in vitro release kinetics studies at intestinal pH, using phosphate buffer of pH 6.8. It was carried out in a dialysis tube D- Tube Dialyzer with a cut off 12,000 KD (Calbiochem) where 2 mL nanoparticle suspension in buffer was added and was suspended to a beaker containing 100 mL phosphate buffer maintained at 37 °C, under constant stirring at 100 rpm. The drug release was assessed by intermittent sampling of 3 mL buffer and replacing with fresh buffer. The amount of extract released in buffer solution was quantified by UV spectrophotometer at 344 nm (Gallagher et al., 2003).
The release mechanism was analyzed with the mathematical models zero-order kinetics, first-order kinetics, Higuchi model kinetic applying the Eqs. (4)–(6) respectively.
The plots Qt vs. t, ln (Q0 – Qt) vs. t, Qt vs. t1/2 were made for zero order, first order and Higuchi kinetics respectively, where Qt is the percentage of drug released at time t, Q0 is the initial amount of drug in the formulation and K0, K1 and Kh are the constants (Dhana lekshmi et al., 2010).
The mechanism of drug release was confirmed by fitting the first 60% of drug release in Korsmeyer –Peppas model Eq. (7).
2.7 Statistical analysis
All experiments were done in triplicates. The results obtained were analyzed by one-way analysis of variance using Graph Pad. To assess the statistical significance, the P value was set at P < 0.05.
3 Results and discussion
3.1 Morphological analysis
The deliberate analysis of nanoparticles by SEM confirms its spherical nature and its smooth surface, but the size distribution found to be varying (Fig. 1). The average sizes of nanoparticles were approximately 156–201 nm. This result was further confirmed with particle size determination by Zetasizer where the nanoparticle size distribution was found to be in the range 98–188 nm (Fig. 2). The polydispersity index was 0.30 which lies within the normal range 0 (for highly uniform particles) and 1 (for highly polydisperse particles) (Danaei et al., 2018; ISO 22412, 2008). Hence we can assume that the nanoparticles are non-uniform but monodisperse in nature. Miscibility and viscosity of the parent solutions affect the surface characteristics of the nanoparticles formed (Müller et al., 2011).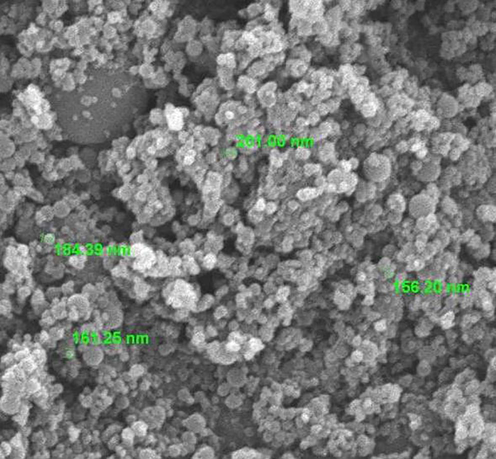
SEM image of Nanoparticles.
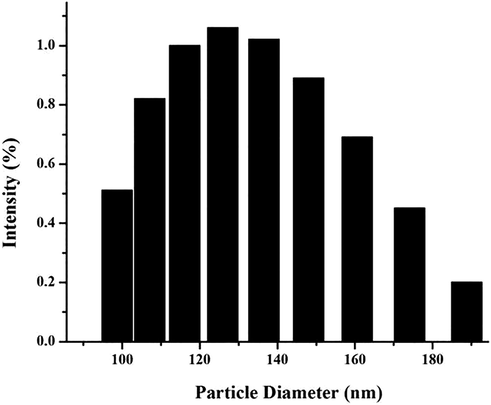
Particle size distribution of zein–pectin nanoparticles.
3.2 Nanoparticle recovery and encapsulation efficiency
The yield or the mass of the encapsulated nanoparticles were 0.1508 g. Nanoparticle recovery was found to be 96.27 ± 0.279%. The percentage of drug entrapment was observed to be effective with 67.86 ± 1.422% and the drug content was found to be 9.01 ± 0.199%.
3.3 Spectral analysis
3.3.1 FT-IR analysis
Fig. 3 depict the FT-IR multispectra of ethyl acetate extract of Mimosa pudica and Mimosa pudica extract encapsulated nanoparticles. The FT- IR results confirm the encapsulation of the extract into the nanoparticle. The characteristic bands observed in the FT- IR spectrum of the extract are 3386.6 cm−1, 2853.2 cm−1, 1738.8 cm−1, 1561 cm−1, 1458.6 cm−1, 1373.9 cm−1 and 719.5 cm−1. And the characteristic bands observed in the FT- IR spectrum of the Mimosa pudica extract encapsulated nanoparticles are 3442.5 cm−1, 1729.5 cm−1, 1608.5 cm−1, 1514.5 cm−1 and 1308.8 cm−1. On comparison of the –NH vibrations in the FT-IR spectrum of extract and Mimosa pudica extract encapsulated nanoparticles, it was found that the value shifted from 3386.6 cm−1 to 3442.5 cm−1 which indicates that the –NH band is interrupted due to the encapsulation of Mimosa pudica extract. Correspondingly slight changes are also appeared for other IR bands such as carbonyl groups. It is also evident from the spectrum of Mimosa pudica extract encapsulated nanoparticles, that the encapsulation of the extract has taken place which indicates the difference in the intensities and slight changes in the band frequencies of 1308.8 cm−1, 1514.5 cm−1 to 1373.9 cm−1 and 1561 cm−1 respectively. This indicates that the IR spectra clearly describe the encapsulation of extract (Srichamroen and Chavasit, 2011).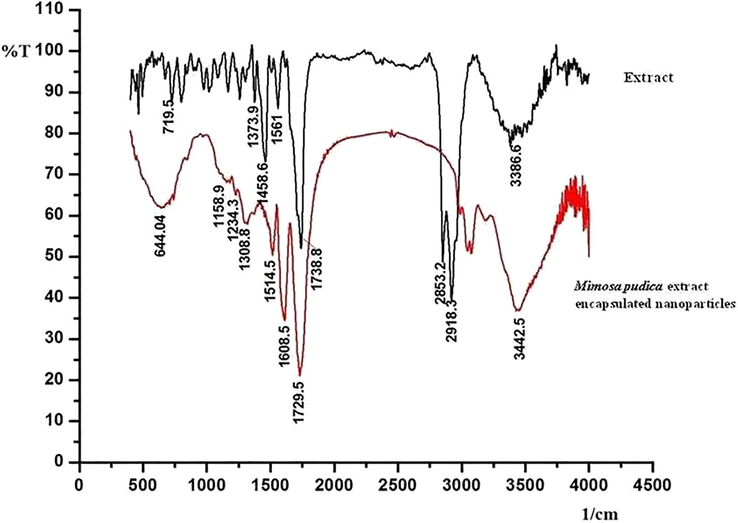
FT-IR multispectra of Mimosa pudica extract and Mimosa pudica extract encapsulated nanoparticles.
3.3.2 UV–Visible spectral analysis
UV–Vis (Ethanol) λmax’ s of zein–pectin nanoparticle without encapsulation was only at 280 nm. λmax’s of Mimosa pudica extract encapsulated nanoparticles were 280 nm and 344 nm (Fig. 4). It has been reported that the plant Mimosa pudica contains the flavonoid ‘Apigenin’ and many of its derivatives are absorbed at λmax of 344 nm (Alali et al., 2008; Ijaz et al., 2019). The absorption bands observed at 344 nm in the UV–Visible spectrum of Mimosa pudica extract encapsulated nanoparticles were absent in the spectrum of the Zein–pectin nanoparticles without encapsulation of extract, which indicates that the absorption at 344 nm is due to the presence of extract. Hence the λmax of the crude extract at 344 nm was set as the λmax for in vitro release studies (Silverstein et al., 2005).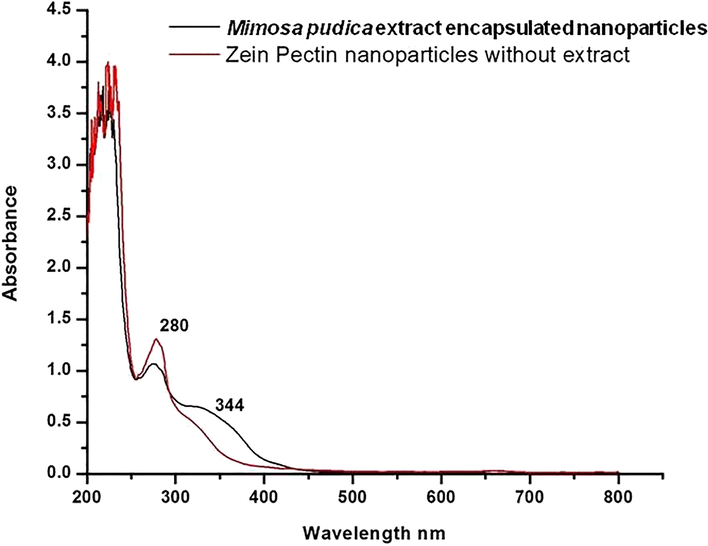
UV–Visible multispectra of Zein–pectin nanoparticles and Mimosa pudica extract encapsulated nanoparticles.
3.3.3 Temperature stability analysis
The Thermal profile of extract encapsulated zein–pectin nanoparticle was evaluated by means of Differential Scanning Calorimetry (Fig. 5) and Thermogravimetric analysis (Fig. 6).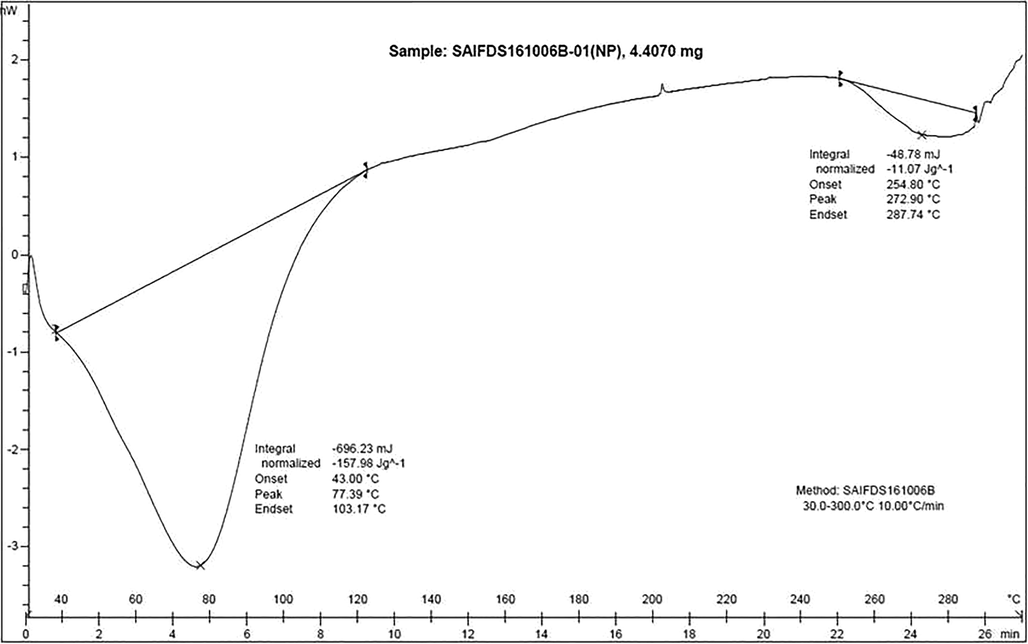
Differential Scanning Calorimetry Termogram.
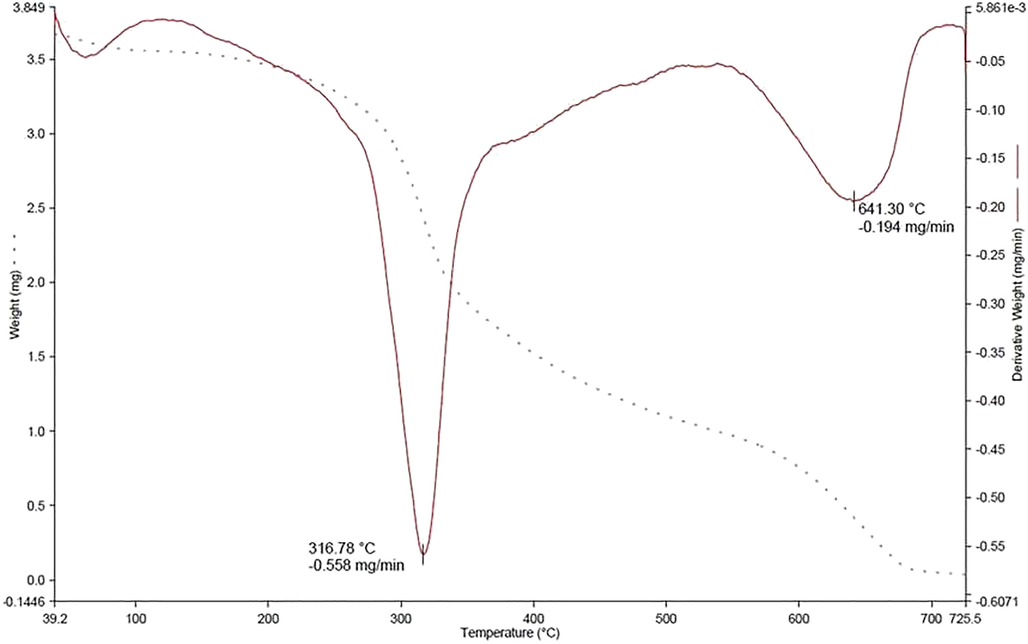
Thermogravimetric analysis thermogram.
In the thermogravimetric analysis, the first phase transfer occurs at 80 °C may be due to the evaporation of the water-ethanol mixture used as a solvent absorbed by the molecules during the process. The weight loss at 316 °C is due to the removal of pectin with an approximate of 48% loss. It is a single decomposition with a sharp loss indicating the maximum number of zein nanoparticles coated with pectin. Towards the end of the decomposition there exist small curves in DTA indicating the coating of pectin is not even. At around 641 °C a wide peak in the DTA indicates the slow decomposition of zein along with extract and the TGA graph reaches to 0% of substance.
In the DSC curve, the peak at 77.39 °C depicts the release of pectin from zein where a morphological change occurs. Since it is starting from 43 °C and ending at 103 °C, we can assume that the coating of pectin on zein nanoparticles is not even and the release of the same taken longtime for a duration of approximately 60 °C. Peak at 272 °C indicate the melting of zein and extract which also ranges for 33 °C indicating the loss of the final compound is not sharp but leads to slow melting of both extract and zein.
3.3.4 In vitro drug release and kinetics study
The in vitro drug release of ethyl acetate extract from nanoparticle is shown in Fig. 7. The quantity of drug released from the encapsulated nanoparticles is 12.87% at the 8th hour. The result indicates the sustained drug release properties of the zein–pectin nanoparticles for a prolonged time period. The in vitro release data were substituted in zero order, first order and Higuchi mathematical models to determine the pattern of drug release. From the slope of the plots, release constants were calculated and the regression coefficient r2 was determined. The results indicated the highest r2 value for zero order kinetics (r2 = 0.991) and hence explains in vitro release kinetics at its best. It was followed by Higuchi equation (r2 = 0.983) and then the first order (r2 = 0.979). The drug release mechanism was further analyzed by using Korsmeyer- Peppas model. The rate constant and release exponent ‘n’, was calculated up to first 60% of drug release and the ‘n’ value defines the release mechanism which was found to be 0.44. In this experiment, the drug release kinetics obeys zero-order kinetics and Higuchi kinetics, which indicates that the concentration was nearly independent of drug release and the release can be a diffusion mechanism from an insoluble matrix. The release data when further analyzed by Korsmeyer Peppas model where the n value was 0.44. The n values between 0.43 and 0.85 indicate a diffusion-based release or swelling behaviour (Anomalous transport) of the spherical nanoparticles (Pasparakis & Bouropoulos, 2006). Hence it can be concluded that the release of ethyl acetate extract from the nanoparticles is by zero order and diffusion mechanism.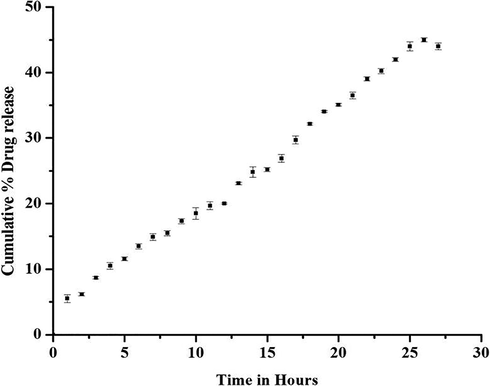
The cumulative drug release curves of extract from nanoparticles at pH 6.8 at 37 ± 0.5 °C.
4 Conclusion
The present preliminary study foresees the utilization of natural polymers and a herbal extract for the formulation of nano-drug. The investigation foregrounds the plant-mediated biosynthesis of biopolymeric nanoparticles which demonstrates good thermal stability and sustained drug release. In vitro, drug release studies conclude that the developed nanoparticles can be used as a drug delivery system since sustained drug release is observed. As the nanoparticles are prepared solely using natural polymers where zein is obtained from maize and pectin from the fruit of ivy gourd, we assume that the nanoparticles could be safer to be used in drug delivery. For the optimization and formulation of nanoparticles as a drug, more research is required. Accordingly, toxicity, in vivo antidiabetic and drug targeting studies are advancing and is under progress.
Acknowledgement
One of the authors acknowledges Kerala State Council for Science, Technology and Environment, KBC/YIPB, Thiruvananthapuram, Kerala, India for the funding (Council Order No. (T) 469/KBC/2009/CSTE dated 29.03.2010) provided for the study. We acknowledge Dr Hareesh U. S., Materials Science and Technology division, CSIR-NIIST, Trivandrum, Kerala, India for providing us with the technical facility for particle size and polydispersity index determination.
Declaration of Competing Interest
The authors declare that they have no known competing financial interests or personal relationships that could have appeared to influence the work reported in this paper.
References
- LC-MS and LC-PDA vs. phytochemical analysis of Colchicum brachyphyllum. Pharmazie. 2008;63:860-865.
- [CrossRef] [Google Scholar]
- Anti-oxidant effect of gold nanoparticles restrains hyperglycemic conditions in diabetic mice. J. Nanobiotechnol.. 2010;8:1-15.
- [Google Scholar]
- Antidiabetic activity of Syzygium calophyllifolium in Streptozotocin-Nicotinamide induced Type-2 diabetic rats. Biomed. Pharmacother.. 2016;82:547-554.
- [CrossRef] [Google Scholar]
- Cyanidin 3-Glucoside and Peonidin 3-Glucoside Inhibit Tumor Cell Growth and Induce Apoptosis In Vitro and Suppress Tumor Growth In Vivo. Nutr. Cancer. 2005;53:232-243.
- [CrossRef] [Google Scholar]
- Impact of particle size and polydispersity index on the clinical applications of lipidic nanocarrier systems. Pharmaceutics. 2018;10:1-17.
- [CrossRef] [Google Scholar]
- In vitro characterization and in vivo toxicity study of repaglinide loaded poly (methyl methacrylate) nanoparticles. Int. J. Pharmaceutics. 2010;396:194-203.
- [CrossRef] [Google Scholar]
- Development of zein-pectin nanoparticle as drug carrier. Int. J. Drug Delivery. 2012;4:147-152.
- [Google Scholar]
- Plant-mediated gold nanoparticles by Dracocephalum kotschyi as anticholinesterase agent: Synthesis, characterization, and evaluation of anticancer and antibacterial activity. J. Appl. Biomed.. 2016;14:235-245.
- [CrossRef] [Google Scholar]
- Antimicrobial effects of the Flavonoid fractions of Mimosa pudica L. leaves. J. Pharm. Res.. 2011;4:1438-1439.
- [Google Scholar]
- The effects of traditional antidiabetic plants on in vitro glucose diffusion. Nutr. Res.. 2003;23:413-424.
- [Google Scholar]
- HPLC profiling of Mimosa pudica polyphenols and their non-invasive biophysical investigations for anti-dermatoheliotic and skin reinstating potential. Biomed. Pharmacother.. 2019;109:865-875.
- [CrossRef] [Google Scholar]
- ISO 22412. (2008). International Standard ISO 22412. International Standard ISO 22412 1, 1–8. https://doi.org/10.1021/es0620181.
- Structural characterization of a novel derivative of myricetin from Mimosa pudica as an anti-proliferative agent for the treatment of cancer. Biomed. Pharmacother.. 2016;84:1067-1077.
- [CrossRef] [Google Scholar]
- In vitro studies of immunomodulatory and free radical scavenging activities of flavonoid isolated from Mimosa pudica. Int. J. Pharm. Sci. Res.. 2014;5:4254-4261.
- [Google Scholar]
- Chitosan – Alginate Nanoparticles as a Novel Drug Delivery System for Nifedipine. Int. J. Biomed. Sci.. 2008;4:221-228.
- [Google Scholar]
- Solid lipid nanoparticles for oral drug delivery: chitosan coating improves stability, controlled delivery, mucoadhesion and cellular uptake. Carbohydr. Polym.. 2015;122:221-229.
- [CrossRef] [Google Scholar]
- Curcumin-loaded poly (e -caprolactone) nanofibres : diabetic wound dressing with anti-oxidant and anti-inflammatory properties. Clin. Exp. Pharmacol. Physiol.. 2009;36:1149-1156.
- [CrossRef] [Google Scholar]
- Preparation and characterization of zein and zein-chitosan microspheres with great prospective of application in controlled drug release. J. Nanomater.. 2011;2011
- [CrossRef] [Google Scholar]
- Swelling studies and in vitro release of verapamil from calcium alginate and calcium alginate – chitosan beads. Int. J. Pharm.. 2006;323:34-42.
- [CrossRef] [Google Scholar]
- Prusty, A., Sahu, S. K., 2013. Development and Evaluation of Insulin Incorporated Nanoparticles for Oral Administration. ISRN Nanotechnology, 2013, 6 pages.
- Improved absorption and bioactivity of active compounds from an anti-diabetic extract of Artemisia dracunculus L. Int. J. Pharm.. 2009;370:87-92.
- [CrossRef] [Google Scholar]
- Silverstein – Spectrometric Identification of Organic Compounds (7th ed (7th ed.).). John Wiley & Sons INC.; 2005.
- In vitro retardation of glucose diffusion with gum extracted from malva nut seeds produced in Thailand. Food Chem.. 2011;127:455-460.
- [CrossRef] [Google Scholar]
- Antidiabetic activity of the leaves of Mimosa pudica Linn. in albino rats. J. Herbal Med. Toxicol.. 2009;3:123-126.
- [Google Scholar]
- Evaluation of Invitro Antidiabetic Activity of Sphaeranthus Amaranthoides Silver nanoparticles. Int. J. Nanomater. Biostructures. 2012;2:25-29.
- [Google Scholar]
- Chitosan nanoparticles: a promising system for drug delivery. Naresuan University J.. 2003;11(3):51-66.
- [Google Scholar]
- Umrani, R. D., Paknikar, K. M., 2015. Jasada bhasma, a Zinc-Based Ayurvedic Preparation : Contemporary Evidence of Antidiabetic Activity Inspires Development of a Nanomedicine. Evidence-Based Complementary and Alternative Medicine, 2015, 9 pages. https://doi.org/10.1155/2015/193156.
- Anti-diabetic activity of Thottal vadi choornam (Mimosa pudica) in Alloxan Induced Diabetic Rats. Int. J. Natural Product Sci.. 2013;3:13-20.
- [Google Scholar]
Appendix A
Supplementary data
Supplementary data to this article can be found online at https://doi.org/10.1016/j.jksus.2020.01.017.
Appendix A
Supplementary data
The following are the Supplementary data to this article:


