

Translate this page into:
Plane shock wave propagation in partially saturated soil
⁎Corresponding author. yuetangzh@163.com (Yue-tang Zhao)
-
Received: ,
Accepted: ,
This article was originally published by Elsevier and was migrated to Scientific Scholar after the change of Publisher.
Peer review under responsibility of King Saud University.
Abstract
Considered that the gas content of partially saturated soil would decrease under a shock load, which would cause volumetric plastic deformation, Lyakhov's constitutive model is improved. The P-α state equation is used to describe the volume compression relationship of partially saturated soil. Numerical and experimental results are compared to validate the material model. The peak stress and duration of shock wave are crucial to study the dynamic response of underground structures. Considered the saturation of partially saturated soils under natural conditions increases with depth and both peak stress and duration change when shock waves propagate in inhomogeneous media, several partially saturated soil models with linearly decreasing air content in the depth direction are developed. The propagation law of shock waves with various peak stresses and durations in partially saturated soils is studied. The results show that the peak stress caused by the incident load in partially saturated soil first decreases and then increases under incident loads with a shorter duration, and it increases monotonically under incident loads with a longer duration. The rate of change in the incident peak stress is proportional to the air content at the top of the partially saturated soil. The peak free-field stress reaches its maximum, which is 2.2 to 5.5 times the peak stress of the incident load, in fully saturated soil. Long-duration incident loads such as nuclear explosions are more threatening to underground structures than short-duration incident loads. Underground structures buried in fully saturated soil or below fully saturated soil with higher air contents above are more at risk than underground structures buried in partially saturated soil with smaller air contents.
Keywords
Partially saturated soil
Volume compression relationship
Plane shock wave
Peak stress
Numerical research

1 Introduction
In recent years, the scale of cities in various regions has continued to expand, and underground transportation networks such as subways and underground tunnels have grown. The distribution and mechanical characteristics of soils in different regions are usually not the same, so the geological environment that underground tunnels pass through is quite complicated, especially for underwater shield tunnels. As shown in Table 1, underwater shield tunnels often pass through a variety of soil layers (Hong, 2007;27:1–3+18.). For example, the Shanghai Yangtze River Tunnel has an average burial depth of 9 m, and the shallowest burial depth is only 6.8 m. It passes through grey silt clay, grey clay, and other soil layers (Yuan et al., 2008). The air quantity in silt clay is usually very small, and it varies with depth within a certain range (Jiang and Luo, 2007).
Name
Outer Diameter (m)
Crown Buried Depth (m)
Soils
Shanghai Yangtze River Tunnel
15.0
9 (Average)
Grey silty clay, Grey clay, etc.
Shiziyang Tunnel on Guangzhou-Shenzhen-Hong Kong
10.8
8.7–26
Silty clay, Silty clay, etc.
Qinhuai River Section of Nanjing Metro
3.2
0.97
Silty clay
Nanjing Yangtze River Tunnel
14.5
10.49 (Shallowest)
Fine sand, Gravel sand, etc.
Maliuzhou Tunnel
14.5
12–14.94
Silt, Clay, etc.
The peak stress generally decreases in the direction of wave propagation in soils, and the peak stress on the rigid wall is not larger than double the incident stress. These phenomena have been theoretically and experimentally validated on many occasions for unsaturated soils and saturated soils (Drake and Little, 1983; Department of the Army. Fundamentals of protective design for conventional weapons. Technical manual TM5-855-1. Washington, DC: Department of the Army;, 1986; Lyakhov, 1974; Seaman and Whitman, 1966). Nevertheless, for partially saturated soils in the natural state, unique phenomena can be observed under transient loading (Lyakhov, 1974; Lyakhov, 1964; Dontsov and Nakoryakov, 2001; Emery and Valent, 1995), and the content of air in soils is the most dominant factor affecting the behaviour; unfortunately, there is a lack of details related to such experiments.
Due to the increasing-hardening constitutive relation of partially saturated soil, the propagation law of shock waves in such soil is different from that in other geotechnical media. The wave velocity in partially saturated soil is usually higher than that in unsaturated soil under the same explosion load. The rise time of the shock wave in the near and middle areas of the explosion is very short due to the increasing-hardening constitutive relation, which causes the structure to easily experience strong vibration and even be destroyed (Mu et al., 2010). The interaction between the soil and structure may also lead to the accumulation of pore pressure near the structure, which would destroy the stability of the structure (Liang et al., 2018). Therefore, it is very meaningful to study the propagation law of shock waves in partially saturated soil.
Lyakhov (Lyakhov, 1964) experimentally obtained the relationship between the peak free-field stress and scaled range for explosions in sandy soils. The experiments were performed in fine-grained sands with different air contents, and the charges were buried at a sufficient depth of 2.5Q1/3 to exclude the effect of the free surface. According to the viewpoint of G. M. Lyakhov, in water-saturated soils, stress waves always have the features of shock waves. The stress resulting from wave propagation does not depend on the orientation, and the soil behaves like a liquid. In unsaturated soil, the stress in the direction of propagation is higher than that in the normal direction. It must be emphasized that all maximum stresses in the experiment performed by Lyakhov were greater than 1.0 MPa for water-saturated sand. According to the experimental results (Lyakhov, 1964), in a water-saturated soil at normal incidence of the shock wave on a rigid obstacle, the stress increases 2 to 3.3 times depending on the kind of soil and the magnitude of the incident stress. For low incident stress, the increase is twofold, and as the incident stress increases, it may reach a value as high as the upper limit given above. Furthermore, the stress in the media is considerably influenced by the state of the air content in the soil.
Based on Lyakov’s work, Bloom (Bloom, 2006) studied the problem of shock propagation in the plastic gas zone and proposed that Lyakov’s results were very useful in research of shock waves in soils. Richart et al. (Richart et al., 1970) investigated the theory for the propagation of elastic compression waves in partially saturated soils and discussed the effects of small amounts of air on the elastic wave propagation velocity. Mesgouez et al. (Mesgouez et al., 2005) and Schanz and Cheng (Schanz and Cheng, 2000) studied the stress and particle displacement of elastic waves in porous media based on Biot (Biot, 1956) theory. Zhou et al. (Zhou et al., 2013) used numerical examples to investigate the propagation characteristics of elastic waves in nonuniform saturated soil, such as the wavenumber and dissipation. Li et al. (Li et al., 2018), Kim et al. (Kim et al., 2002; Kim et al., 2002) and Xiang-Wei and Xiang-Yue (Xiang-wei and Xiang-yue, 1989) used different theories to analyse wave propagation properties in saturated porous media, and the influence of parameters such as the saturation and permeability in saturated soil on the wave velocity was studied. Wang et al. (Wang et al., 2019) measured longitudinal wave velocity and a comprehensive in several sandstone samples with different degrees of saturation and different micro-pore structure characteristics by improved acoustic emission. The results show that the wave velociy has almost no relationship with the pore size in the medium, but with the increase of saturation, the wave speed increases obviously. The wave velocity is related to the wave impedance, so the increase of the saturation will directly lead to the increase of the wave impedance, thus affecting the characteristics of the shock wave in the medium. Wang (Wang, 2021) investigated the nonlinear dynamic response in saturated soil caused by shock wave propagation based on numerical and experimental results. Gang et al. (Gang et al., 2019) comparatively analysed the experimental data of four groups of partially saturated soils under plane impact loading. The results showed that the dynamic behaviour of the soil was influenced by the water content boundary conditions when the dry densities were the same. Yu et al. (Yu et al., 1982) and Zhao et al. (Zhao et al., 2004; Zhao et al., 2004) conducted experiments on the propagation of shock waves in silty saturated soil, saturated sand, and saturated clay in a certain area, and the inverse-attenuation phenomenon of the free-field stress in saturated soil was discovered. When the partially saturated soil was close to fully saturated, a slight change in the air content would have a substantial effect on the shock wave propagation characteristics in soil (Li et al., 2018; Zhao et al., 2007). Because the maximum deformation of the structure under incident loading is often determined by the peak stress, it is meaningful to calculate the peak stress around the tunnel by studying the relationship between peak stress and depth in partially saturated soil.
2 Constitutive model of partially saturated soil
2.1 P-α model of partially saturated soil
The law of shock wave propagation in a specific physical model can be intuitively and effectively obtained by a set of experiments. However, it is very difficult to precisely control the saturation of the sample, and the scale of the experiment is limited by the experimental scale, budget, etc. More importantly, the geological conditions vary substantially by region. These objective conditions make it difficult to propose the propagation law of shock waves in various geological conditions for experimental applications.
Bloom (Bloom, 2006) has proposed that Lyakov’s results were very useful in research of shock waves in soils. But the phenomenon that the gas content of partially saturated soil would decrease and the saturation will gradually increase under a shock load was not considered in the constitutive model. So Lyakhov's nonlinear elastic model was improved to a nonlinear model that considered volumetric plastic deformation in this paper.
The volume compression equations of air, water, and solid particles can be described by the Tait equation:
where Pf represents the hydrostatic pressure inside the medium, and the hydrostatic pressure acting on different components is constant. i = 1, 2, 3 represent air, water, and solid particles, respectively; Ci0 represents the wave velocity of the i-th component; and ρi0 and ρi represent the density before and after compression, respectively, of the i-th component. γi represents the isentropic index of the i-th component, where γ1,2,3 = 1.4, 3.0, and 7.0.
The skeleton part is approximated by a bilinear stress–strain relationship, as shown in Fig. 1(a). The relationship of elasticity gives the following equation:
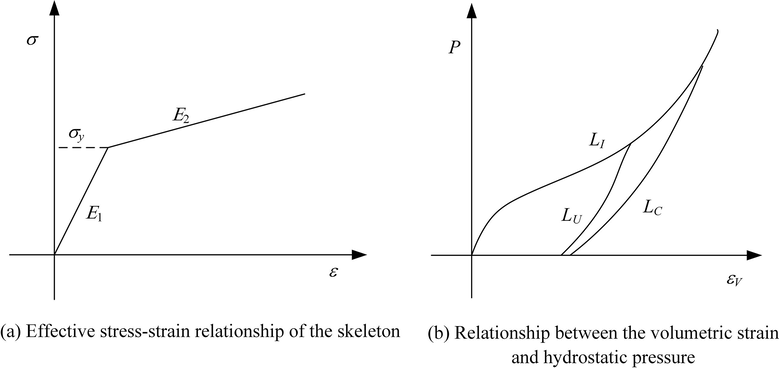
Sketch of the Compressive Stress-Strain Relationship.
Where K represents the bulk modulus, E represents the elastic modulus, v represents the poisson's ratio, and G represents the shear modulus.
The volume compression relation of the skeleton in the elastic deformation stage can be easily obtained by Eq. (2).
After the explosion wave propagates, the volume residual deformation, which mainly comes from the dissolution of gas and the restacking of the skeleton structure, in partially saturated soil is much smaller than that in unsaturated soil. It can be assumed that there are two envelope curves in the equation of state of partially saturated soil if it is assumed that the volumetric residual deformation in partially saturated soil is mainly formed in the loading stage. One curve corresponds to the initial loading curve LI, and the other curve corresponds to the complete compression curve LC (see Fig. 1(b)). In the compression curve, the air content is smaller than that in the initial loading stage. A series of unloading–reloading curves LU are included between the initial loading curve LI and the fully compressed curve LC. The expressions of the three curves are described in detail below.
-
(1)
Description of curve LI
Assuming that the volume compression relationship of the partially saturated soil skeleton part is
The total volumetric compression deformation of each component in partially saturated soil is
Where ρ0 and ρ represent the density of soil before and after compression respectively. i = 1, 2, 3 represent air, water, and solid particles, respectively; αi0 represents the percentage content of the i-th component; and ρi0 and ρi represent the density before and after compression, respectively, of the i-th component.
The relationship between the total hydrostatic pressure in the medium and the effective stress and pore hydrostatic pressure is
where the subscripts f and s represent the fluid and skeleton, respectively.
-
(2)
Description of curve LC
According to Lyakhov, the volume of the skeleton in partially saturated soil is basically unchanged in the unloading stage under explosion loads. In this case,
-
(3)
Determination of curve LU
Partially saturated soil is a kind of porous medium that can conveniently describe the load-unloading volume deformation relationship using the classic P-α model. In LS-DYNA (Zhao et al., 2004), the pore collapse model is a specific description of the P-α model. The model has been applied to the analysis of the ground shock load propagation law in TENSOR and has achieved good results.
The same assumption as the state equation described in LS-DYNA is adopted: the medium deformation is elastic when the volumetric strain follows Δ < Δ1. When Δ > Δ2, the pores in the partially saturated soil are completely closed, and the initial loading curve LI and the complete compression curve LC completely overlap. Physically, the bulk compressive modulus of the medium is much greater than the previous bulk compressive modulus, which means that the medium enters the approximate “locking” transformation stage. Between Δ1 and Δ2, the loading–unloading curve is determined by the following equation:
where represents the corresponding volume deformation when PC = Pmax in curve LC, represents the corresponding volume deformation when PI = Pmax in curve LI, and the subscripts I, U, and C correspond to the curves LI, LU, and LC, respectively.
The volume deformation can be expressed as
Eq. (7) can be expressed as
In the unloading–reloading curve LU, the volume deformation modulus KU can be expressed as
For the unloading–reloading curve LU,
Therefore,
In the actual calculation process, as long as the analytical description or the curve obtained from the data of the initial loading curve LI and the fully compressed curve LC is given, the unloading–reloading curve LU can be directly calculated and determined by the program according to LI and LC.
For the Pf − Δ relationship,
For the Ps − Δ relationship,
For curve LC,
The P-Δ relationship of LU cannot be directly described by an analytical equation but can be solved numerically.
2.2 Validation of the P-α model
To validate the correctness of the model, LS-DYNA was used to carry out a numerical simulation of an experiment, which has been done before (Zhao et al., 2004). In the experiment, a partially saturated soil sample with a diameter of 0.9 m and a height of 4.74 m was made, and a Φ900 plane blast load generator is used to apply a uniform plane wave to the upper surface of the sample. Considered the axial symmetry of the sample in the experiment, the numerical model uses two-dimensional elements to reduce the size of elements and improve the calculation accuracy. The two-dimensional axisymmetric model with the side boundary as the normal constraint and the bottom boundary as the fixed boundary is established. The specific parameters of the numerical model and the P-α model are shown in Tables 2-4.
Density (kg/m3)
Wave velocity (m/s)
Isentropic index
Air
1.24
340
1.4
Fluid
1000
1500
3.0
Solid
2650
4500
7.0
Depth (m)
Air
Solid
Fluid
4.26 ∼ 4.74
0.020
0.570
0.410
3.79 ∼ 4.26
0.023
0.570
0.407
3.29 ∼ 3.79
0.026
0.570
0.404
2.8 ∼ 3.29
0.029
0.570
0.401
2.3 ∼ 2.8
0.032
0.570
0.398
1.8 ∼ 2.3
0.035
0.570
0.395
1.3 ∼ 1.8
0.038
0.570
0.392
0.8 ∼ 1.3
0.041
0.570
0.389
0.2 ∼ 0.8
0.044
0.570
0.386
0 ∼ 0.2
0.150
0.667
0.183
Parameter
υ
E1 (Pa)
E2 (Pa)
σy (Pa)
Value
0.3
1.0 × 10⁷
0.6 × 10⁷
1.0E5
The incident load in the numerical simulation is consistent with the pressure measured by the sensor on the soil sample surface in the experiment (Zhao et al., 2004). Fig. 2 and Fig. 3 show the incident load and validation of numerical simulation results, respectively. For the convenience of the following description, the vertical stress is simply referred to as the stress.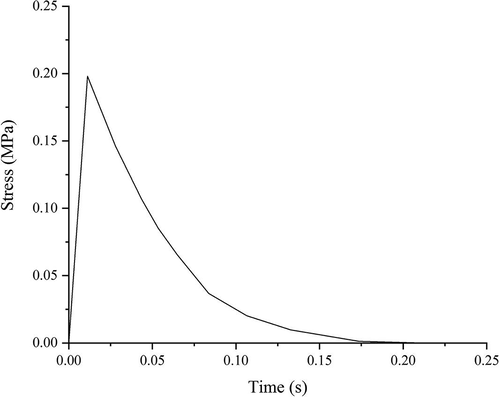
Stress-Time Curve of the Incident Load.
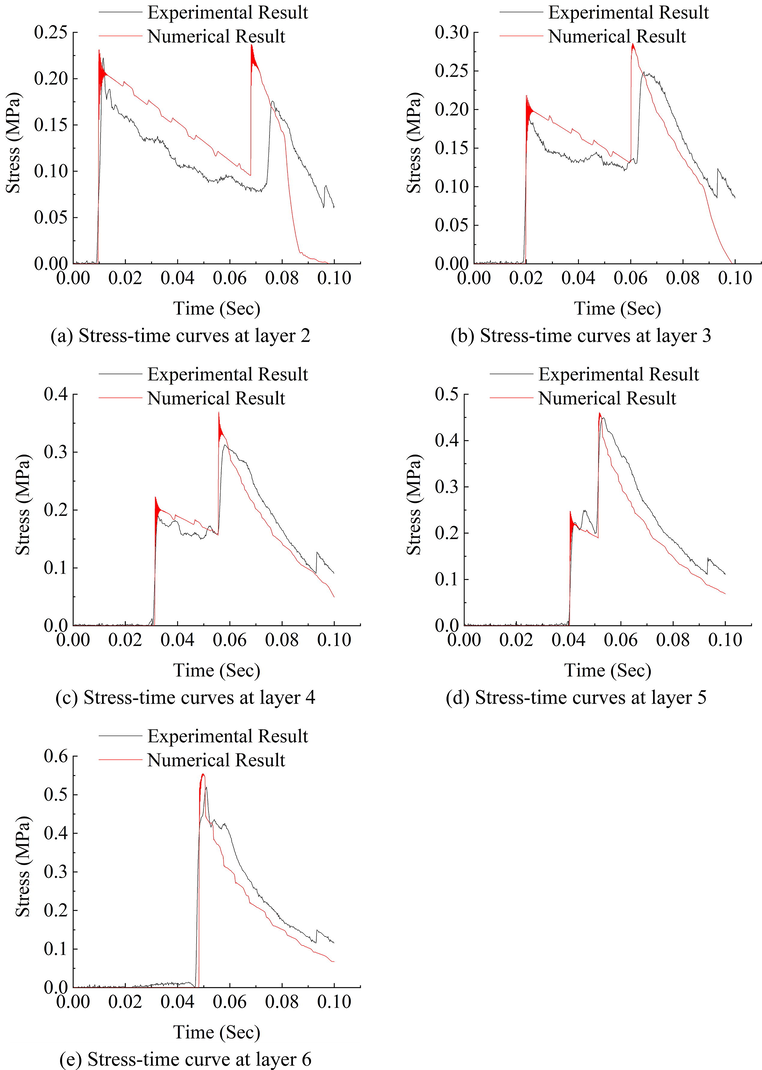
Experimental and Numerical Simulation Results.
For convenience, the first peak stress in Fig. 3 caused by only the incident load is called the incident peak stress. The second peak stress caused by the superposition of the incident load and the reflected load is called the reflected peak stress. The rise time at each depth in the numerical simulation is slightly less than the rise time obtained from the experiment at the same depth. The numerical data exhibit fluctuations in a certain range near the incident peak stress and the reflected peak stress. This phenomenon is caused by the bulk viscosity in the hydrodynamic equations, so the maximum stress of the fluctuation is not the actual stress at a certain depth (Von and Neumann r r., 1950). The intersection of the two straight lines between the rise stage and the gentle decrease stage after the peak stress is the actual peak stress at the depth. The numerical simulation results in Fig. 3 are not substantially different from the incident peak stress in the experimental results. The numerical simulation results are in good agreement with the experimental results for the decreasing trend and duration of the decreasing section after the incident peak stress. The above analysis shows that the waveform and peak stress of the numerical simulation results are in good agreement with the experimental results, which validates the reliability of the material model of the partially saturated soil material. Four numerical models with different air contents at the top were developed, in which the air content changed linearly with the depth in the model. Several loads with the same rise time, different peak stresses, and different duration times were applied to these models. Therefore, the propagation law of free-field plane shock waves in partially saturated soil can be studied.
3 Cases for numerical analysis
Assuming that the air content and other parameters of the soil are even in the horizontal direction, the simulatiton can be simplified to a one-dimensional problem under the action of a plane shock load such as a nuclear explosion. Based on the consideration of the material model of the partially saturated soil discussed before, the numerical model developed in this paper is a two-dimensional plane strain model. Considering the symmetry of the model, the size of the model in the horizontal direction is set to be much smaller than the size in the vertical direction to reduce the calculation time.
In the numerical simulation, two-dimensional plane strain models are established. The material model is the P-α model of the partially saturated soil, the solid content is set to 0.6, the sum of the air content and the water content is set to 0.4, the partially saturated soil is divided into many soil layers with equal thickness in the vertical direction, and the height of each thin layer is 0.01 m. The change in the air content of each layer is adjusted to simulate the phenomenon that the saturation of the partially saturated soil medium increases from top to bottom. In the numerical model, the air content of the partially saturated soil at the water-soil interface (depth y = 0 m) is denoted by αy=0 and is selected according to the characteristics of the silty clay in the middle and lower reaches of the Yangtze River (Jiang and Luo, 2007), which are 0.01, 0.02, 0.03, and 0.04. The air content α decreases linearly in the depth direction, it is fully saturated at a depth of 15 m (yα=0 = 15 m), and the bedrock is located at a depth of 20 m. Since the shock wave velocity in saturated soil can reach approximately 1600 m/s, the superposition of the reflected wave and the incident wave near the bedrock occurs in an extremely short period; therefore, the peak stress of the incident wave and the peak stress of the reflected wave cannot be accurately separated. A total of 81 elements are selected to record the stress time at various depths, and each element is separated by 0.2 m in the range of 0–18 m in depth. These stress-time curves are analysed so that the propagation law of shock waves under different geological conditions can be discussed.
The propagation law of shock waves in partially saturated soils with varying air contents is very different from that in homogeneous elastic media. Due to the increasing-hardening constitutive relation and the change in the propagation direction of partially saturated soil, the stress-time curve in partially saturated soil has a certain particularity. A total of three elements were selected in the model with αy=0 = 0.01 under the shock wave with a peak stress of Pm = 0.2 MPa, rise time of tr = 1 ms, and duration time of td = 200 ms. As shown in Fig. 4(a), the three elements are E1 at the top of the model; E2 at a depth of y = 6 m, which represents elements in the range of an air content greater than zero; and E3 at a depth of y = 18 m, which represents elements in the range of fully saturated soil. The stress-time curves of the three elements are shown in Fig. 4(b). The stress-time curve of E2 has fluctuations in a certain range near the incident peak stress. This phenomenon is caused by the bulk viscosity in the hydrodynamic equations, so the maximum stress of the fluctuation is not the actual stress at a certain depth. Since the stress of the incident load decreases linearly after reaching the peak stress, the stress at each depth tends to change linearly with time after the reaching the incident peak stress. Considering these reasons, a linear equation system, whose solution is taken as the incident peak stress at this depth, is established for the smooth decrease stage after the first fluctuation and the first rise stage. The reflected peak stress can be obtained by the same method. The incident peak stress and reflected peak stress are denoted by P1 and P2, respectively.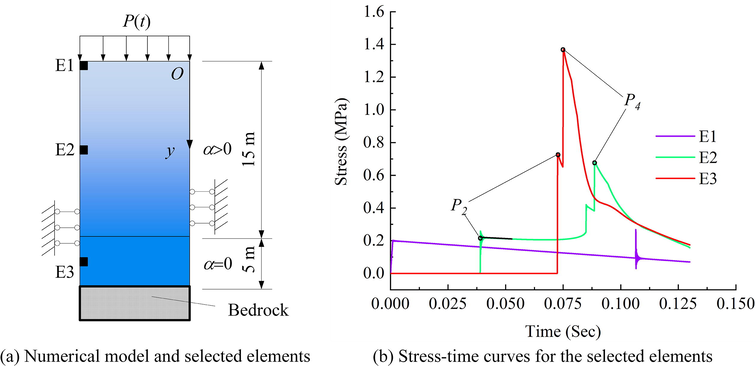
Typical Stress-Time Curves and Selected Elements.
The stress-time curve of the top element E1 is almost the same as the stress-time curve of the incident load. The incident peak stress of element E2 is slightly larger than the peak stress of the incident load, reaching approximately 0.22 MPa, and the reflected peak stress reaches 0.41 MPa near 0.16 s, which exceeds the incident peak stress of the element. The incident peak stress of element E3 is approximately 0.73 MPa, which substantially exceeds the peak stress of the incident load. Since the element is only 2 m from the bedrock, the reflected load from the bedrock can be quickly attained. The reflected peak stress of element E3 reaches 1.4 MPa, and the stress decreases rapidly with time after the reflected peak stress. Based on a comparison of the incident peak stresses of the three elements, the incident peak stress gradually increases as the depth increases. The law of incident peak stress change with depth will be analysed in detail below.
4 Results and discussion
Incident loads with peak pressures of 0.2 MPa, 0.6 MPa, and 1.0 MPa are applied at the upper boundary of the model. The rise times of the incident loads are all 1 ms, and the duration times are 50 ms, 100 ms, 200 ms, and 300 ms. Four numerical models with different αy=0 values under various incident loads are simulated by LS-DYNA. The incident peak stresses varying with depth in the four models are shown in Figs. 5-8.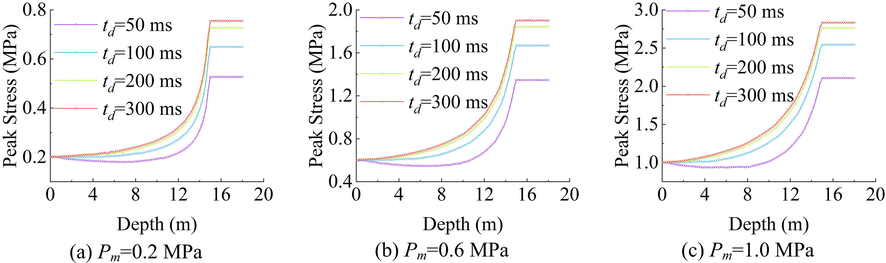
Incident Peak Stress-Depth Curves in the Model with αy=0 = 0.01.
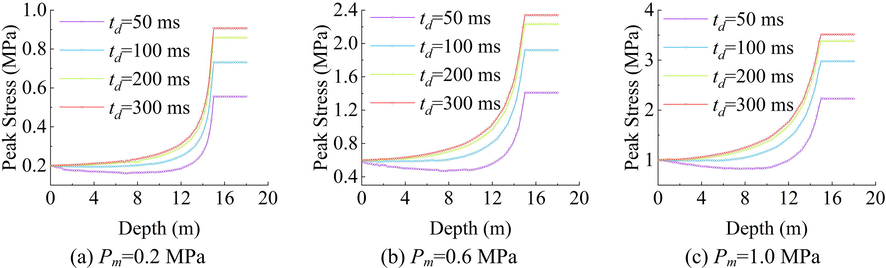
Incident Peak Stress-depth Curves in the Model with αy=0 = 0.02.
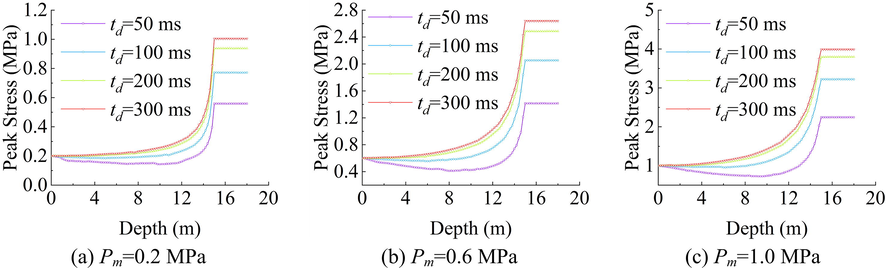
Incident Peak Stress-Depth Curves in the Model with αy=0 = 0.03.
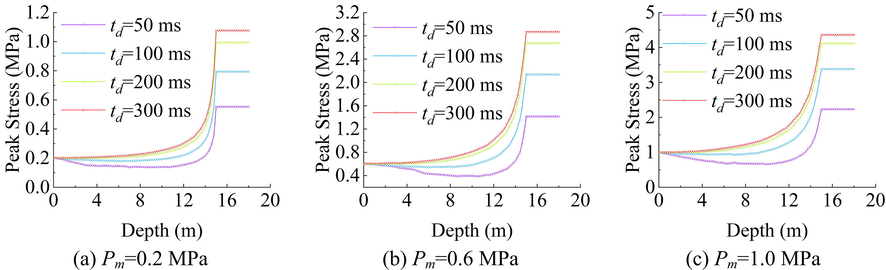
Incident Peak Stress-Depth Curves in the Model with αy=0 = 0.04.
In Figs. 5-8, a similar relationship between the incident peak stress and depth in all numerical models with the same physical and geometric parameters under various incident loads is observed. In the range of 0–15 m, the incident peak stress decreases first and then increases with increasing depth or increases monotonically and reaches its maximum value at a depth of 15 m. This phenomenon is consistent with the results in (Zhao et al., 2004; Zhao et al., 2004). The incident peak stress barely changes as the depth increases at a depth greater than 15 m. The variation law of the incident peak stress in the range of 0–15 m is mainly controlled by two factors. The first factor is that the incident peak stress decreases with increasing propagation distance in partially saturated soil whose air content is constant (Von and Neumann r r., 1950), and the stress increases with depth caused by the increase in the wave impedance of the soil sample with depth (Lyakhov, 1974). When the decreasing rate of the incident peak stress with depth caused by the former is greater than the increasing speed of the stress caused by the latter, the incident peak stress gradually decreases with increasing depth. In contrast, the incident peak stress increases with increasing propagation distance.
In Figs. 5-8 (a)-(c), it is evident that the air content at the top of the partially saturated soil, αy=0, has a certain influence on the variation law of the incident peak stress in the range of 0–15 m. Under the incident load with Pm = 1.0 MPa and td = 50 ms, the decrease rate and rise rate of the incident peak stress change in the range of 0–15 m both increase significantly as αy=0 increases. The incident peak stress in the models with αy=0 = 0.01 and αy=0 = 0.02 under an incident load with Pm = 1.0 MPa and td = 100 ms in the range of 0–15 m increases exponentially as the depth increases. In models with αy=0 = 0.03 and αy=0 = 0.04, the incident peak stress decreases exponentially after a slight decrease in the range of 0–15 m. The law of the incident peak stress change discussed above is also applicable to models under incident loads with Pm = 0.2 MPa and Pm = 0.6 MPa. Regardless of the value of αy=0, the incident peak stress in the range of 0–15 m increases exponentially as the depth increases in the models under incident loads with td = 200 ms and 300 ms. A larger αy=0 leads to a greater increasing rate of the incident peak stress in the range of 0–15 m and a greater value of the maximum incident peak stress at 15 m. The comparison of the incident peak stress–depth curves from models with different αy=0 values shows that under the same incident load, the larger incident peak stress occurs in the range of fully saturated soil in a model with a larger αy=0.
The duration of the incident load has a certain influence on the variation law of the incident peak stress in the range of 0–15 m. In Figs. 5-8, for models under incident loads with td = 50 ms, the incident peak stress clearly decreases as the depth increases in the range of 0–7.5 m. The incident peak stress exhibits only a slight decrease in the range of shallow depths in the models under incident loads with td = 100 ms. The incident peak stress is obviously greater than that in the models under incident loads with td = 50 ms at each depth. The incident peak stress in the range of 0–15 m increases exponentially as the depth increases in the models under incident loads with td = 200 ms. The incident peak stress is greater than that in the models under incident loads with td = 100 ms at each depth. The variation law of the incident peak stress with depth in the models under incident loads with td = 300 ms is consistent with that in the models under incident loads with td = 200 ms. The incident peak stress is only slightly greater than that in the models under incident loads with td = 200 ms. In the range of depths greater than 15 m, where the is the soil is fully saturated, the incident peak stress is also affected by the duration time of the incident load: the incident peak stress increases as the duration time of the incident load increases, and the influence of the duration time on the incident peak stress decreases with the increase in duration. The above discussion shows that the value of the duration time of the incident load within a certain range (less than 200 ms) has a great influence on the incident peak stress at various depths, and the incident peak stress increases significantly at each depth as the duration time of the incident load increases. The influence of the duration of the incident loads on the incident peak stress is slight when the duration is greater than 200 ms.
The peak stress of the incident load Pm has a small influence on the variation law of the incident peak stress in the range of 0–15 m, but it directly affects the value of the peak stress at each depth. The ratio of the incident peak stress at a certain depth to the peak stress of the incident load should be considered.
To further study the influence of αy=0, Pm, and td on the incident peak stress P2, the dimensionless parameter overpressure coefficient at depth y0 is defined as
where P2y0 is the incident peak stress at depth y0.
Because of the increase in the saturation and wave impedance of the soil sample with depth, the incident peak stress reaches the maximum in the fully saturated soil (Bloom, 2006; Wang, 2021). Obviously, it can be seen from Figs. 5-8 that the maximum overpressure coefficient is in the fully saturated soil, which is defined as
where P2m represents the average value of the incident peak stress in fully saturated soil.
It is necessary to determine the relationship between the incident peak stress at shallow depths and the peak stress of the incident load for shallowly buried structures. The ratio of the incident peak stress at y = 0 to the peak stress of the incident load in Figs. 5-8 approaches 1. The variation in the incident peak stress with depth at shallow depths (0–7 m) is monotonous. The ratio of the incident peak stress at y = 7 m to the peak pressure of the incident load ηy=7 is plotted in Fig. 9, which can determine the influence of αy=0, Pm, and td on the incident peak stress P2.
ηy=7 in Various Models.
Fig. 9 shows that ηy=7 decreases with the increase in αy=0 under each incident load. According to the magnitude of the influence of the duration time of the incident load on the rate of decrease in ηy=7, the curves in Fig. 9 can be divided into four groups corresponding to td = 50 ms, 100 ms, 200 ms, and 300 ms. The slopes of the four groups of curves show that the rate of ηy=7 decreases with increasing td. This phenomenon indicates that the air content in partially saturated soil does not have a substantial effect on the incident peak stress in the range of shallow depths under long-duration loads such as nuclear explosions. However, when the incident load is a short-duration load, such as a chemical explosion, the air content in partially saturated soil has a great influence on the incident peak stress in the range of shallow depths.
The duration time of the incident load td can significantly affect the variation law of the incident peak stress in the range of shallow depths of the model under incident loads with a certain value of the peak stress. In the model with αy=0 = 0.01, ηy=7 gradually increases as the incident load duration td increases, and the increasing rate decreases with increasing td. In the model with αy=0 = 0.01 and under incident loads with td = 50 ms, ηy=7 is much smaller than that under incident loads with td = 100 ms. However, in the model with αy=0 = 0.01 under incident loads with td = 300 ms, ηy=7 is not much greater than that under incident loads with td = 200 ms. The influence of td on ηy=7 discussed above is also appliable to models with different αy=0 values, and the magnitude of the influence increases as αy=0 increases. The above analysis shows that the duration time of the incident loads can significantly affect the incident peak stress variation law in the shallow depth range, and the influence gradually weakens as the duration increases.
Fig. 9 shows that, in the model under incident loads with a certain duration time, ηy=7 would increase slightly with increasing Pm, which is consistent with the existing experimental results.
Shock waves hardly attenuate in fully saturated soil (Schanz and Cheng, 2000); therefore, it is meaningful to study the ratio of the peak stress in fully saturated soil to the peak stress of the incident load for the underground structure in the fully saturated soil or below the fully saturated soil.
Fig. 10 shows that ηm increases with the increase in αy=0 under each incident load. According to the magnitude of the influence of the duration time of the incident load on the rate of increase in ηm, the curves in Fig. 10 can be divided into four groups corresponding to td = 50 ms, 100 ms, 200 ms, and 300 ms. The slopes of the ηm curves for models under incident loads with td = 50 ms approach zero, indicating that the air content at the top of the models barely affects the incident peak stress in fully saturated soil. In the models under incident loads with td = 100 ms, ηm increases with increasing αy=0, and the increasing rate gradually decreases. The trends of the curves of ηm in the models under incident loads with td = 200 ms and 300 ms do not vary substantially. Both trends exhibit a substantial increase with the increase in αy=0, and there is a certain difference in the value of ηm. This shows that when the model is under a short-duration incident load such as a chemical explosion, the air content at the top of the soil does not substantially affect the incident peak stress in fully saturated soil at deep depths. However, the air content in partially saturated soil would significantly affect the incident peak stress in fully saturated soil in models under long-duration loads such as nuclear explosions. This law is exactly the opposite of the variation law of ηy=7 with αy=0.
ηm in Various Models.
The four groups of curves in Fig. 10 all show great influences of Pm, αy=0 and td on ηm. ηm decreases significantly as Pm increases from 0.2 MPa to 0.6 MPa, and ηm exhibits a slight decrease as Pm increases from 0.6 MPa to 1.0 MPa. The value of αy=0 of the models under incident loads with td = 50 ms has a slight influence on ηm. However, ηm increases substantially as αy=0 increases in models under incident loads with td = 200 ms and 300 ms. In the model with αy=0 = 0.01 under incident loads with td = 300 ms, ηm is not much greater than that in the same model under incident loads with td = 200 ms. However, the values of ηm in the model with αy=0 = 0.04 increase significantly as the duration of the incident load changes from 300 ms to 200 ms. The increase in the peak stress of the incident load Pm causes ηm to decrease to a certain extent, but the incident peak stress in fully saturated soil generated by the incident load with a smaller Pm is still smaller than that generated by the incident load with a larger Pm, which is evident in Figs. 5-8.
The three variables, Pm, td, and αy=0, all affect the maximum incident peak stress and the maximum overpressure coefficient in the fully saturated soil. The increase in αy=0 will reduce the influence of Pm on ηm and increase the influence of td on ηm, and vice versa. Considering Figs. 5-8 and the effects of the above three factors on the incident peak stress in fully saturated soil, it is evident that underground structures will be at greater risk when the structure is located in partially saturated soil with a large value of αy=0 or below fully saturated soil exposed to long-duration incident loads such as nuclear explosions.
Considering Figs. 9 and 10, long-duration incident loads are more threatening to underground structures than short-duration incident loads. Underground structures buried in fully saturated soil or below fully saturated soil with higher air contents above are more at risk than underground structures buried in partially saturated soil with smaller air contents.
5 Conclusions
In this paper, the gas content of partially saturated soil would decrease under a shock load was considered, which would cause volumetric plastic deformation, Lyakhov's constitutive model was improved. The P-α state equation was used to describe the volume compression relationship of partially saturated soils, and the numerical results were compared with experimental results to verify the correctness of the material model. Several partially saturated soil models in which the air content changes linearly in the depth direction were developed using the material model. The propagation law of incident loads with various peak stresses and durations in partially saturated soils was studied. The main conclusions are summarized as follows:
-
(1)
The peak stress and duration of the incident load and the air content of partially saturated soil all affect the ratio of the incident peak stress at various depths to the peak stress of the incident load.
-
(2)
The incident peak stress in partially saturated soil shows a trend of decreasing first and increasing later under an incident load with a shorter duration, and a trend of increasing monotonically under the influence of an incident load with a longer duration is observed. The rate of the incident peak stress change is proportional to the air content at the top of partially saturated soil. The incident peak stress reaches its maximum in fully saturated soil, which is 2.2 to 5.5 times the peak stress of the incident load.
-
(3)
Long-duration incident loads such as nuclear explosions are more threatening to underground structures than short-duration incident loads. Underground structures buried in fully saturated soil or below fully saturated soil with higher air contents above are more at risk than underground structures buried in partially saturated soil with smaller air contents.
In summary, the present study deals with the propagation law and influencing factors of plane shock waves in soil with varying saturation, which provides a certain basis for the related research on the dynamic response of underground structures in the future.
Acknowledgement
This work was supported by the National Natural Science Foundation of China (No. 51478469).
Declaration of Competing Interest
The authors declare that they have no known competing financial interests or personal relationships that could have appeared to influence the work reported in this paper.
References
- Analysis on technical difficulties of super-long underwater shield-bored tunnels with large cross-sections: case study on Shiziyang tunnel on Guangzhou-Shenzhen-Hong Kong passenger-dedicated railway. Tunn Constr. 2007;27 1–3+18
- [CrossRef] [Google Scholar]
- Analysis of coupled anisotropic seepage and stress of large diameter river-crossing shield tunnel. Chin J Rock Mech Eng. 2008;27:2130-2137.
- [CrossRef] [Google Scholar]
- Study on engineering characteristics of silty clay under water in lower reach of Yangtze river. Chin J Rock Mech Eng 2007:3215-3222.
- [CrossRef] [Google Scholar]
- Ground shock from penetrating conventional weapons. United States: Army Engineer Waterways Experiment Station Vicksburg MS; 1983.
- Department of the Army. Fundamentals of protective design for conventional weapons. Technical manual TM5-855-1. Washington, DC: Department of the Army; 1986.
- Elements of dynamics of blast waves in soils and rocks. Moscow, Russian: Nedra; 1974.
- Stress propagation in soils” project PHU-2917, part IV, DASA 1266–4. Menlo Park, Califonia: Standford Research Institute; 1966.
- Principles of explosion dynamics in soil and in liquid media. Moscow, Russian: Hedla; 1964.
- Enhancement of shock waves in a porous medium saturated with a liquid containing soluble-gas bubbles. Int J Multiph Flow. 2001;27(12):2023-2041.
- [CrossRef] [Google Scholar]
- Emery MH, Valent PJ. Constitutive modeling of air and water saturated sand for shock propagation modeling, workshop summary and recommendations. NRL/MR/6440-95-7658. Washington, DC, USA: Naval Research Laboratory; 1995.
- Characteristics of blast wave propagation in saturated soil with high degree of saturation. J Civ Archit Environ Eng. 2010;32(18–23)
- [CrossRef] [Google Scholar]
- In-plane soil-structure interaction in layered, fluid-saturated, poroelastic half-space II: pore pressure and volumetric strain. Soil Dyn Earthq Eng. 2018;92:585-595.
- [CrossRef] [Google Scholar]
- Wave propagation in partially saturated soils. Appl Mech Rev. 2006;59:177-209.
- [CrossRef] [Google Scholar]
- Vibrations of soils and foundations. Englewood: Prentice-Hall, Inc; 1970.
- Transient mechanical wave propagation in semi-infinite porous media using a finite element approach. Soil Dyn Earthq Eng. 2005;25(6):421-430.
- [CrossRef] [Google Scholar]
- Transient wave propagation in a one-dimensional poroelastic column. Acta Mech. 2000;145(1-4):1-18.
- [CrossRef] [Google Scholar]
- Theory of propagation of elastic waves in a fluid-saturated porous solid. I. Low-frequency range. J Acoust Soc Am. 1956;28(2):168-178.
- [CrossRef] [Google Scholar]
- Propagation of plane wave in non-homogeneously saturated soils. Sci China Technol Sci. 2013;56(2):430-440.
- [CrossRef] [Google Scholar]
- Saturation effects on ground motion of unsaturated soil layer-bedrock system excited by plane P and SV waves. Soil Dyn Earthq Eng. 2018;110:159-172.
- [CrossRef] [Google Scholar]
- Analysis of wave propagation in saturated porous media. I. Theoretical solution. Comput Methods Appl Mech Eng. 2002;191(37-38):4061-4073.
- [CrossRef] [Google Scholar]
- Analysis of wave propagation in saturated porous media. II. Parametric studies. Comput Methods Appl Mech Eng. 2002;191(37-38):4075-4091.
- [CrossRef] [Google Scholar]
- Wave propagation with mass-coupling effect in fluid-saturated porous media. Appl Math Mech. 1989;10(4):321-327.
- [CrossRef] [Google Scholar]
- Study of the effect of micro-pore characteristics and saturation degree on the longitudinal wave velocity of sandstone[J] Arabian Journal of Geosciences. 2019;12(13)
- [CrossRef] [Google Scholar]
- Analysis of nonlinear dynamic characteristics in saturated soil with blast wave diffusion and damage to its effective strength. Int J Civ Eng. 2021;19(2):199-215.
- [CrossRef] [Google Scholar]
- Dynamic behavior of clay with different water content under planar shock conditions. Int J Impact Eng. 2019;129:57-65.
- [CrossRef] [Google Scholar]
- Test of compressive wave propagating in soft saturated soil. Explos Shock Waves. 1982;4:43-49.
- [Google Scholar]
- Experimental investigation on pressure variation during explosion wave propagation in saturated soils. J Seismol. 2004;1:60-65.
- [CrossRef] [Google Scholar]
- Experimental investigation on time characteristics of explosive wave propagation. J Seismol. 2004;2:162-167.
- [CrossRef] [Google Scholar]
- Numerical simulation of explosion wave propagation in the saturated soil. Explos Shock Waves. 2007;27:352-357.
- [CrossRef] [Google Scholar]
- A method for the numerical calculations of hydrodinamical shocks. J. Appl. Phys.. 1950;21:232.
- [Google Scholar]


