

Translate this page into:
Physio-chemical properties of groundwater and their environmental hazardous impact: Case study of Southwestern Saudi Arabia
⁎Corresponding author at: Department of Geology and Geophysics, King Saud University, P.O. Box 2455, Riyadh 11451, Saudi Arabia. akahal@KSU.EDU.SA (Ali Y. Kahal)
-
Received: ,
Accepted: ,
This article was originally published by Elsevier and was migrated to Scientific Scholar after the change of Publisher.
Peer review under responsibility of King Saud University.
Abstract
Southwestern Saudi Arabia is enriched with fractured and highly-weathered igneous and metamorphic rocks that function as the limited aquifer and supply significant quantities of water for household use and agriculture in this area. Twenty-seven groundwater samples were collected from shallow-dug wells and physio-chemically examined. It is displayed that, however the average value of total dissolved solids (792.67 mg/l) is not curiously high, the ionic component moved toward anthropogenic origin of pollution. The water in the area fits SO4–Cl type facies. The aquifer fractured properties and the existence of groundwater at near-surface depths affecting the groundwater hydrochemistry for the investigated area. Decision and policymakers must consider these results to minimize the environmental impact of local pollutants in the region.
Keywords
Environmental impact
Hydrochemistry
Groundwater quality
Pollutants
Saudi Arabia

- AMSL
-
Above mean sea level
- EC
-
Electrical conductivity
- TDS
-
Total dissolved solids
Abbreviations
1 Introduction
Southwestern Saudi Arabia, geologically imposed in the Arabian Shield, is abundant with crystalline rocks that are considered by extremely low primary porosity and permeability. Consequently, it has limited groundwater reserves, and the existing ones are stored mostly in the alluvial deposits along the wadi channels or the weathered/fractured/jointed basement rocks (Al Alawi and Abdulrazzak, 1996). The localized source of groundwater supply depends on the orographic rainfall along the western, southwestern, and southeastern mountain ridges (Al Ammar and Kruse, 2016). Basement rocks and the limited availability of water in these regions because of the semiarid or arid climates restrict the groundwater accessibility. Nevertheless, these basement rocks can in some circumstances serve as shallow aquifers because of the appearance of secondary porosity in the form of fissures and fractures (Davis and Turk, 1964; Houston and Lewis, 1988; Acworth, 1987; Wright, 1992). Recent studies demonstrate that these secondary porosities can also be caused by geomorphological activities (Taylor and Howard, 2000; Wyns et al., 2004; Dewandel et al., 2006).
In these fractured rocks, groundwater only flows through conduits, and the aquifer matrix between the conduits is impermeable, with no porosity (Cook, 2003). These highly weathered and fractured nature of rocks can form reliable aquifers in many arid areas (Gustafson and Krásný, 1994; Singhal and Gupta, 1999). The degree to which the fractures are interconnected affects the ability of fractures to function as conduits for groundwater flow. Fracture connectivity increases with increasing fracture length and fracture density.
One critical factor in assessing the quantity of available water to meet the various demands of agriculture, industry, and other human activities is the quantity of rainfall. The desert climate is dominant in Saudi Arabia, with extremely hot summers all over the country and scarce rainfall almost everywhere. The investigated region is placed within the subtropical climate zone and receives a higher amount of rainfall than other regions because of it is mountains with elevations reaching more than 2000 m (above mean sea level (AMSL)). These highlands receive variable rainfall in winter caused by westerly depressions and in summer caused by the southwestern monsoon, which brings damp oceanic winds, clouds, and fog (Gustafson and Krásný, 1994). The studied area located within the southwestern zone (Fig. 1) and the average annual rainfall can reach more than 300 mm (World Bank Group, 2016).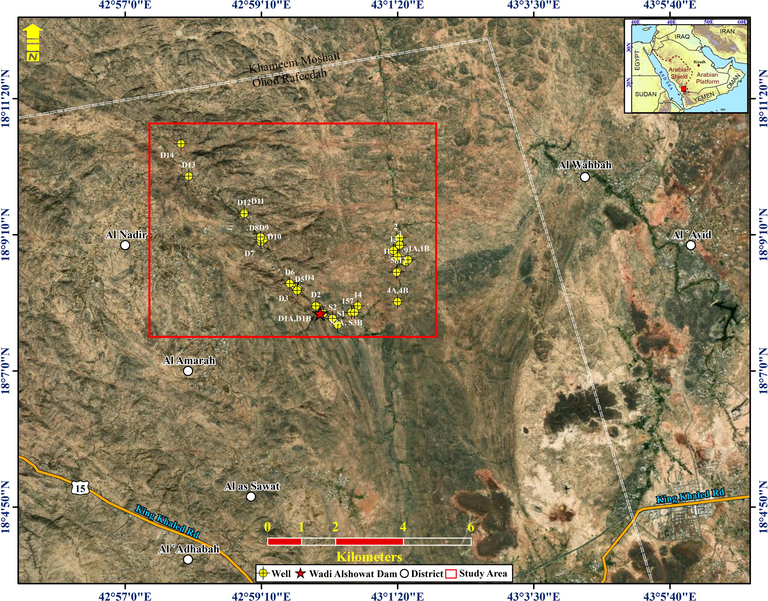
Location map for Wadi Showat area.
Many homes discharge waste in basins near their homes as Wadi Showat basin of highly population and agricultural purposes (Fig. 2a & b). The inhabitants discharge their sewage waste directly into the ground through sewage pipes (Fig. 2a). Fortunately, the total human population and number of rural houses are limited. Besides, there is agricultural activity along the path of the wadi, namely uncontrolled sewage disposal and agricultural return flow, making the shallow aquifer more vulnerable for pollution in the area. Regular analyses of groundwater quality, therefore, is required in the studied area define the source of pollution and areal extent. This study assesses the groundwater chemistry using hydrochemical analysis integrated with geological field investigation.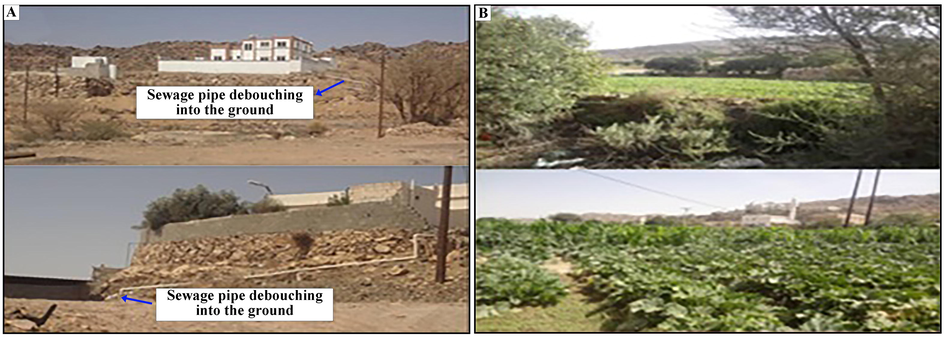
Field photos showing the urban and agricultural hazardous activities along Wadi Showat area.
2 Description of the study area
2.1 Physiography and geological setting
The studied area receives less than 400-mm rain annually, and the typical summer temperatures are 20 °C–25 °C and ∼10 °C in winter, with occasional snowfall along higher elevations. There is a dam in the study area.
The rocks of Bahah and Jeddah groups, and upper Proterozoic plutonic rocks underlie the study area (Fig. 3; Greenwood, 1985). The Jeddah group consists of local, thick deposits of basalt, andesite, and dacite. The Bahah group is present as biotite-quartz schist, carbonaceous phyllite, and subordinate calcareous phyllite containing marble beds. Furthermore, Tertiary and Quaternary basalt and Quaternary surficial deposits overlie the Proterozoic rocks. North-trending faults or fault zones that are superimposed on the volcanic-arc complexes and Proterozoic intrusive rocks affect the study area.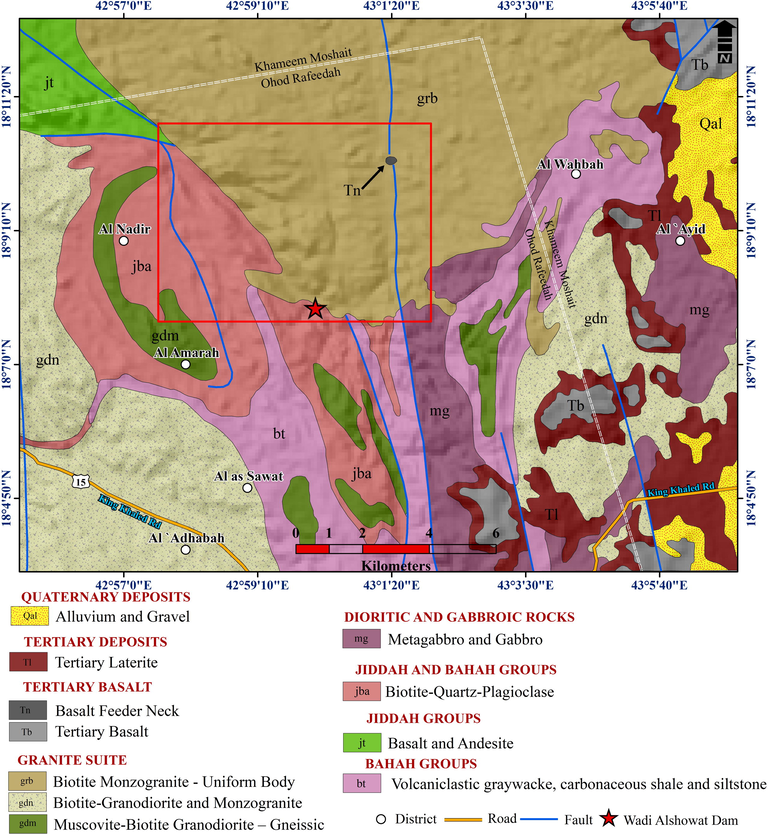
Geologic map of Wadi Al-Showat area.
The investigated area is occupied with fractured and jointed diorite, granodiorite, and granitic rocks that are intruded with alkali-feldspar granite and pegmatite. Fractures with west-northwest to northwest and east to west trends are observed in the field. These fracture zones date from the Tertiary period and are connected with the Red Sea rifting or were reactivated during the Phanerozoic (Hempton, 1987). The granitic rocks are intruded by coarse-grained, monzogranite, and pegmatite veins that have a coarse-grained weathering product and will increase the opened joint systems between the granitic blocks. These fracturing systems are significant from a hydrogeological viewpoint because they facilitate the storage and flow of water through them and the vertical infiltration of surface pollutants.
2.2 Hydrogeology and basin morphometry
Groundwater level depths were taken from 27 observation wells in July 2015. All observation wells fall within the northwestern part of the basin. The piezometric map (Fig. 4) shows a general groundwater flow direction from east to west. Extrapolation of piezometric levels was avoided through the southern area of the basin. The maximum and minimum piezometric levels range from 2,143.07–2,204.35 m AMSL.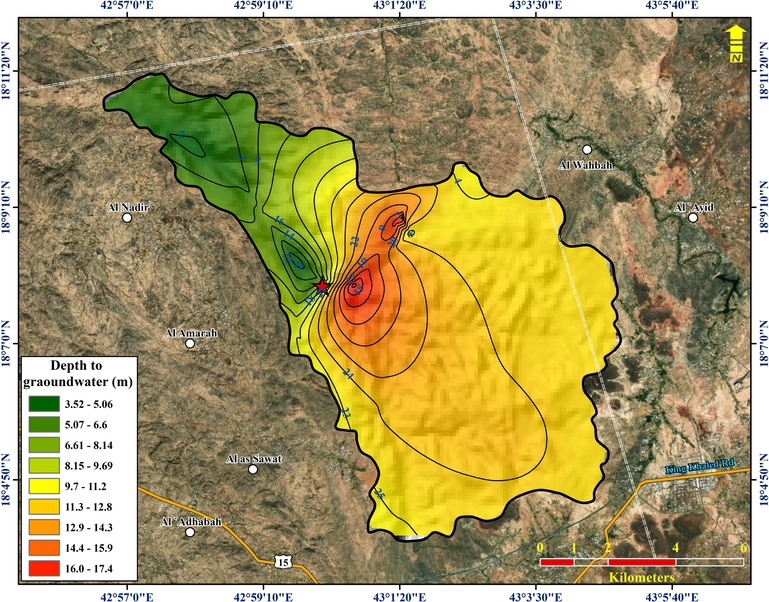
The piezometric level in the study area (in meters above mean sea level).
The Wadi Showat basin (Fig. 5a) was delineated from the ASTER Global Digital Elevation Map using the hydrological processing tool in ArcGIS. The basin covers an area of ∼92.86 km2. As shown by the stream distribution in the study area map, the basin is a fifth-order basin with most water sample locations falling along the main fifth-order basin. The maximum and minimum elevation in the basin ranges from 2,432–2,130 m, with an average elevation of 2,274 m AMSL. The streamflow is southeast to northwest (Fig. 5b). The streams flow dendritically, which is influenced by the topography. However, the fourth-order stream, shown in red on the map, flows south to north and is structurally controlled and influenced by a north–south trending lineament. The sample locations, which lie on the streams other than fifth-order streams in the north-central portion of the study area, fall within this lineament zone. The lineament zone is the northward extension that controls the flow of the fourth-order stream. The average slope of the basin (Fig. 6) is ∼6.22°.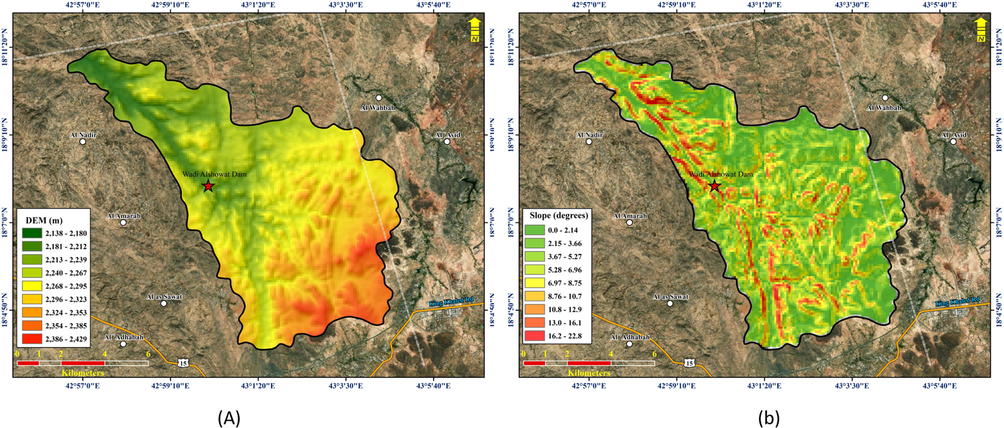
(a) Map showing the DEM of the study area, the dam location, and groundwater sample locations. (b). The slope of the study area (in degrees).
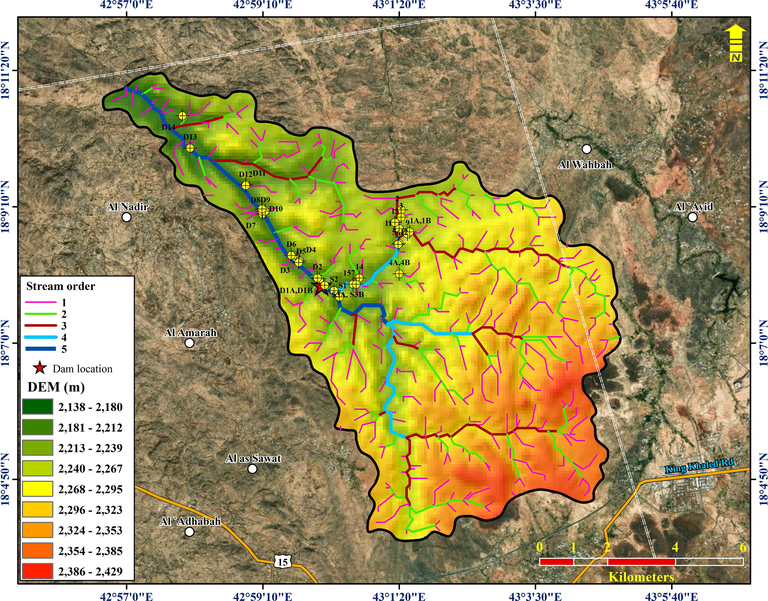
Stream order of Wad Showat basin.
To understand the underlying geological formations, the drainage density (Dd) of the basin was calculated. Several factors control the spatial and temporal evolution of Dd, including T, the sub-surface geology (Kelson and Wells, 1989), climate (Gregory and Gardiner, 1975), and topographic relief and slope (Montgomery and Dietrich, 1989; Oguchi, 1997; Schumm, 1956). A high drainage density indicates resistant sub-surface material resulting in greater runoff during rainfall events.
Basement rocks cover the basin (igneous and metamorphosed igneous rocks), and there are no variations in the spatial distribution of rainfall. In such conditions, the drainage density of the basin should be high; however, it is 2.144 km/km2, which is characteristic of coarse drainage. Field surveys revealed highly fractured/jointed, and these fractures provide preferred pathways for rainwater, which representing groundwater recharge, to percolate underground. The highly fractured nature of the bedrock in the area explains the low drainage density values.
The drainage texture be contingent on the lithology, infiltration capacity, and the topographic relief (Zaidi and Mukhopadhyay, 2015). The steep slope of the basement rocks has resulted in a fine drainage texture (greater than 10), but it was computed as 7.20, which is a further indication of weathered or fractured basement rocks. Field investigations in the area point toward fractured basement rocks. The fractured rocks significantly influence the groundwater recharge from precipitation.
3 Methodology
Twenty-seven water samples were collected in 1-L polyethylene bottles from the available shallow-dug wells along the Wadi Shwat basin. Before filling with sampled water, the bottles were rinsed to minimize contamination. Preservation of the groundwater samples and the used analytical techniques followed the standards of the American Public Health Association. While hydrogen ion concentration (pH), total dissolved solids (TDS), and electrical conductivity (EC) were identified using a pH-meter, a TDS-meter, and a portable EC-meter, respectively (Hanna Instruments, Michigan, USA). The sodium (Na+), potassium (K+), magnesium (Mg2+), and calcium (Ca2+) ions were calculated using an atomic absorption spectrophotometer. Bicarbonate (HCO32) and chloride (Cl−) were analyzed using volumetric methods. Sulfate (SO42−) was estimated using colorimetric and turbidimetric methods, and Nitrate (NO32−) was measured using ionic chromatography.
The groundwater hydrochemistry was deliberated by means of bivariate plots, a Piper plot, and a Durov Plot for drinking water quality assessment. Then, the results are compared with the World Health Organization’s (WHO) standards.
4 Results and discussion
4.1 General groundwater chemistry
Table 1 shows the general statistics of the analyzed physio-chemical parameters for the 27 groundwater samples and their comparison with drinking water guidelines. The pH values of the examined samples vary from 7.14 to 8.04, with an average value of 7.43, and are mildly alkaline. The TDS values ranged from 357 to 1,310 mg/l. Na was the most abundant cation, followed by Ca, Mg, and K. SO4 was the most prominent anion, followed by Cl and HCO3. NO3 values ranged from 5 to 31 mg/l and, therefore, were insignificant in the area. Of the samples, 33.33% had TDS values above the maximum desirable limit (WHO, 2011), 37% had Ca values above the maximum desirable limits, whereas 33.33% and 40.74% of the examined samples had Cl and SO4 above the standards of the drinking water (Table 1) (WHO, 2011).
Parameters
Minimum
Maximum
Average
Standard Deviation
Drinking Water Quality Maximum desirable Limits (WHO, 2011)
Percentage of samples exceeding the WHO limits*
pH
7.14
8.04
7.43
0.18
7–8
0 (0)
EC (µS/cm)
329.00
2122.00
841.52
473.31
TDS (mg/L)
357.00
1310.00
792.67
304.06
1000.00
33.33 (9)
Ca (mg/L)
24.00
214.00
84.44
63.66
37.03 (10)
Mg (mg/L)
12.00
84.00
43.37
16.45
Na (mg/L)
66.00
143.00
108.22
25.57
200.00
0 (0)
K (mg/L)
8.00
19.00
12.00
2.71
HCO3 (mg/L)
46.00
162.00
86.26
33.65
Cl (mg/L)
93.00
390.00
217.85
102.39
250.00
33.33 (9)
SO4 (mg/L)
96.00
386.00
240.52
84.09
250.00
40.74 (11)
NO3 (mg/L)
5.00
31.00
19.59
6.63
50
0 (0)
The EC against Na/Cl plot was prepared to realize the effect of evaporation on the groundwater chemistry (Fig. 7a). If evaporation is the main process governing the groundwater chemistry, the EC versus Na/Cl plot should be a straight line, representative the Na/Cl ratio remains constant with increasing salinity (Jankowski and Acworth, 1997). Through present study, the Na/Cl ratio increases with decreasing EC, clarifying that Na is removed or Cl is added to the groundwater at higher EC values. Because of the groundwater chemistry is unaffected by the evaporation process, reverse ion exchange might be one reason for the dominance of Cl over Na in the area of study, as shown later in the Durov Plot. The increase in Cl concentration could be because of the presence of sewage water (Mondal et al., 2005), as was observed during field investigations. The fractured nature of the bedrock might facilitate the percolation of this wastewater to the groundwater table.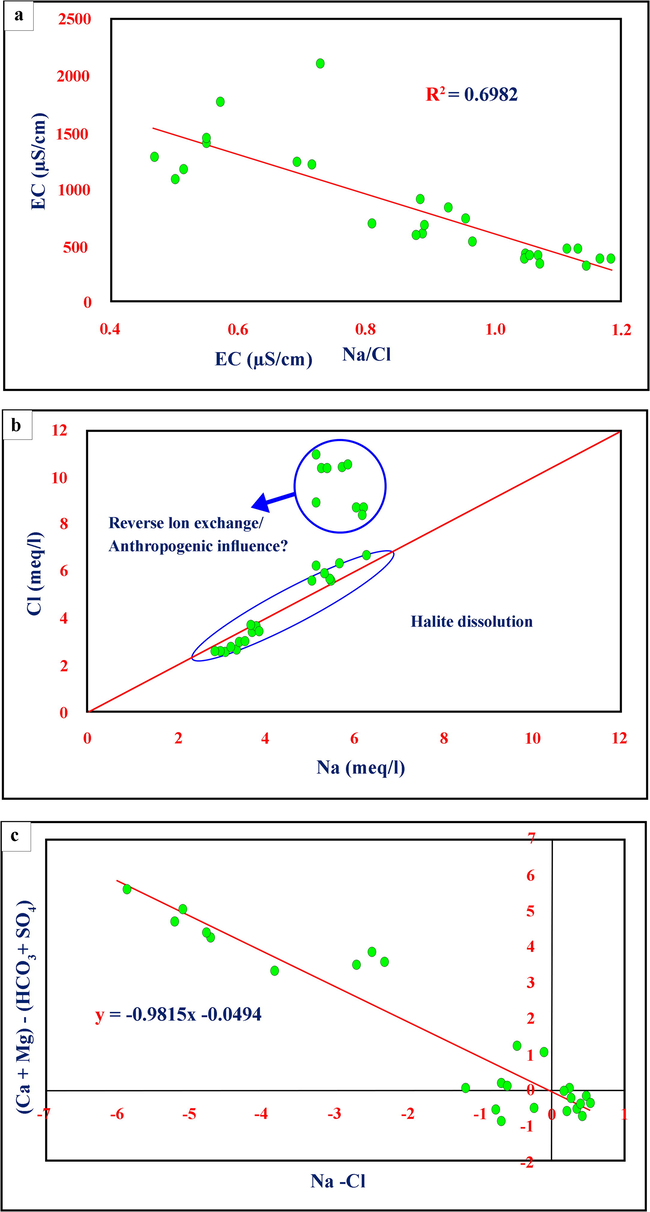
EC versus Na/Cl plot to show the influence of evaporation on groundwater chemistry; b) Cl versus Na plot to show halite dissolution and the possible ion exchange/reverse ion exchange phenomenon; c) (Ca + Mg) -(HCO3 + SO4) versus Na-Cl to assess the influence of base ion exchange reactions on groundwater chemistry.
On the Cl versus Na plot, the 1:1 equiline indicates the halite dissolution. In Fig. 7b, the data points are arranged in two groups. The first group of samples falls on the halite dissolution line, but high Cl values compared to Na represent the second group of samples. The excess Cl over Na could be because of the elimination of Na from the groundwater system because of reverse ion exchange or the addition of Cl from anthropogenic sources (Mondal et al., 2005).
The Na + –Cl − versus (Ca2+ + Mg2+)– (HCO3− + SO42−) plot is effective in validating Ca, Mg, and Na participation in ion exchange reactions. Base ion exchange reactions within the groundwater should exhibit a slope of −1.0 on the plot, with the trend line showing an intercept close to 0 on the y-axis (Fisher and Mullican, 1997; Rajmohan and Elango, 2004). In this case (Fig. 7c), the slope is −0.98 (approximately −1), and the y-intercept is −0.049 (close to 0), indicating that Ca, Mg, and Na percentages are interrelated through the ion exchange process. Closer examination of the plot, however, shows that only some of samples fall along the trend line, with most falling above or below the line, displaying the base ion reactions do not govern the groundwater chemistry of those samples and thus, oriented toward anthropogenic sources.
4.2 Groundwater classification
4.2.1 Piper plot
Fig. 8 shows the Piper trilinear diagram for the groundwater samples and explains the variations in the cation and anion percentages in the area of interest. The symbols on the Piper plot have been classified according to the type of sample. Black circles symbolize groundwater samples that were collected downstream of the dam, comprising 17 samples. The green squares signify the groundwater samples gathered upstream of the dam, comprising eight samples, whereas the red samples characterize the two water samples collected from the dam reservoir.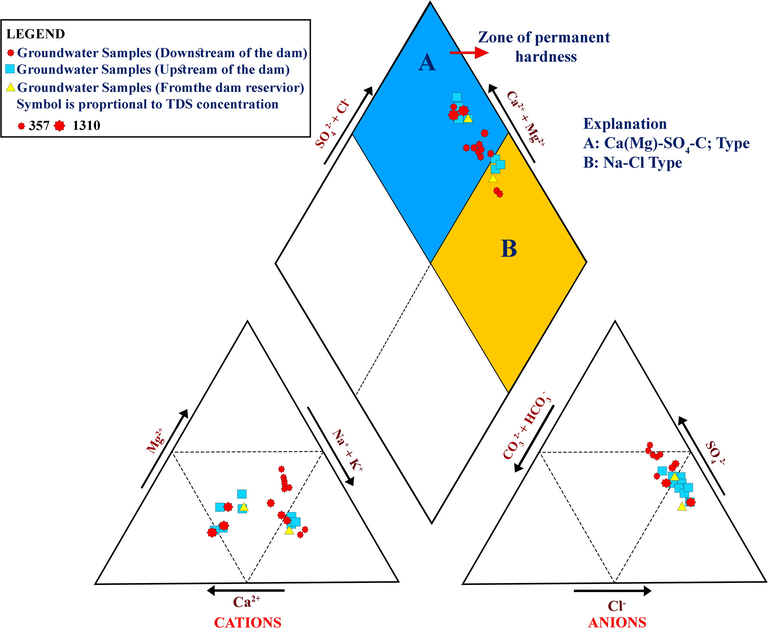
Piper plot of the analyzed samples.
In the studied area the groundwater fits to the SO4–Cl type, which can be subdivided into two main types of groundwater facies based on the abundance of cations. The first is the Ca (Mg)–SO4–Cl type, comprising 20 samples (5 upstream samples, 1 surface water sample, and 14 downstream samples). This groundwater facies also contains samples that have undergone reverse ion exchange, where the Na in the groundwater has been replaced by Ca and Mg in the materials of the aquifer itself. The map shows that some water samples are also categorized by permanent hardness because of the generation of non-carbonate salts, predominantly among the samples upstream of the dam.
The second groundwater facies fit in the Na–Cl type and is characterized by simple halite dissolution and includes six water samples (three samples upstream, one surface water sample, and two samples downstream). High TDS values characterize the samples fitting the Ca (Mg)–SO4–Cl type and most samples from the upstream side of the dam, one surface water sample, and one sample in the downstream direction next to the dam reservoir. The samples farther away from the downstream side of the dam show lower TDS values, possibly because of the dilution of groundwater in the downstream side because of water percolation from the dam reservoir.
4.2.2 Durov plot
The extended Durov diagram explains the processes causing the chemical assessment of groundwater in a hydrological setup better (Lloyd and Heathcote, 1985). DurovPwin software (Al-Bassam and Khalil, 2012) was used to prepare the Durov Plot (Fig. 9). On the Durov Plot, the samples fall into Type 5, Type 7, Type 8, and Type 9 categories. Majority of samples falls within the Type 5 category, representing the mixed type of groundwater facies, although they are nearby the Type 8 and Type 9 classes, considered by the supremacy of SO4 and Cl. The type 7 groundwater facies represent the Ca–Cl2 type of groundwater, which is rare and characterized by the abundance of Ca over Na and Cl over SO4. This type of groundwater facies lies within the zone of permanent hardness in the Piper plot. Water represents the type 8 facies, characterized by reverse ion exchange or the abundance of Ca + Mg over Na. The type 9 facies are represented by simple halite dissolution, as represented by the Na–Cl water type on the Piper plot.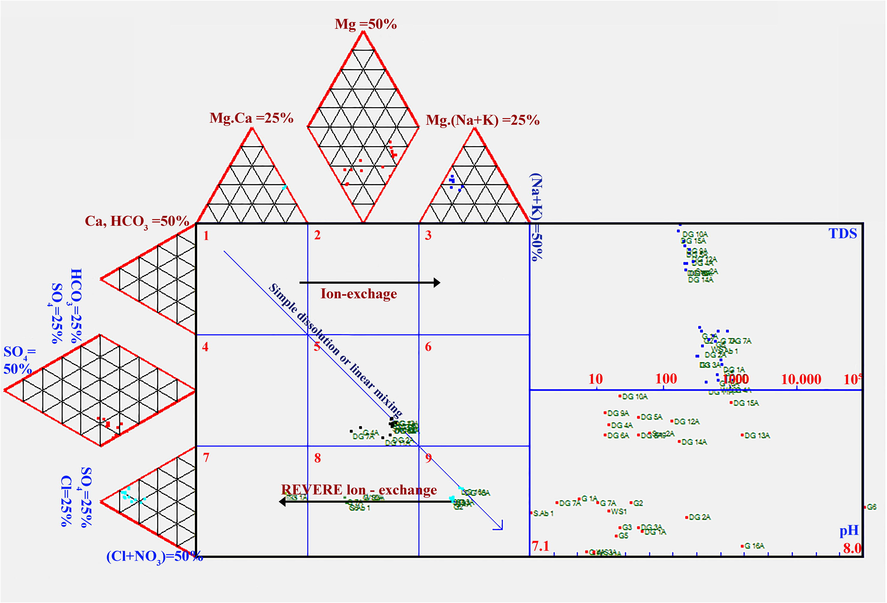
Durov plot of the analyzed samples.
5 Conclusions
This study assessed the near-surface groundwater aquifer along Wadi Showat basin, in the Khamis Mushayt District of southwest Saudi Arabia using hydrochemical and geological analysis. The field investigation displayed that the basement rocks are dissected by two principal sets of fractures that are oriented west to northwest and east to west. These fracture systems are the principal aquifers Wadi Showat basin and are critical from a hydrogeological viewpoint because they allow the aquifer to achieve the storage and transmissive function. Simultaneously, the fracture aquifer system makes it highly vulnerable to pollution from domestic and agricultural activities.
The concerned authority in the investigated area should put in place regulatory frameworks for groundwater pumping, domestic sewage waste disposal, and agricultural purposes to prevent depletion and groundwater pollution.
Acknowledgements
The authors extend their appreciation to the Deputyship for Research & Innovation, “Ministry of Education “in Saudi Arabia for funding this research work through the project number (IFKSURG-1438-059).
Declaration of Competing Interest
The authors declare that they have no known competing financial interests or personal relationships that could have appeared to influence the work reported in this paper.
References
- The development of crystalline basement aquifers in a tropical environment. Quart. J. Eng. Geol. Hydrogeol.. 1987;20(4):265-272.
- [CrossRef] [Google Scholar]
- Water in the Arabian Peninsula: problems and perspectives. In: Rogers P., Lydon P., eds. Water in the Arab World: Perspectives and Prognoses. Egypt: The American university in Cairo press; 1996. p. :171-202.
- [Google Scholar]
- Resistivity soundings and VLF profiles for siting groundwater wells in a fractured basement aquifer in the Arabian Shield, Saudi Arabia. J. Afr. Earth Sc.. 2016;116:56-67.
- [CrossRef] [Google Scholar]
- DurovPwin: a new version to plot the expanded Durov diagram for hydro-chemical data analysis. Comput. Geosci.. 2012;42:1-6.
- [CrossRef] [Google Scholar]
- Cook, P.G., 2003. A Guide to Regional Groundwater Flow in Fractured Rock Aquifers. Australia, CSIRO, 2003, p. 107.
- A generalized 3-D geological and hydrogeological conceptual model of granite aquifers controlled by single or multiphase weathering. J. Hydrol.. 2006;330(1-2):260-284.
- [CrossRef] [Google Scholar]
- Hydrochemical evolution of sodium-sulphate and sodium-chloride groundwater beneath the northern Chihuahuan Desert, Trans-Pecos, Texas, USA. Hydrogeol. J.. 1997;5:4-16.
- [Google Scholar]
- Greenwood, W.R., 1985. Explanatory notes to the geologic map of the Abha quadrangle, sheet 18F, Kingdom of Saudi Arabia.
- Crystalline rock aquifers: their occurrence, use and importance. Appl. Hydrogeol.. 1994;2(2):64-75.
- [Google Scholar]
- Constraints on Arabian plate motion and extensional history of the Red Sea. Tectonics. 1987;6(6):687-705.
- [Google Scholar]
- The Victoria Province drought relief project, II. Borehole yield relationships. Ground Water. 1988;26:418-426.
- [Google Scholar]
- Impact of debris-flow deposits on hydrogeochemical processes and the development of dryland salinity in the Yass River Catchment, New South Wales, Australia. Hydrogeol. J.. 1997;5(4):71-88.
- [Google Scholar]
- Geologic influences on fluvial hydrology and bedload transport in small mountainous watersheds, northern New Mexico, USA. Earth Surf. Proc. Land.. 1989;14(8):671-690.
- [Google Scholar]
- Natural Inorganic Hydrochemistry in Relation to Groundwater: An Introduction. Oxford: Clarendon Press; 1985. p. :294.
- Source areas, drainage density, and channel initiation. Water Resour. Res.. 1989;25(8):1907-1918.
- [Google Scholar]
- Assessment of groundwater pollution due to tannery industries in and around Dindigul, Tamilnadu, India. Environ. Geol.. 2005;48:149-157.
- [Google Scholar]
- Drainage density and relative relief in humid steep mountains with frequent slope failure. Earth Surf. Proc. Land.. 1997;22:107-120.
- [Google Scholar]
- Identification and evolution of hydrogeochemical processes in the groundwater environment in an area of the Palar and Cheyyar River Basins, Southern India. Environ. Geol.. 2004;46(1):47-61.
- [Google Scholar]
- The role of creep and rain-wash on the retreat of badland slopes South Dakota. Am. J. Sci.. 1956;254(11):693-706.
- [Google Scholar]
- Singhal, B., Gupta, R., 1999. Applied Hydrogeology of Fractured Rocks. Springer, ISBN: 978-94-0.5-9210-9 (Print) 978-94-015-9208-6 (Online).
- A tectono-geomorphic model of the hydrogeology of deeply weathered crystalline rock: evidence from Uganda. Hydrogeol. J.. 2000;8(3):279-294.
- [Google Scholar]
- Guidelines for drinking-water quality. World Health Organization. 2011;216:303-304.
- [Google Scholar]
- World Bank Group, 2016. Climate change knowledge portal for development practitioners and policy makers (http://sdwebx.worldbank.org/climateportal/).
- The hydrogeology of crystalline basement aquifers in Africa. Geol. Soc. London Spec. Publ.. 1992;66:1-27.
- [Google Scholar]
- Application of SNMR soundings for groundwater reserves mapping in weathered basement rocks (Brittany, France) Bull. Soc. Geol. Fr.. 2004;175(1):21-34.
- [Google Scholar]
- Morphometric analysis of the Scoria Cones and drainage pattern for the Quaternary and older Volcanic Fields in parts of the Large Igneous Province (LIP), Saudi Arabia. J. Afr. Earth Sc.. 2015;110:1-13.
- [Google Scholar]


