

Translate this page into:
Phylogenetic relationships of the commercial red snapper (Lutjanidae sp.) from three marine regions
⁎Corresponding author. darlinamdn@usm.my (Darlina Md. Naim)
-
Received: ,
Accepted: ,
This article was originally published by Elsevier and was migrated to Scientific Scholar after the change of Publisher.
Peer review under responsibility of King Saud University.
Abstract
Unambiguous and precise identifications of a species are crucial for managing and conserving the species across their dispersal regions. This study analyzed the molecular signatures and phylogenetic relationship of 84 specimens of lutjanids obtained from Malaysia, which covers three marine regions; Straits of Malacca (SM), west South China Sea (west SCS), and east South China Sea (east SCS). The assessment of 613 bp mtDNA COI has markedly classified the samples into five distinct species namely Lutjanus malabaricus, L. argentimaculatus, L. erythtropterus, L. sebae and L. bohar. The intraspecific and interspecific genetic distance ranged between 0.1% − 0.7% and 8.2% − 19.6%, respectively. While genetic homogeneity occurred among population and species across SM and west SCS, significant genetic structuring was detected among species between west and east SCS as evidenced by the occurrence of a single species, L. bohar that can be found only in Sabah (east SCS). The divulged potential loss of gene flow among the regions and was probably caused by oceanic currents. This study detected an ambiguous sequence (from Genbank) probably due to hybridization between species or simply because of an unidentified node. This study proposed that COI is the valid and reliable genetic marker for identifying lutjanids distributed across Malaysian waters. Future revision in distribution pattern and diversity exploration on a large scale with a higher number of samples and different genetic markers is needed to fill this current study's gaps.
Keywords
Lutjanidae
Phylogenetics
DNA barcode
Genetic distance
Conservation

1 Introduction
A prerequisite of any management program is the correct identification of the taxon. More than 1.5 million species of animals, plants, and microorganisms have been documented thus far. However, it is estimated that more than 3 million living species, including fishes, remained unrecognized. For centuries, the naming and classifying of fishes have traditionally been conducted through visible characters (Herbert et al., 2009). For instance, Allen (1985) identified members of the genus Lutjanus inhabiting the South China Sea based on the body colors and shapes, the occurrence of stripes, spines, and the dorsal fin rays as essential discriminating attributes. Under other conditions, Cheng and Zheng (1987) employed the opercular bones and lateral line scales as a fundamental taxonomic trait for the species.
While morphological identification in many species, mostly fishes, is widely recognised (e.g., Karahan et al., 2014; Cruz-Agüero et al., 2015), the phenotypic flexibility of several important features makes this conventional technique extremely difficult for non-experts. Taxonomists have turned to other tools to complement their morphological data, particularly molecular techniques, in the last few decades. Therefore, this traditional method is almost routinely complemented in the previous decade through molecular analysis of various genes from the nuclear and mitochondrial genomes referred to as molecular taxonomy. Of particular interest is the broad application of an approach called DNA barcoding (Herbert et al., 2003; Hubert et al., 2008). The essence of this technique is the use of a specific gene fragment, typically an approximately 650 bp segment at the 5′ end of the cytochrome oxidase subunit I (COI) gene in animals (Herbert et al. 2003). It was predicted that the variation within a species must be higher than its variation with other species (Herbert et al., 2003) and this approach is now widely used in the molecular taxonomy of marine fishes (Herbert et al., 2003; Hubert et al., 2008; Willette et al., 2017).
Approximately 110 species of snappers have been reported worldwide (retrieved from FishBase), with ten genera and 49 species were documented in Malaysian waters (Abu Bakar, 2017). Snappers from the family Lutjanidae, particularly genus Lutjanus, are commercially important and widely consumed by Malaysians. The worldwide decrease of marine fish population stocks (inclusive of Southeast Asia) has been divulged and documented by many researchers (Pontecorvo and Schrank, 2014; Golden et al., 2016; Teh et al., 2017). Additionally, worldwide trends for marine fisheries have reported that most snappers are collapsing, dwindling, or exhausted (Morris et al., 2000; Pauly et al., 2005; Freitas et al., 2011). Consequently, to restock or recharge the fish resources, fisheries governance is pivotal. It demands the discrimination of fish populations as distinct units or fish stocks. The administration of fish resources unaccompanied by assessment and fish stock discrimination may cause horrific outcomes of depletion in genetic heterogeneity, spawning functions, and capabilities, along with ecological issues (Hilborn and Walters, 2013). The species and their stock identification and evaluation are required for the governance and preservation of fish within the family Lutjanidae. This current study was outlined to portray the genetic diversity of snappers’ genus Lutjanus distributed in Malaysian waters.
2 Materials and methods
2.1 Specimens collections
Red snappers were collected from Malaysian waters (including Sabah, Borneo) that encompasses three marine regions namely Straits of Malacca, west South China Sea (west SCS) and east South China Sea (east SCS) between 2013 and 2015. Samples of red snapper from west Peninsular Malaysia were collected randomly from Kedah (Kuala Kedah), Pulau Pinang (Teluk Bahang), Perak (Kuala Sepetang and Lumut), Selangor (Kuala Selangor and Sungai Besar), Johor (Muar, Mersing and Kong Kong), while samples from east Peninsular Malaysia were obtained from Kelantan (Tok Bali and Kuala Besar) and Terengganu (Pulau Kambing and Chendering). All samples were obtained from the commercial fish landing sites in each location. Some of the samples were supplied by Fisheries Research Institute (FRI) Malaysia. The longitude and latitude coordinates were taken by using Garmin eTrex H Handheld GPS Receiver. All the fishes caught were identified and classified based on their morphological characteristics using Volume 6 Snapper of the world species catalog by Allen (1985) and with the help of local expert taxonomists. All samples were photographed before being transported to the Molecular Ecology Laboratory, Universiti Sains Malaysia, and were kept on ice during transit. All samples were cleaned with running water, drained, and positioned with the left side on a white background flat surface for the highest quality visibility.
2.2 Specimens preparation, preservation, and genomic DNA extraction
The clipped fins (approximately 1–2 cm) of the right pectoral fin were removed. The tissue samples were kept in 1.5 ml tubes holding 95% ethanol. The fresh wet samples contained moisture that might dilute the initial concentration, and the solution was replaced after 24, 48, and 72 h. Ethanol concentration was maintained, and the clipped fin samples were saved for long term storage. Then, voucher samples were secured in formalin (10%) for approximately seven days before being moved into ethanol solutions (70%) for long-term preservation. All voucher specimens were kept at the Zoological Museum of Universiti Sains Malaysia.
Total genomic DNA from the clipped fins was extracted utilizing a high salt extraction technique following the protocol from Animal Genomics Laboratory, University of Liverpool (2001) with some modification on the amount of proteinase -K to enhance the standard of the isolated DNA. The obtained DNA pellet was then washed and eluted with deionized water and visualized by electrophoresis in agarose gel (0.8%) dyed/stained with ethidium bromide (EtBr). The DNA purity was estimated using a spectrophotometer (Quawell, Korea) and fixed at −20 °C until further usage.
2.3 Amplification of DNA and sequencing
The extracted DNA samples have PCR amplified at the cytochrome oxidase subunit I (COI) gene. The DNA amplification was conducted using a set of COI primer developed by Ward et al. (2005): F1 5′-TCA ACC AAC CAC AAA GAC ATT GGC AC-3′ and R1 5′-TAG ACT TCT GGG TGG CCA AAG AAT CA-3′. The COI genes were amplified in a 25 µl volume solution with 2.5 µl buffer, 2.0 µl MgCl2, 1.0 µl dNTPs, 0.5 µl of each primer, 1.5 µl DNA template, and DNA polymerase (1 unit) (i-Taq plus; Intron, South Korea). Thermal cycling settings were 95˚C for 2 min of initial denaturation, followed by 35 cycles of (94˚C for 45 s, 46˚C for 45 s and 1 min at 72˚C) and a final incubation at (72˚C) for 10 min (on a Major Cycler; Major Science). The thermal regime for this gene marker consisted of initial denaturation for 2 min at 95 ˚C, followed by 35 cycles of 45 s at 94 ˚C, 45 s at 47.9 ˚C and 1 min at 72 ˚C and a final extension of 10 min at 72 ˚C. A 2% agarose gel (Vivantis Sdn.Bhd.) stained with ethidium bromide was used to visualize the amplified PCR products to check for the presence of DNA. The PCR products were then purified using Intron Purification Kit (Intron, South Korea) to ensure the outcomes were unencumbered by adulterant or additional suppressors. The purified PCR outcomes were then sent to 1st BASE Sequencing Service Sdn. Bhd. (Malaysia) for sequencing purposes.
2.4 Alignments and data analysis
The obtained sequences were identified in the National Centre of Biotechnology Information (NCBI, available at http://www.ncbi.nih.gov/BLAST) using the BLASTn search tool. In this research, the sequence of the genus Lutjanus previously deposited in Genbank was also used as a reference. The sequences were chosen based on the accessibility of voucher samples published in Genbank and the sequence’s length (greater than300 bp). All sequences were edited by combining the forward and reverse sequences using ClustalW (Thompson et al. 1994) performed in MEGA version X (Kumar et al., 2018). Multiple alignments were then performed with default parameters, and each of the arranged/aligned sequences was subsequently trimmed and synchronized manually in MEGA version X (Kumar et al., 2018). To optimise positional homology, all sequences were painstakingly examined with an eye. Then, gaps/blanks and missing nucleotides in the sequences were withdrawn, and only the top five sequences with nucleotide homology greater than 95% were chosen to be included in further analysis.
2.5 Species identifications and phylogenetic analysis
The Barcoding Gap Analysis tool implemented in BOLD was used to calculate the maximum between species (intraspecies) genetic distance and the mean distance to the Nearest Neighbor (NN) for the species partitioning analysis based on K2P assessments. Both parameters were also plotted to investigate the existence of a barcode gap in our dataset. To correctly identify a species, each sample obtained was occupied in the Automatic Barcode Gap Discovery technique (ABGD) developed by Puillandre et al. (2012). This computational method was depended on the genetic distance system to specify a barcode gap/pause in which it will segregate a presumptive species in the set of data by asserting that inter-and intraspecific genetic distance do not overlap. This method computes distances of all pairwise data and organizes the results in rank. There were two-stage methods employed in ABGD; 1) divide DNA sequence into Operational Taxonomic Units (OTUs) based on a statistically concluded barcode gap (e.g., primary partitioning), and 2) occupy the second series of partitioning (e.g., recursive partitioning). Three critical parameters can be found in ABGD, specifically (1) X , estimation of relative gap width, (2) minimum and (3) maximum values of prior intraspecific divergence, P, which is essential to specify barcode gap. The maximum prior divergence of intraspecific diversity, P in this study, has been formatted cataloging from 0.001 to 0.1 and X = 1.0 because the whole data set will be translated as one species if the P-value was set too high (Puillandre et al., 2012). The assessment of genetic distance was computed following Jukes-Cantor 69 (Jukes and Cantor, 1969) and executed in https://bioinfo.mnhn.fr/abi/public/abgd/abgdweb.html.
A phylogenetic tree analysis has been utilized to draw a graphical depiction of the dissemination of genetic distances between lutjanids taxa to recover the discriminating marker's efficacy. The DNA substitution model that most equipped the data for likelihood-based analysis was chosen using Akaike’s Information Criterion (AIC) with the program MrModeltest 2.4 (Nylander, 2004). Maximum Composite Likelihood (MCL) is the best model for COI in this current research. Based on this model, the Maximum Likelihood (ML) tree was applied using MEGA version X (Kumar et al., 2018) with the MCL method. The MCL is a total of related log-likelihoods. This technique was conducted precisely to resolve the pairwise distance and associated substitution parameters (Tamura et al., 2004). Neighbour Joining (NJ) tree analysis was also conducted to determine the evolutionary relationships of all samples based on the Kimura 2-parameter (K2P) method.
Other sequences from different marine regions were also added in the phylogenetics analysis to acquire robust and more extensive inferences on the evolutionary history of Lutjanus sp. They are Lutjanus erythropterus from Australia (Genebank Accession no.: GU673202 - GU673203), South China Sea (EU595206, EU600114, EU600112, EU600107, EU595214), and Taiwan (KU943881); L. argentimaculatus from Philippines (JN021224), Canada (JF493820) and Australia (DQ885107- DQ885108, GU673900); L. bohar from Australia (EF609394, GU673839, GU673902); L. sebae from Australia (EF609401, GU673269, HQ564451), China (EU600106) and Taiwan (KU943930); L. malabaricus from Australia (BWA995, BWA997, GU673869 - GU673870, GU673867), Philippines (KF009618) and China (EU600115). Bootstrap values for ML and NJ trees were calculated utilizing searches with 1000 replicates. Pristipomoides multidens (Genebank accession no.: MZ317492.1), also known as Goldband, belonged to the family Lutjanidae and was employed to root the ML and NJ tree constructions in the current study.
3 Results
3.1 Sampling data
During the sampling activities, a total of 295 individuals of fish were caught consisting of various species of snappers. Of these, a total of 84 individuals of red snapper were successfully sampled from 13 commercial landing sites in Malaysia (Fig. 1). All specimens were obtained from Kuala Kedah, Kedah (n = 10), Teluk Bahang, Penang (n = 4), Kuala Sepetang (n = 4) and Lumut (n = 1) in Perak, Kuala Selangor, Selangor (n = 14), Kong Kong (n = 10) and Mersing (n = 7) in Johor, Pulau Kambing (n = 5) and Marang (n = 1) in Terengganu, and from Kuala Besar (n = 5) and Tok Bali (n = 8) in Kelantan (Table 1, Fig. 1). Additionally, samples were also collected from two populations from Sabah; Kota Kinabalu (n = 5) and Kudat (n = 10).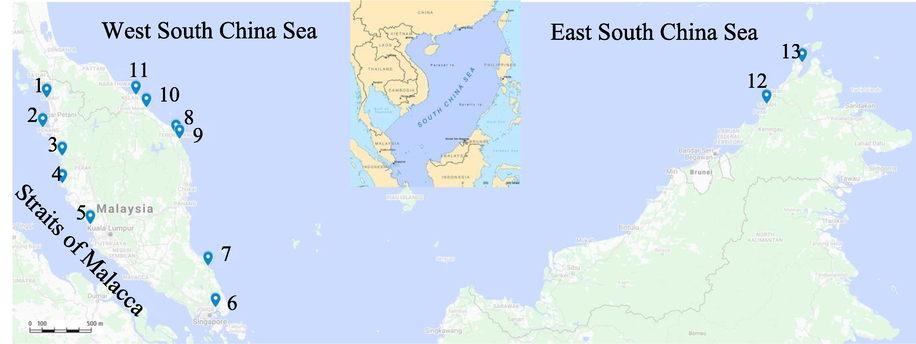
Sampling locations of all lutjanids collected. 1 = Kuala Kedah, Kedah. 2 = Teluk Bahang, Penang. 3 = Kuala Sepetang, Perak. 4 = Lumut, Perak. 5 = Kuala Selangor, Selangor. 6 = Kong Kong, Johor. 7 = Mersing, Johor. 8 = Pulau Kambing, Terengganu. 9 = Marang, Terengganu. 10 = Tok Bali, Kelantan. 11 = Kuala Besar, Kelantan. 12 = Kota Kinabalu, Sabah. 13 = Kudat, Sabah.
No
Marine region
Sampling localities
GPS Coordinates
Species
Sample size (N)
1
Straits of Malacca
Kuala Kedah, Kedah
6°6′82″ N, 100°17′00″ E
Lutjanus malabaricus
10
2
Teluk Bahang, Pulau Pinang
5°27′38″ N, 100°12′63″ E
Lutjanus malabaricus
4
3
Kuala Sepetang, Perak
4°50′72″ N, 100°37′66″ E
Lutjanus malabaricus
3
Lutjanus argentimaculatus
1
4
Lumut, Perak
4°14′58″ N, 100°40′17″ E
Lutjanus erythropterus
1
5
Kuala Selangor, Selangor
3°20′55″ N, 101°15′98″ E
Lutjanus malabaricus
10
Lutjanus argentimaculatus
4
6
West South China Sea
Kong Kong, Johor
1°30′46″ N, 104°0′0.9″ E
Lutjanus argentimaculatus
10
7
Mersing, Johor
2°26′38″ N, 103°50′61″ E
Lutjanus malabaricus
5
Lutjanus sebae
2
8
Pulau Kambing, Terengganu
5°19′19″ N, 103°7′43″ E
Lutjanus malabaricus
4
Lutjanus sebae
1
9
Marang, Terengganu
5°12′83″ N, 103°746.37″E
Lutjanus malabaricus
1
10
Tok Bali, Kelantan
5°53′22″ N, 102°28′23″ E
Lutjanus malabaricus
8
11
Kuala Besar, Kelantan
6°12′22″ N, 102°14′11″ E
Lutjanus malabaricus
5
12
East South China Sea
Kota Kinabalu, Sabah
5°58′40″ N, 116°4′22″ E
Lutjanus argentimaculatus
5
13
Kudat, Sabah
6°52′57″ N, 116°51′3.9″ E
Lutjanus argentimaculatus
7
Lutjanus bohar
2
Lutjanus erythropterus
1
Total
84
3.2 Identification of species and dissemination
Of the 84 individuals of red snapper obtained, approximately 90% individual snappers were indisputably assigned to five putative taxa based on their morphological characteristics; Lutjanus malabaricus, L. argentimaculatus, L. sebae, L. bohar and L. erythropterus. Lutjanus malabaricus was the most common commercial red snapper across sampling localities (69.2%), while L. bohar was the fewer species encountered (7.7%) (Table 1).
All the DNA samples were successfully amplified for the COI gene and generated 613 bp fragments, which implies that the COI gene executed full results (100%) in amplification reactions. For each species, computation of the partial COI sequence by BLAST analysis has revealed the individual’s total number; Lutjanus malabaricus (n = 50), L. erythropterus (n = 2), L. sebae (n = 3), L. bohar (n = 2), and L. argentimaculatus (n = 27) (Table 1).
Nearly all sequences were in agreement with their Genbank counterparts, illustrating the reliability of the Lutjanid species description technique. We found that L. malabaricus is the most scattered species (59.5%, n = 84) in which they appeared across all sampling localities except in Sabah. There are 27 individuals of L. argentimaculatus identified in this study. This species occurs in most of the sampling localities but was not present in Kelantan and Terengganu, both located on the east coast of Peninsular Malaysia. Our data manifests that the total number of L. sebae (n = 3), L. erythropterus (n = 2) and L. bohar (n = 2) acquired are extremely low when compared to other species obtained in this study (Table 1).
3.3 Sequence information
In this study, a total of 112 sequences (84 from the current study and 28 retrieved from Genbank) of various Lutjanids species were analyzed. All samples were successfully amplified and cross-referenced to the Genbank systems. Most sequences exhibited more than 98% identity to the species sequences from the Genbank database as had been morphologically determined. Notwithstanding, two specimens were morphologically identified as L. erythropterus were genetically identified as L. malabaricus, making up a total of 50 individuals of L. malabaricus compared to only 48 individuals from initial morphological identifications.
Generally, a consensus length of 613 bp of COI gene was used for this study. The examined sequences were grouped into several haplotypes for each locality, initiating a consolidated 40 unique haplotypes, and four were shared haplotypes (H1, H2, H6, H11; 10%, n = 40) (Table 2). Haplotype 2 recorded the highest distribution frequency with 12 individuals. All the shared haplotypes were distributed across the two marine regions (SM and west SCS) except H11. H11 was distributed only within the west SCS (Mersing, Johor and Pulau Kambing, Kelantan). This research also revealed the occurrence of two unique haplotypes (H15 and H16) in the east SCS and distributed within Kudat (Sabah) sampling area only (Table 2). Note: KK = Kuala Kedah, TB = Teluk Bahang, KSP = Kuala Sepetang, LP = Lumut, KS = Kuala Selangor, KKJ = Kong Kong, MJ = Mersing, PK = Pulau Kambing, KB = Kuala Besar, TB = Tok Bali, KK = Kota Kinabalu, KD = Kudat, MR = Marang
Haplotype ID
KK
TB
KSP
LP
KS
KKJ
MJ
PK
KB
TB
MR
KK
KD
Total
H1
1
1
1
1
4
H2
3
2
1
1
1
2
10
H3
1
1
H4
1
1
H5
1
1
H6
1
3
4
H7
1
1
H8
1
1
H9
1
1
H10
1
1
H11
1
1
2
H12
1
1
H13
1
1
H14
1
1
H15
1
1
H16
1
1
H17
2
2
H18
1
1
H19
1
1
H20
1
1
H21
1
1
H22
1
1
H23
1
1
Total
7
4
6
8
4
9
2
40
A total of 168 sites were parsimonious informative, 327 conserved areas, and 17 synonymous sites. The pronounced number of parsimony-informative sections denote that using the COI gene for Lutjanids identification is relevant, and it is a practical mtDNA gene marker for phylogenetic studies and depiction of marine fish (Kamarudin et al., 2011). Furthermore, it is a promising marker for population divergence and genetic structure studies. No insertions, deletions, stop codon or heterozygous sites were detected in all sequences analyzed. Therefore, the whole amplified sequences in this current study illustrate effective mtDNA COI sequences.
3.4 Genetic distances and species partitioning
Genetic distances within and between species for all five species examined was outlined in Table 3. The lowest intraspecific genetic distance can be seen in L. bohar (0.1%), while the highest intraspecific genetic distance was exhibited by L. erythropterus (0.7%). The highest interspecific variation was between L. sebae and L. bohar (19.6%), while the lowest was between L. malabaricus and L. erythropterus (8.2%). Generally, genetic distances between species were significantly higher (8.2% – 19.6%), declaring that all species analysed were genetically separated (Table 3). In contrast, a considerably low intraspecies genetic distance was identified, ranging from 0.001 to 0.007, indicating that our dataset eliminated cryptic species (Table 3). These results were further supported by the Barcoding Gap Analysis assessments implemented in BOLD, whereby the lowest and highest values of interspecies genetic distances were 10.5% and 17%, respectively (Table 4). There was a barcode gap that successfully recognized all species based on COI distance (Table 4). For the five species investigated in this study, the highest intraspecific divergence (%K2P) was plotted as opposed to the nearest neighbor distance (%K2P), revealing that all of them have a barcode gap (Fig. 2). Note: N = Number of samples, NN = Nearest neighbour distances, NNS = Nearest neighbour species
1
2
3
4
5
1
Lutjanus argentimaculatus
0.002
2
Lutjanus bohar
0.177
0.001
3
Lutjanus erythropterus
0.170
0.175
0.007
4
Lutjanus malabaricus
0.168
0.179
0.082
0.002
5
Lutjanus sebae
0.183
0.196
0.162
0.153
0.001
Species
N
Max Intraspecific
Mean Intraspecific
NN
NNS
L. malabaricus
50
1.9
0.6
10.5
L.erythropterus
L.erythropterus
2
0.5
0.4
10.5
L. malabaricus
L. bohar
2
0.6
0.5
17.3
L.erythropterus
L. sebae
3
0.5
0.3
15.3
L. malabaricus
L. argentimaculatus
27
1.5
0.4
17
L.erythropterus
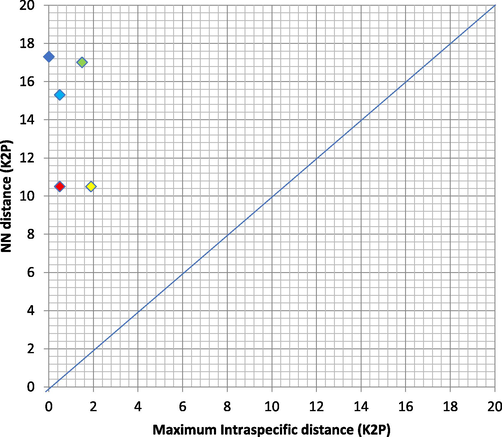
Maximum intraspecific divergence (% K2P) plotted against nearest neighbor distance (% K2P) for the five species examined in this study. Point above the line indicate species with a barcode gap.
As demonstrated in Fig. 3, the number of species disclosed by ABGD varied depending on the variation prior thresholds used, which ranged from 0.0010 to 0.1 previous intraspecific divergences (P). All sequences were partitioned into 28 different species at the lowest threshold values, which ranged from 0.0010 to 0.0017. Within a threshold ranging from 0.0046 to 0.0599, five species were clustered.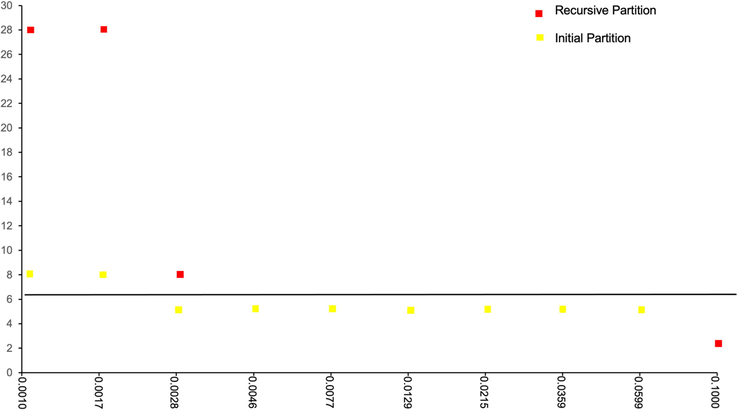
The number of partitions derived in each prior threshold for barcode gap analysis of COI sequences implemented in ABGD based on Jukes-Cantor 69 method (Jukes & Cantor, 1969).
3.5 Phylogenetic analysis
Five monophyletic groups correspond to L. malabaricus, L. sebae, L. argentimaculatus. L. bohar and L. erythropterus as deduced by BLAST, were generated from NJ (Fig. 4) and ML (Fig. 5) phylogenetic relationship trees. Both trees show a high percentage of bootstrap values that supported all the clustered species. We found no clear pattern displayed by both trees in terms of species division based on the sample's localities and/or marine regions indicated a high intraspecies genetic homogeneity. Interestingly, L. erythropterus exhibited the presence of two subgroups (west SCS and east SCS) in concordance with the genetic distance data for both trees. There are a few sequences from Genbank demand further taxonomic elucidation. Specifically, L. erythropterus specimens (Genbank accession number: KU943881, EU595206, EU60014, EU600112, EU595214, and EU600107) were failed to form their monophyletic groups. Conversely, they are grouped together with L. malabaricus obtained from different localities in this study, as depicted by the NJ tree (Fig. 6). Likewise, the sequence of L. malabaricus (Genbank accession number: KF009618) from the Philippines was exhibited high genetic differentiation (data not shown) and depicted as the common ancestor of L. erythropterus and L. malabaricus (Fig. 6).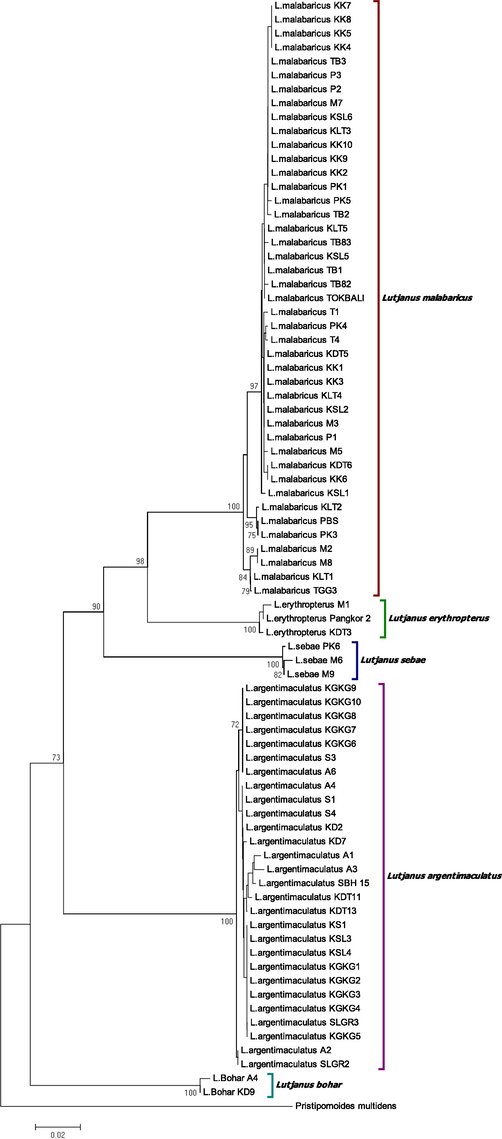
Molecular phylogeny inferred from a Neighbour-joining approach (Kimura 2-parameter method). Only bootstrap values (1000 replicates) greater than 50% are shown.
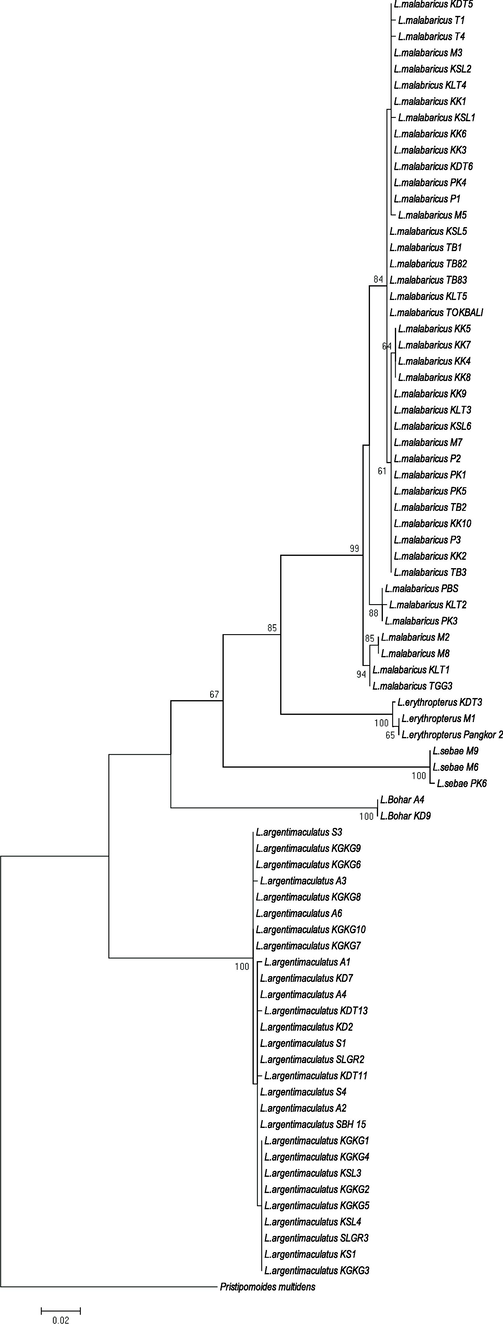
Molecular Phylogeny inferred from a Maximum Likelihood and BI COI gene phylogenetic tree approach (Maximum Composite Likelihood method). Only bootstrap values (1000 replicates) greater than 50% are shown.
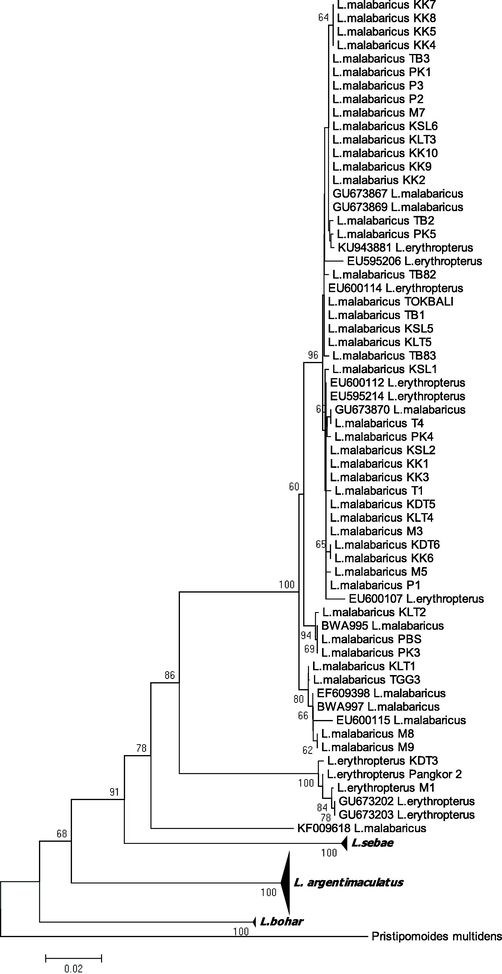
NJ phylogenetic relationships (K2P) of combined species in the present study and GenBank and BOLD sequences from various geographical regions. Only representatives of each species are shown. The detailed NJ phylogenetic trees are presented below according clusters. Bootstrap values (1000 replicates) greater than 50% are shown.
4 Discussion
This study has not only been efficiently confirmed the mtDNA COI data for five different species of Lutjanidae spp., yet provided insight into the genetic makeup of lutjanids that occurs in Malaysian marine regions. Comprehensively, all species examined displayed conformity with taxonomic division or demarcation line explored within the current study.
The high number of informative and parsimonious segments revealed in this research reflected the efficacious COI genes marker as a potential locus for taxonomy and phylogenetic studies. A parsimony-informative site is a region with no fewer than two different character states for the sequence (Saha et al. 2020). These particular sites consist of at least two types of nucleotides, and at least two of them exist with a minimum frequency which is essential for the fewest evolutionary changes in the genome (Saha et al. 2020).
Fig. 3 depicts the species partitioning data (DNA barcode) shown by ABGD assessment. The species relatedness demonstrated by both trees; neighbour-joining (NJ) (Fig. 4) and maximum likelihood (ML) (Fig. 5), corresponded (five distinct groups) with the earlier studies conducted by Wang et al. (2010) that demonstrated an identical species lineage and relatedness of lutjanids utilizing mtDNA COI markers. Likewise, the intra- and interspecific genetic distances of all samples analyzed (Table 3) further substantiated the results. This shows that, indubitably, the description of genetic analogous of a species based on the morphological characteristics suggested by Allen (1985) on lutjanids was advantageous.
There is no clear pattern of genetic structure and/or population differentiation in all species examined. This has been evidenced by the occurrence of shared haplotypes (Table 2) throughout the expanse of the marine regions where the specimens were obtained (i.e., SM and west SCS). This manifests that populations from different marine areas, especially L. argentimaculatus, either interchange their genetic information unreservedly or have done so recently. Lutjanids have a pelagic egg and/or larval phase that survives for several weeks (D'Alessandro et al., 2010). Thus, it is postulated that the principal process that influenced the association between populations from SM and west SCS marine regions (haplotype sharing) in this current study is the dissemination of the pelagic larval phase (see, e.g., Richardson et al., 2009; D’Alessandro et al. 2010). Although larval dispersal is not the primary concern in this current study, however, there are many researchers have recorded that larval dispersal probably affected by several elements in the aquatic environment such as the behavior of larvae, currents, distribution patterns, mortality, and growth (D'Alessandro et al. 2010).
While genetic homogeneity occurred among population and species across SM and west SCS, however, significant genetic structuring was detected among species between west and east SCS as evidenced by the occurrence of a single species, L. bohar (n = 2) that can be found only in Sabah (east SCS) (Table 1) and represented by two unique haplotypes (Table 2). This divulged potential loss of gene flow among the regions and was probably caused by oceanic currents (Jian et al., 2000; Shankar et al., 2002). Past demographic changes (i.e., fluctuations in sea level and appearance of shallow corridor between SM, west, and east SCS) occurred in the late Pleistocene (Bird et al. 2005), which restricted free movement between marine organisms be the cause of this event. We also agreed that this phenomenon might have been derived from an incomplete sampling effort across the maritime region (east SCS) as there were only two individuals caught throughout the sampling period.
The branching patterns of NJ (Fig. 4) and ML (Fig. 5) phylogenetic trees were incompatible and incongruence, whereby L. bohar was placed at the base terminal closed to the outgroup species (P. multidens) for NJ tree (Fig. 4). Meanwhile, they are positioned near L. sebae in ML tree (Fig. 5). The incongruence of the phylogenetic tree is one of the major obstacle faced by researchers using phylogenetic data, and there remains little agreement concerning how to undoubtedly resolve differences, especially when the inconsistent tree topologies have high statistical support (Freitas et al., 2021). Generally, when a phylogenetic dataset is separated into smaller partitions, every tree generated will have a different structure or topologies. Thus, two deductions can be made from this phylogenetic discord (incongruence); 1) the phylogenetic trees are accurate, and the different partitions have undergone discrete evolutionary histories, and 2) all or some of the trees are incorrect, and the partitions share the same history (Planet, 2006). The former explanation is probably the most accurate in our case as the bootstrap values supporting the branch of L. bohar in both trees are high.
The purpose of NCBI and BOLD databases is to provide a platform for documentation of world biodiversity and also provide reference sequences for comparison in the case of newly discovered species. In the current study, seven sequences were found to be ambiguous in nature (Fig. 6). The clustering of unidentified or wrongly identified sequences within their respective actual groups is one of the significant outcomes of phylogenetic trees. It was exemplified in this study where a few sequences did not cluster into the expected clades but instead into other species clades, suggesting misidentified voucher specimens in the databases. Lamendin et al. (2015) also highlighted several misidentified sequences of family Lutjanidae, especially L. malabaricus and L. erythropterus, submitted in BOLD and NCBI databases. It is a common mistake due to research being conducted at multiple laboratories worldwide and dealing with a large number of datasets.
Additionally, hybridization probably occurred between both species, leading to species misidentification (Lamendin et al., 2015). In parallel, it is worth mentioning that the expansion of molecular and genomic methods has surged the variation of classifications rather than minimizing the problems or complexities of species misidentifications. Accordingly, many key nodes continue to exist and are undetermined. As a result of this, species misidentifications occurred in this current study possibly not caused by the methods or techniques that have been used but be potentially attributable to an unknown or undesignated node. Thus, an urgent need to revise taxonomic status and detailed biogeographical studies (that were not included in the scope of the current research) is required to investigate deeper insights into the family Lutjanidae.
5 Conclusion
Five species from genus Lutjanidae from Malaysian waters (L. malabaricus, L. argentimaculatus, L. bohar, L. sebae and L. erythropterus) were successfully recognized molecular approaches at one single mtDNA gene, namely COI. Utilizing the BLAST assessment and genetic distance approaches as extrapolated by the phylogenetic trees and species partitioning analysis (ABGD), our research proposed that COI is the valid and reliable genetic marker for identifying lutjanids distributed across Malaysian waters. Future revision in distribution pattern and diversity exploration on a large scale with a higher number of samples and different genetic markers are needed to fill the gaps of the current study.
Acknowledgment
The authors would like to express their heartfelt gratitude to everyone who helped in specimen collections. Universiti Sains Malaysia, Penang, Malaysia funded the study through the Research University Grant (1001/PBIOLOGI/8011068). This research was also partially funded by Ministry of Education & Culture of the Republic of Indonesia through “Kampus Merdeka” competitive project (contract number 600/E1.1/KM.05.03/2021). The authors (SM and KAAG) express their sincere appreciation to the Deanship of Scientific Research at the King Saud University for its funding of this research through the Research Group Project No. RG-1440-138.
Author contribution statement
LJH and DMN established the theoretical formalism, performed the analytic calculations and numerical simulations. IR, SM and KAG contributed to the final version of the manuscript.
Declaration of Competing Interest
The authors declare that they have no known competing financial interests or personal relationships that could have appeared to influence the work reported in this paper.
References
- DNA barcoding of Malaysian marine fish, phylogenetics and phylogeography of the snappers (Perciformes: Lutjanidae) Universiti Sains Malaysia. 2017:165.
- [Google Scholar]
- Allen, G.R. 1985. FAO species catalogue. v. 6: Snappers of the world. An annotated and illustrated catalogue of Lutjanid species known to date. FAO.
- Palaeoenvironments of insular Southeast Asia during the Last Glacial Period: a savanna corridor in Sundaland? Quat. Sc. Rev.. 2005;24(20):2228-2242.
- [Google Scholar]
- Systematic synopsis of Chinese fishes. Science Press Beijing; 1987.
- Geometric morphometrics support the proposed molecular taxonomy for three Eucinostomus species (Perciformes: Gerreidae) along the coasts of Mexico. Zoomorphol.. 2015;134(1):125-134.
- [Google Scholar]
- Larval ecology of a suite of snappers (family: Lutjanidae) in the Straits of Florida, western Atlantic Ocean. Mar. Ecol. Prog. Series.. 2010;410:159-175.
- [Google Scholar]
- Feeding ecology of Aucheni- pterichthys longimanus (Siluriformes: Auchenipteridae) in a riparian flooded forest of Eastern Amazonia. Brazil. Neotrop. Ichthyol.. 2011;9(3):629-636.
- [Google Scholar]
- Partitioned Gene-Tree Analyses and Gene-Based Topology Testing Help Resolve Incongruence in a Phylogenomic Study of Host-Specialist Bees (Apidae: Eucerinae) Mol. Biol. Evol.. 2021;38:1090-1100.
- [Google Scholar]
- Biological identifications through DNA barcodes. Proc. R. Soc. Lond. B.. 2003;270:313-321.
- [Google Scholar]
- Arterial-venous segregation by selective cell sprouting: an alternative mode of blood vessel formation. Science.. 2009;326(5950):294-298.
- [Google Scholar]
- Quantitative fisheries stock assessment: choice, dynamics and uncertainty. Springer Science & Business Media; 2013.
- Identifying Canadian freshwater fishes through DNA barcodes. Plos ONE.. 2008;3:e2490
- [Google Scholar]
- Holocene variability of the Kuroshio current in the Okinawa trough, Northwestern pacific ocean. Earth Planet. Sci. Lett.. 2000;184(1):305-319.
- [Google Scholar]
- Evolution of Protein Molecules. New York: Academic Press; 1969. p. :21-132.
- Molecular phylogeny of Holothuria (Mertensiothuria) leucospilota (Brandt 1835) as inferred from cytochrome c oxidase I mitochondrial DNA gene sequences. Sains Malaysiana. 2011;40(2):125-133.
- [Google Scholar]
- Geometric morphometrics, Fourier analysis of otolith shape, and nuclear-DNA markers distinguish two anchovy species (Engraulis spp.) in the Eastern Mediterranean Sea. Fish. Res.. 2014;159:45-55.
- [Google Scholar]
- MEGA X: Molecular Evolutionary Genetics Analysis across computing platforms. Mol. Biol. Evol.. 2018;35:1547-1549.
- [Google Scholar]
- Labelling accuracy in Tasmanian seafood: an investigation using DNA barcoding. Food Control.. 2015;47:436-443.
- [Google Scholar]
- The threatened status of groupers (Epinephelinae) Biodivers. Conserv.. 2000;9:919-942.
- [Google Scholar]
- Nylander, J.A.A. 2004. MrModeltest v2. Program distributed by the author. Evolutionary Biology Centre, Uppsala University.
- Marine fisheries systems. In: Hassan R., Scholes R., Ash N., eds. Ecosystems and human well-being: current states and treds. Vol Vol. 1‘. Washington: Millenium Ecosystem Assessment and Island Press; 2005. p. :477-511.
- [Google Scholar]
- Tree disagreement: Measuring and testing incongruence in phylogenies. J. Biomed. Informatics.. 2006;39(1):86-102.
- [Google Scholar]
- The continued decline in the world catch of marine fish. Marine Policy.. 2014;44:117-119.
- [Google Scholar]
- ABGD Automatic Barcode Gap Discovery for primary species delimitation. Mol. Ecol.. 2012;21:1864-1877.
- [Google Scholar]
- Importance of the Straits of Florida spawning ground to Atlantic sailfish (Istiophorus platypterus) and blue marlin (Makaira nigricans) Fish Oceanogr.. 2009;18:402-418.
- [Google Scholar]
- Genomic exploration light on multiple origin with potential parsimony-informative sites of the severe acute respiratory syndrome coronavirus 2 in Bangladesh. Gene Rep.. 2020;21:100951.
- [CrossRef] [Google Scholar]
- The monsoon currents in the north Indian Ocean. Prog. Oceanogr.. 2002;52(1):63-120.
- [Google Scholar]
- Tamura, K., Nei, M., Kumar, S. 2004. Prospects for inferring very large phylogenies by using the neighbor-joining method. Pro. Nat. Acad. Sci. 101, 11030-11035.
- What is at stake? Status and threats to South China Sea marine fisheries. Ambio.. 2017;46(1):57-72.
- [Google Scholar]
- CLUSTAL W: improving the sensitivity of progressive multiple sequence alignment through sequence weighting, position-specific gap penalties and weight matrix choice. Nuc. Acids Res.. 1994;22(22):4673-4680.
- [Google Scholar]
- DNA barcoding, phylogenetic relationships and speciation of snappers (genus Lutjanus) Sci. China. Life. Scie.. 2010;53(8):1025-1030.
- [Google Scholar]
- DNA barcoding Australia’s fish species. Phil. Trans. R. Soc. B.. 2005;360:1847-1857.
- [Google Scholar]
- Using DNA barcoding to track seafood mislabeling in Los Angeles restaurants. Conserv. Biol.. 2017;31(5):1076-1085.
- [Google Scholar]


