

Translate this page into:
Photocatalytic degradation of an organic dye using Ag doped ZrO2 nanoparticles: Milk powder facilitated eco-friendly synthesis
⁎Corresponding authors. asadsayyed@gmail.com (Asad Syed), nagarajugn@sit.ac.in (G Nagaraju)
-
Received: ,
Accepted: ,
This article was originally published by Elsevier and was migrated to Scientific Scholar after the change of Publisher.
Peer review under responsibility of King Saud University.
Abstract
Silver doped zirconium oxide nanoparticles were synthesized using milk powder via single step solution combustion method and has been examined for the removal of toxic chemicals from an organic dye. Ag doped ZrO2 were intended to play a vital role in the removal of accumulated contaminants in aqueous environment due to high efficiency of visible light triggered photocatalytic activity. The obtained product was analyzed by X-ray diffraction (XRD), Fourier transform infrared (FTIR) spectroscopy, UV–Vis spectroscopy, BET measurements and Scanning electron microscopy (SEM). XRD and FTIR investigation probe the occurrence of silver in the synthesized final nanoparticles. The calculated average crystallite size is about 10–16 nm. Pure ZrO2 and Ag doped ZrO2 nanoparticles were analyzed against Rhodamine B (Rh B), a cataionic dye in visible light irradiation. By the analysis of experiments, silver (6 mol %) doped ZrO2 shows good photocatalyst towards 95% of Rhodamine B degradation with 150 mg photocatalyst and 10 ppm dye within 105 min.
Keywords
Ag doped ZrO2
Phototocatalysis
Rhodamine B
BET
Green synthesis
Milk powder

1 Introduction
Premier source of water pollution is discarded waste water from textile industries using different dye stuffs (Khataee and Kasiri, 2010). Various abnormal properties can occur in chemical and biological activities during the consumption of dissolved oxygen in aqueous species. In addition, dyes have more toxicity, which puts endanger for water bodies (Khataee et al., 2009). The available conventional methods used to treat textile contaminant involve a variety of physical, biological, and chemical procedures. Cutting-edge treatment modalities will include physico-chemical principles established on adsorption, electro/chemical coagulation, advanced chemical oxidation, nano filtration and sedimentation (Azeez et al., 2018). In general, all these approaches such as ozonization, chlorination and filtration have their own limits for the alleviation of dye degradation and these will come across many drawbacks includes high energy-waste, costlier and the secondary pollutants by-products in the treatment process. Heterogeneous photocatalysis by semiconductor nanoparticles are very encouraging tool for the removal of environmental contaminants. Inorganic metal oxide semiconductors show excellent photo catalytic behavior for elimination of organic contaminants from waste water. In the visible region, photocatalytic degradation process occurs between the interaction of the photocatalyst and photons of the light source. A set of oxidation–reduction (redox) reactions between active species produced from a photocatalyst by lighting the organic pollutants. Primarily the oxidation/ photomineralisation species are CO2, H2O, NO3–, PO43- ions and halides (Vautier et al., 2001).
Exploring the fascinating properties of nanomaterials in the field of waste water treatment is an attractive research area. ZrO2 nanoparticles (NPs) have been studied widely by many researchers due to its various promising applications, viz oxygen sensors, solid state electrolytes for fuel synthesis, optical, electronic devises and as organic dyes/industrial effluents degrading photocatalyst owing to its higher mechanical strength, chemical and photochemical stability which is widely used in (Jiang et al., 2005). ZrO2 is also very stable, efficient photocatalyst and belongs to n-type semiconductor, displays abundant oxygen vacancies on its surfaces are capable to generate the large number of holes tends to better oxidation process, moderate band gap energy (5 eV) (Capek 2004). Enhancement of photocatalytic activity by surface modification can be achieved by doping with transition elements. Silver metal nanoparticles are active and susceptible to coalesce owing to vander Waals forces and more surface energy. This also alters the availability of reacting molecules to the metal particles and even affects the catalytic reaction mechanism. Many transition metals such as Zn, Fe, Mg, Pd, Pt etc. have been used as dopants to metal oxide and studied for photocatalytic applications (Chang and Doong 2007).
Herein, various procedures have been adopted for the synthesis of Ag doped ZrO2 NPs namely homogeneous precipitation, sol–gel emulsion, hydrothermal process (Chen et al., 2001) etc. However, many reports mentioned that low temperature hydrolysis process was an attractive due to inexpensive raw materials and simplicity of the process (Aruna and Mukasyan, 2008). During the synthesis of ZrO2, high temperature and costly raw materials are used, but combustion method seems to be very effective and simple, where an organic fuel is used to start the decomposition of metal precursor with moderate temperature (Maliyekkal et al., 2010). Recent study reveals that Ag nanoparticles had incorporated into numerous materials to observe the enhanced properties (Duan et al., 2006).
Recent data indicates there is a strong trend of employing plant extracts and microorganisms for the fabrication of NPs, which are environmental friendly and cost effective (Ghosh et al., 2010). Instead of using conventional fuels such as glucose, urea, glycine, citric acid for the combustion method, we have used carbohydrates rich milk powder as fuel for the synthesis.
In this study we have used Amul milk powder as fuel for the synthesis of pure ZrO2 and Ag doped ZrO2 NPs. Amul is a dairy company which is number one in making dairy products in India. Each 100 g of milk powder contains 20 g milk fat, 20 g milk protein, 50 g carbohydrates and 5 g minerals (Amul, 2019).
2 Materials and methods
2.1 Materials
Analytical graded chemicals were employed in this study such as Zirconyl nitrate hydrate [ZrO(NO3)2:XH2O] and Silver nitrate (AgNO3). Amul brand milk powder was purchased from local store located at Tumkur, Karnataka, India. Received chemicals were directly used for experimental work without any analysis.
2.2 Synthesis of ZrO2 and Ag doped ZrO2 NPs
ZrO2 NPs were produced by low temperature combustion method using Amul brand milk powder as fuel. In this method, zirconyl nitrate (Zr(NO3)2) was mixed with optimal amount of milk powder as a fuel followed by the addition of 10 mL double distilled water to the mixture. The reaction mixture was agitated for 10 min to get the homogeneous solution. This was transferred into a silica crucible, placed in a preheated muffle furnace maintained at 400 °C. At this temperature the reaction mixture begins to boil, a type of smoldering reaction takes place and nanocrystalline material was obtained within 10 min. Experiment was repeated for the preparation of Ag doped ZrO2 NPs where stoichiometric amount of Zn(NO3)2 was mixed with AgNO3 (2 mol%, 4 mol% and 6 mol%) with equivalent amount of milk powder as a fuel. All the obtained products were further calcined to 600 °C for 3 h to get impurity free ZrO2 NPs and Ag doped ZrO2 NPs.
2.3 Characterization technique and equipment
The prepared NPs were analysed by Shimandzu 7000 Philips X-pert pro X-ray diffractometer with Cu-Kα radiation (λ = 0.15418 nm) at 40 kV, 30 mA for the crystal structure and phase analysis. Structural analysis was carried out using Fourier transform infra-red (FTIR) spectrophotometer (Bruker alpha-P). The surface morphology was observed using scanning electronic microscopy (SEM, EVO LS 15) and the size of the particles was estimated by transmission electronic microscopy (TEM, Jeol-JEM 2100). The Energy Dispersive X-Ray spectroscopy (EDAX) was recorded on ZAF smart quant. Surface area and pore diameter were measured by Quanta Chrome Nova-1000 surface analyzer under liquid nitrogen temperature. Adsorption-desorption isotherm studies were performed to analyze the textural and porosity properties. BJH (Barrett-Joyner-Halenda) method was used to calculate pore diameter, pore volume and surface area. Band gap was determined by UV–Visible Diffuse Reflection Spectroscopy (UV-Vis DRS) using LABINDIA UV–VIS Spectrophotometer (Model:UV 33092).
2.4 Photocatalytic activity
ZrO2 and different mole ratio of Ag doped ZrO2 NPs were subjected to investigate the photocatalytic behavior for Rhodamine B dye degradation, an exemplary pollutant. The photocatalytic experiments were performed using a glass photocatalytic reactor with light source of 125 W visible lamp at room temperature. Known concentration of the organic dye (100 mL) was mixed with a known quantity of photocatalyst and the solution was taken in a batch reactor of size 150 × 75 and the distance between the sample and light source was 18 cm. The adsorption–desorption equilibrium between the dye solution and catalyst was obtained by constant stirring of mixture for 30 min in dark. Then the solution was placed for visible light irradiation, supernatant liquid was collected at regular intervals. The dispersed catalyst was removed using spinwin micro centrifuge and the dye concentration remaining at a particular interval of time was evaluated using UV–Visible spectrophotometer.
The percentage of photocatalytic dye degradation was determined using the formula
3 Results and discussion
3.1 XRD pattern of ZrO2 and Ag doped ZrO2 NPs
Fig. 1 depicts the powered XRD pattern of ZrO2 NPs and Ag doped ZrO2 NPs, prepared by combustion process using milk powder as fuel. It is confirmed by the XRD pattern, that the prepared ZrO2 particles are in cubic form (space group: Fm-3m) and shows the presence of silver. The obtained XRD pattern matches with standard JCPDS card no.: ID 81-1551. All the diffraction peaks appeared are characteristic peaks of cubic phase ZrO2. The crystalline size is assessed using Debye-Scherrer’s formula.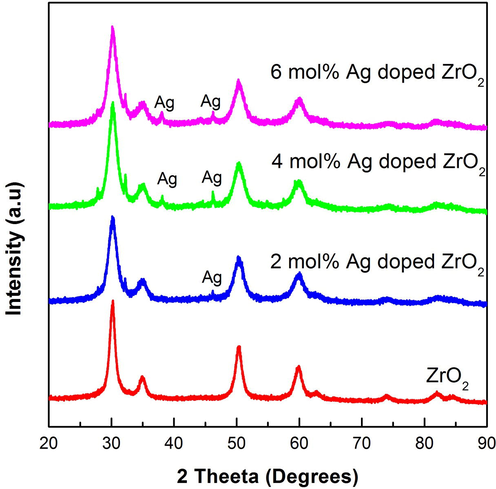
XRD pattern of ZrO2 and Ag: ZrO2 doped NPs.
3.2 Fourier transform infrared (FTIR) spectroscopy
Fig. 2 shows the FTIR spectra for ZrO2 and Ag doped ZrO2NPs, recorded at 400–4000 cm−1 range. The main absorption band appeared at 460 cm−1 is because of deformation mode of Zr-O-Zr bond (Kumar et al., 2014), the peak at 1389 cm-1corresponds to O–H bending, peaks at 1007 and 1114 cm−1 due to stretching vibrations of Zr-O terminal group (non bridging) (Behnajady et al., 2006). The peak at 1600 cm−1 can be corresponds to symmetric bending of H2O, and the band at 2360 cm−1 is due to the stretching vibrations of C–O in absorbed CO2 from atmosphere. The wide band at 3426 cm−1 is assigned to stretching vibration of O–H group of water. It has been observed that as the increase in the dopant (Ag) concentration, the peaks are shifted towards lower wave number region.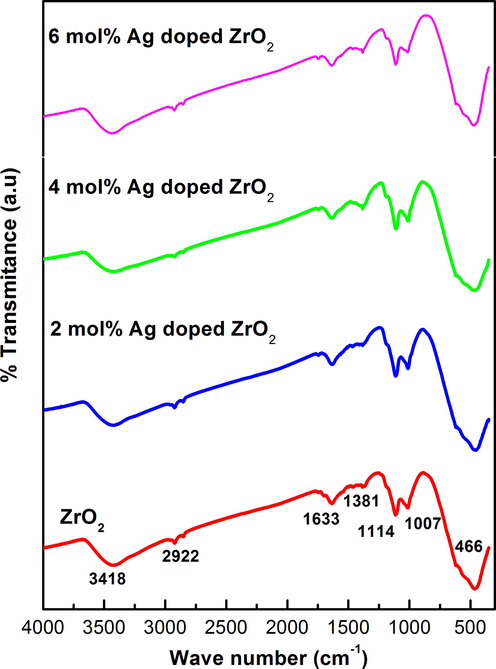
FTIR spectra of ZrO2and Ag: ZrO2 doped NPs.
3.3 UV–Visible absorption study and optical energy band gap calculation
The UV–Visible DRS is a useful method to analyze the optical properties of semiconductor nanomaterial at room temperature. Fig. 3a displays the DRS spectrum of bare ZrO2 and 6 mol% Ag doped ZrO2 NPs. The peak at 240 nm and 252 nm in case of Ag doped ZrO2 and ZrO2 NPs respectively, is owing to the transition of electrons between valance band and conduction band (Dong et al., 2009). The absorption edge shifts towards higher wavelength (red shift) with increase in the concentration of dopant. Ie, spectrum also reveals a weak reflection in near UV–Visible region, which is due to the transition of extrinsic state such as surface traps (Shivaram et al., 2013). This could be assigned to absorption of host lattice. Band gap (Eg) is estimated using Kubelka-Munk (K-M) theory. Fig. 3b explains the intercept of the tangents of photon energy versus [F(R∞)hν]1/2. The K-M function F (R∞) and photon energy (hν) are calculated by following equations.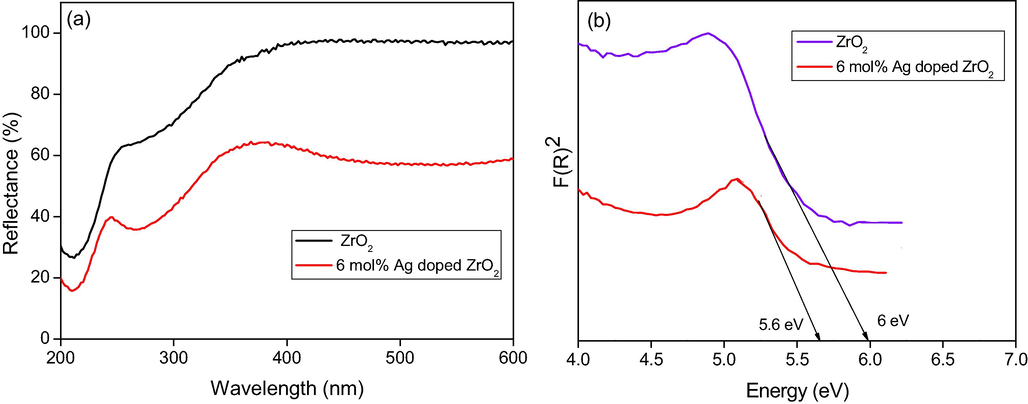
(a) Diffuse reflectance spectra (b) Band gap energy ZrO2 and 6 mol% Ag doped ZrO2 NPs.
3.4 Morphological (SEM) and EDAX studies
Fig. 4 portrays the SEM morphological studies of ZrO2 and Ag doped ZrO2 NPs with 1 μm scale. The images indicated the few particles are spherical and combined to form irregular shaped monocrystal clusters. As the increase in dopant concentration, the porous nature increases, and also found that the particles were merged together and agglomerated during the synthesis. The roughness and cracks on the surface indicating the porous nature of the prepared Ag doped ZrO2 NPs compared to bare NPs. The EDAX data of ZrO2 and Ag doped ZrO2 NPs are revealed in Fig. 5. The NPs shown the characteristic peaks of Zr and oxygen at 0.2, 2.0 and 16 keV, and also the NPs shown peaks of calcium and magnesium at 3.69 keV and 1.25 keV respectively, as milk powder contains these minerals (Soltani and Entezari, 2013). They were entered into ZrO2 structure, the doping of Ag has been confirmed by EDAX, which shows the characteristic peak for Ag at 2.7 keV.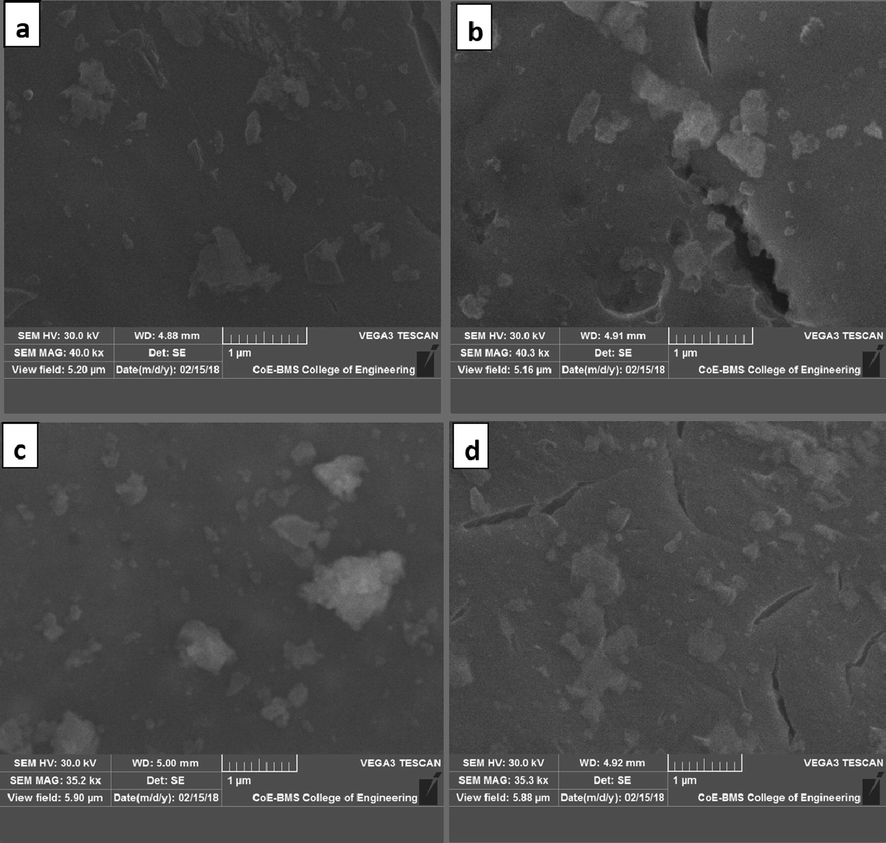
SEM images (a) ZrO2 NP’s: (b) 2 mol% Ag doped ZrO2: (c) 4 mol% Ag doped ZrO2: (d) 6 mol% Ag doped ZrO2.
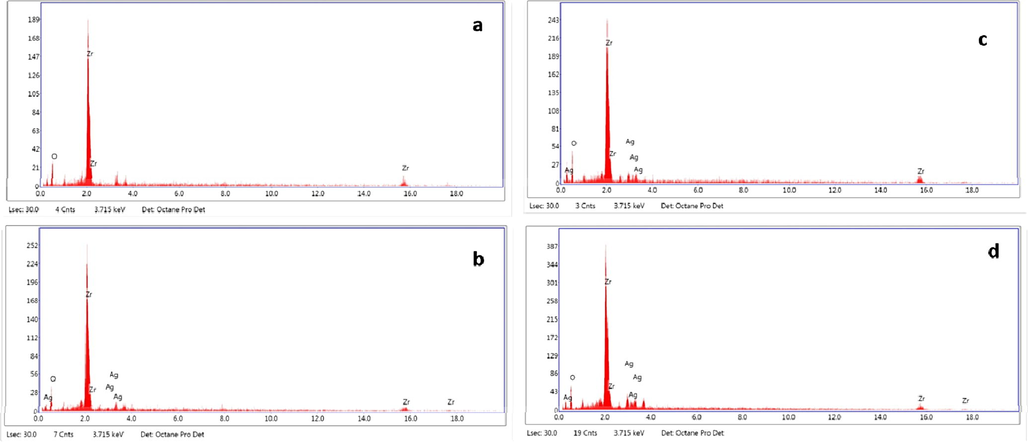
EDS of (a) ZrO2 NPs: (b) 2 mol% Ag doped ZrO2: (c) 4 mol% Ag doped ZrO2: (d) 6 mol% Ag doped ZrO2.
3.5 BET analysis
Fig. 6 (a and b) depicts the Nitrogen adsorption–desorption studies for pure ZrO2 and 6 mol% Ag doped ZrO2 samples. These analyses are carried out in order to gain insights into the specific surface area and pore structures. From the figure, it was evident that both the samples showed clear hysteresis loop and mesoporous nature. Pure ZrO2 and 6 mol% Ag doped ZrO2 NPs are exhibited the specific surface areas of 18.485 and 30.406 m2/g respectively. The porosity of pure ZrO2 and 6 mol% Ag doped ZrO2 samples are calculated from BJH pore size distribution and were found to be 3.35 nm and 3.67 nm respectively. The porous volume of pure ZrO2 and 6 mol% Ag doped ZrO2 were found to be 0.037 and 0.041 cc/g respectively.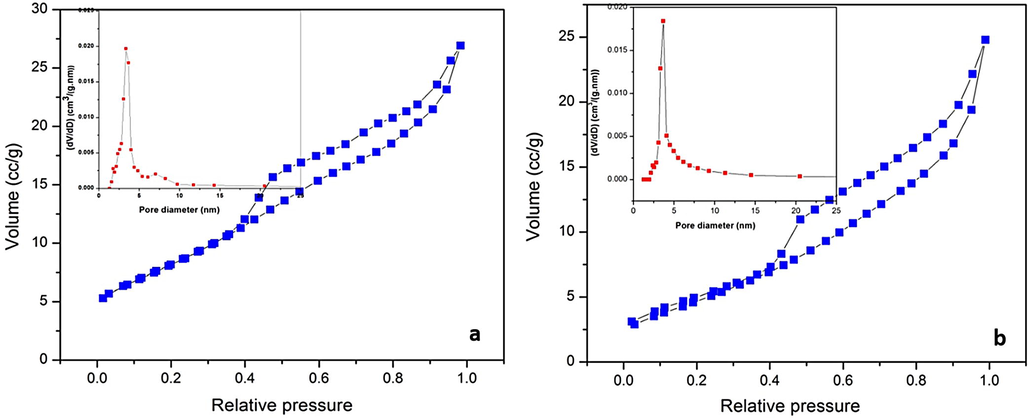
Nitrogen adsorption and desorption isotherms (Inset: The BJH pore-size distribution) of ZrO2 and (b) 4 mol % Ag: ZrO2.
3.6 Photo catalytic degradation study of Rhodamine B dye
Fig. 7(a–d) explains the percentage degradation studies of Rhodamine B dye (5 PPM) of ZrO2 and different mol percentage of Ag doped ZrO2 NPs at different interval of time with catalyst load of 50, 75, 100 and 150 mg respectively. Rhodamine B is a hazardous dye which shows major absorption peak at 545 nm. The photocatalytic degradation results indicated that bare ZrO2NPs as catalyst, the percentage degradation of the dye is minimum, even at maximum catalyst load of 150 mg and the degradation percentage is less than 20. This was due to the large band gap energy of ZrO2. The photocatalytic performance is significantly enhanced by doping with silver which indicated that Ag plays a significant role in photocatalysis. The results also indicated with the increase in concentration of dopant the percentage of degradation of dye increases, in case of 50 mg catalyst load the maximum of 50 percent degradation was achieved by 6 mol% Ag:ZrO2 NPs. When75 and 100 mg catalysts load were used, the degradation percentage of Rh B dye increases to 67 and 75% respectively. Ag (6 mol %) doped ZrO2 catalyst is capable to degrade 95 percentage of Rh B dye in visible light irradiation is as shown in Fig. 7 (d). UV analysis also indicates that within 60 min of irradiation time, almost 80% of Rh B dye undergoes degradation. From the experimental results it was observed that both 4 mol% and 6 mol% Ag doped NPs shows almost same degradation ability, which means as the doping concentration increases the excess Ag particles may act as recombination centers and in turn cover the active sites of ZrO2 surface and hence decreases the photo catalytic activity. Also as the doping concentration increases above the optimal level the turbidity of the solution increases and which makes light penetration lesser and thereby it decreases the catalytic activity. Fig. 8a and b depicts the photocatalytic degradation at higher concentration of the dye (10 PPM and 15 PPM) using 150 mg catalyst load. From the graph, we can conclude that the concentration of the dye increases, the percentage of Rh B dye degradation decreases.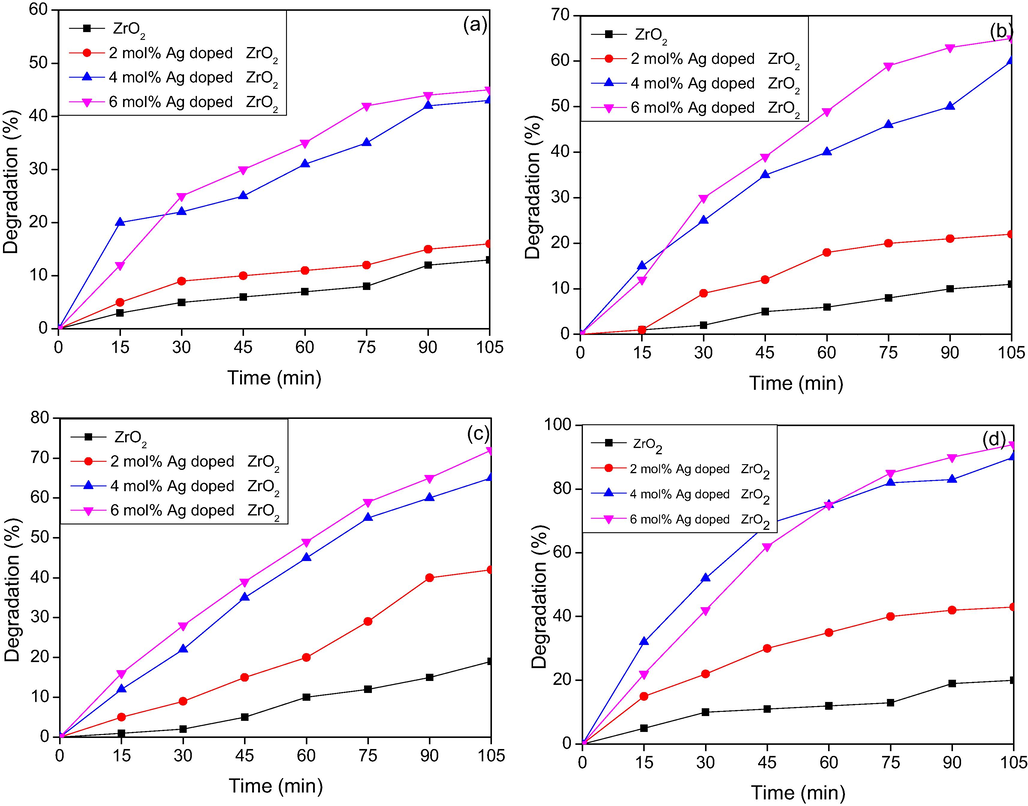
Percentage degradation of Rhodamine B (5 PPM) dye under Visible light irradiation (a): 50 mg catalyst, (b): 75 mg catalyst, (c): 100 mg catalyst, (d): 150 mg catalyst.
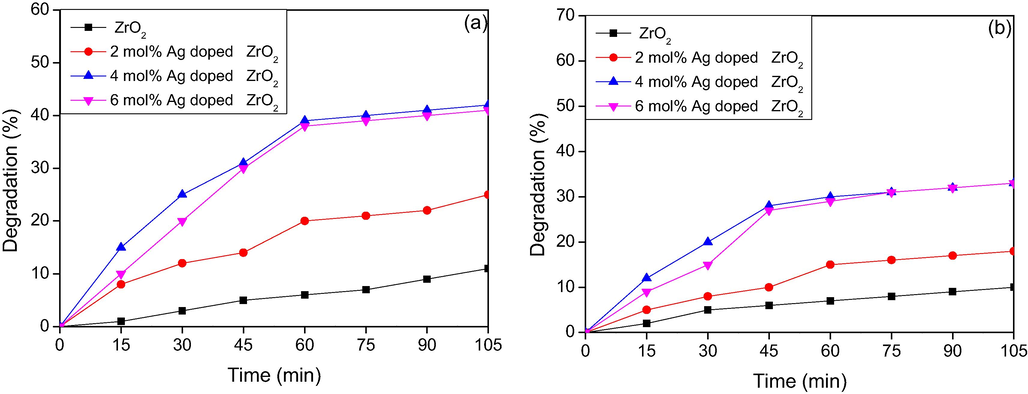
a) Percentage degradation of Rhodamine B (10 PPM) dye using 150 mg catalyst under -Visible light irradiation. b) Percentage degradation of Rhodamine B (15 PPM) dyeusing 150 mg catalyst under -Visible light irradiation.
Jingjing Zhang et al., have introduced macroporous Ag/ZrO2 composite prepared using vacuum impregnation. They have used this catalyst to degrade Congo red dye for irradiation simulated by UV, visible and assisted by microwave and solar light. Ag/ZrO2 composite was capable to degrade 18 times than that of commercial P25 (Zhang et al., 2016). Renuka et al., synthesized Mg doped ZrO2 by using alovera for the degradation of Rh B under UV light. The pure ZrO2 has degraded 65% in 60 min, when it has doped with Mg, increased the degradation efficiency to 93% (Renuka et al., 2016). Gurushantha K et al., developed iron doped ZrO2 NPs by Phyllanthus acidus as green fuel. The degradation of ZrO2 was under UV and sunlight. The efficiency of catalyst dependent on dopant concentration, crystallite size, band gap and texture properties (Gurushantha et al., 2015).
As per the literature survey, limited papers available for the Ag doped ZrO2 for the photocatalytic degradation studies. Many papers are related to the transition metals doped ZrO2 NPs. In this present work, we have preferred a facile, less time consuming, lesser cost and green fuel facilitated combustion method. Ag (6 mol %) doped ZrO2 catalyst is capable to degrade 95 percentage of Rh B dye under visible light irradiation within 105 min.
4 Conclusion
We have developed a green chemistry process for the production of ZrO2 and Ag doped ZrO2 NPs using milk powder by low temperature combustion method. The pure ZrO2 and different mole percentages of Ag doped ZrO2 NPs were characterized by multiple characterization tools for the structural and elemental confirmation. The obtained energy band gap (Eg) values were 6 and 5.6 eV for ZrO2 and 6 mol% Ag doped ZrO2 NPs respectively. Ag doped ZrO2 NPs exhibited the high surface area of 30.406 m2/g. By comparing the photocatalytic activity of the bare ZrO2 and different mole percentages of Ag doped ZrO2 NPs, we conclude that the 6 mol % of Ag doped ZrO2 NPs have showed excellent photo catalytic efficacy for the degradation of Rhodamine b (Rh B) dye in visible light irradiations due to the impact of bandgap, surface area and porosity.
Acknowledgment
The authors extend their appreciation to The Researchers Supporting Project Number (RSP-2019/116) King Saud University, Riyadh, Saudi Arabia.
Declaration of Competing Interest
The authors of the manuscript entitled “Photocatalytic degradation of an organic dye using Ag doped ZrO2 nanoparticles: Milk powder facilitated eco-friendly synthesis” declared no conflict in this manuscript and publications.
References
- Amul (GCMMF) Amul Amulya. www.amul.com/products/amul-amulya-info.php (Accessed March 2019).
- Combustion synthesis and nanomaterials. Curr. Opin. Solid State Mater. Sci.. 2008;12(3–4):44-50.
- [Google Scholar]
- The effect of surface charge on photocatalytic degradation of methylene blue dye using chargeable titania nanoparticles. Sci. Rep.. 2018;8(1):7104.
- [Google Scholar]
- Kinetic study on photocatalytic degradation of CI Acid Yellow 23 by ZnO photocatalyst. J. Hazard. Mater.. 2006;133(1–3):226-232.
- [Google Scholar]
- Synthesis and room-temperature ultraviolet photoluminescence properties of zirconia nanowires. Adv. Funct. Mater.. 2004;14(3):243-246.
- [Google Scholar]
- Preparation of metal nanoparticles in water-in-oil (w/o) microemulsions. Adv. Colloid Interface Sci.. 2004;110(1–2):49-74.
- [Google Scholar]
- Interband transitions in sol− gel-derived ZrO2 films under different calcination conditions. Chem. Mater.. 2007;19(19):4804-4810.
- [Google Scholar]
- Preparation of zirconia nanocrystals from concentrated zirconium aqueous solutions. J. Nanopart. Res.. 2001;3(2–3):119-126.
- [Google Scholar]
- Synthesis of ZrO2 nanowires by ionic-liquid route. J. Colloid Interface Sci.. 2009;333(2):734-740.
- [Google Scholar]
- Enhancement of ultraviolet emissions from ZnO films by Ag doping. Appl. Phys. Lett.. 2006;88(23) 232110
- [Google Scholar]
- Antimicrobial activity of highly stable silver nanoparticles embedded in agar–agar matrix as a thin film. Carbohydr. Res.. 2010;345(15):2220-2227.
- [Google Scholar]
- Facile green fabrication of iron-doped cubic ZrO2 nanoparticles by Phyllanthus acidus: Structural, photocatalytic and photoluminescent properties. J. Mol. Catal. A: Chem.. 2015;397:36-47.
- [Google Scholar]
- Catalytic properties of silver nanoparticles supported on silica spheres. J. Phys. Chem. B. 2005;109(5):1730-1735.
- [Google Scholar]
- Photocatalytic degradation of organic dyes in the presence of nanostructured titanium dioxide: Influence of the chemical structure of dyes. J. Mol. Catal. A Chem.. 2010;328(1–2):8-26.
- [Google Scholar]
- Photocatalytic degradation of three azo dyes using immobilized TiO2 nanoparticles on glass plates activated by UV light irradiation: influence of dye molecular structure. J. Hazard. Mater.. 2009;168(1):451-457.
- [Google Scholar]
- Green synthesis and characterization of silver nanoparticles using Boerhaavia diffusa plant extract and their anti bacterial activity. Ind. Crops Prod.. 2014;52:562-566.
- [Google Scholar]
- High yield combustion synthesis of nanomagnesia and its application for fluoride removal. Sci. Total Environ.. 2010;408(10):2273-2282.
- [Google Scholar]
- Hollow microspheres Mg-doped ZrO2 nanoparticles: Green assisted synthesis and applications in photocatalysis and photoluminescence. J. Alloy. Compd.. 2016;672:609-622.
- [Google Scholar]
- Synthesis, characterization, EPR and thermoluminescence properties of CaTiO3 nanophosphor. Mater. Res. Bull.. 2013;48(4):1490-1498.
- [Google Scholar]
- Photolysis and photocatalysis of methylene blue by ferrite bismuth nanoparticles under sunlight irradiation. J. Mol. Catal. A Chem.. 2013;377:197-203.
- [Google Scholar]
- Photocatalytic degradation of dyes in water: case study of indigo and of indigo carmine. J. Catal.. 2001;201(1):46-59.
- [Google Scholar]
- Multi-mode photocatalytic degradation and photocatalytic hydrogen evolution of honeycomb-like three-dimensionally ordered macroporous composite Ag/ZrO2. RSC Adv.. 2016;6(17):13991-14001.
- [Google Scholar]


