

Translate this page into:
Phenotypic characterization of wheat germplasm for heritability and dissection of association among post anthesis traits under variable sowing dates
⁎Corresponding author. samipbg@bzu.edu.pk (Sami Ul-Allah)
-
Received: ,
Accepted: ,
This article was originally published by Elsevier and was migrated to Scientific Scholar after the change of Publisher.
Peer review under responsibility of King Saud University.
Abstract
Background
The world's main crop for producing staple foods is wheat. In South Asia's cotton-wheat cropping system, however, a late cotton harvest causes a delayed wheat planting, which causes significant production losses. Therefore, this study investigated genetic diversity among wheat genotypes for late sowing. Additionally, associations between several yield-related parameters were discovered, along with their direct and indirect implications on the choice of the best genotypes suitable for late planting.
Methods
Twenty wheat genotypes/advance lines were evaluated under two sowing times, i.e., normal sowing and late sowing for two consecutive years (2019–2021). Data regarding post anthesis traits were collected.
Results
The findings showed that planting dates and genotypes substantially (p < 0.05) impacted all characteristics. Genotype ‘9622’ proved consistent for grain yield by showing the lowest reduction under late sowing. Similar to this, assessments of heritability, correlation, and path coefficients showed that heredity and association strength varied with various sowing dates. Number of spikelets per spike, spike length and biological yield showed the highest correlation and direct and indirect effects on grain yield. Association among traits, and the performance of different genotypes under normal and late sowing was also confirmed by biplot analyses, which grouped the genotypes based on their variation for different traits.
Conclusion
In conclusion, late sowing reduced yield and changed association among the studied traits, probably due to terminal heat stress. Therefore, selection criteria must be evaluated separately in selecting genotypes adoptable to late sowing and other varying environmental conditions.
Keywords
Late sowing
Terminal heat stress
Morphological traits
Heritability
Path-coefficient analysis
Biplot analysis

1 Introduction
In the present and future climate change scenarios, appropriate grain production is a critical problem to ensure global food security. Global warming or increasing temperatures are causing a decline in the output of cereal crops including wheat (Triticum aestivum L.), maize (Zea mays L.), and rice (Oryza sativa L.) (Silvia et al., 2018). As a result, both global food security and peace are seriously threatened by climate change. The main cereal grain grown as a staple crop in Asian nations is wheat (Balk et al., 2019). It occupies more agricultural lands due to its extensive cultivation, production, and best suitability/adaptability in different cropping patterns of the Asian region. Wheat is grown on 216 million hectares worldwide, with a total yield of 756 million tons (FAO, 2021). Asseng et al. (2015) predicted ∼ 6 % reduction in global wheat production with each 1 °C rise in temperature. Pequeno et al. (2021) estimated that climate change, especially increase in temperature can lead to ∼ 16 % decreased wheat production in South Asian countries. Wheat does not experience heat stress in early stages; however, frequently exposed to high temperature stress at reproductive stage. (Wajid et al., 2021). Wheat matures during late-April to mid-May irrespective of sowing dates, especially in plain areas of South Asia.
The recommended sowing date for wheat crop is late-October or early-November to get higher yield (Ahmad et al., 2019). Both early- and late-sowing result in poor crop performance. Too early sowing results in weaker plants with poor and erratic germination, and diseased embryo due to bacterial and fungal infestations (Kaur et al., 2018; Ul-Allah, 2021). Early sowing significantly affects plant height, number of spikes per plant and spikelets per spike etc. On the other hand, late sowing results in poor tillering and decreased plant height due to cold injury (Dubey et al., 2020; Shah et al., 2019). Major reason of yield reduction in delayed sowing is reduced duration of crop cycle and increased temperature at anthesis and grain filling stages, which lead to early maturity of the crop (Dubey et al., 2020; Ul-Allah, 2021). In contrast, normal sowing enhances the duration of tillering and results in a greater number of tillers, number of spikes per plant and spikelets per spike and ultimately increase yield. Selection of appropriate sowing date is the key to obtain higher economic yields because it allows crop to fully express its genetic potential (Wajid et al., 2021). Seasonal changes in temperature, precipitation and growth periods influence development and productivity of crops. Variety/cultivar selection besides sowing dates is among various factors responsible for low wheat yield (Singh et al., 2014; Tack et al., 2017). Performance of the varieties/cultivars varies with climate and soil conditions; therefore, investigation on genetic diversity for sowing date is very important to develop crop genotypes adoptable to late sowing.
Selection of favorable traits is of the central importance to develop genotypes. Selecting multiple traits is difficult due to different nature of associations. Therefore, it is very important for the plant breeders to know how different traits are correlated and how they affect final yield (Anwar et al., 2009; Mohamed and El-Gabry, 2018). Various techniques are being used to estimate the association of different traits of which path coefficient analysis and biplot are commonly used (Mohamed and El-Gabry, 2018; Yildirim et al., 2018). The major reason of their popularity is that path analyses dissect the correlation into direct and indirect effects, which leads to real estimates of associations. Principal component analysis (PCA) biplot analyses not only give estimation of the association, but also group the genotypes based on these associations.
Wheat sowing is delayed in cotton-wheat cropping system in Pakistan and other semi-arid regions due to late harvest of cotton (Shah et al., 2020) which significantly reduces grain yield of wheat. The delayed sowing of wheat in cotton-wheat and rice–wheat cropping systems has appeared as a significant concern in the south Asia. Most of the population residing in these countries is dependent on these cropping systems for income and food security. However, the delayed wheat sowing and induction of transgenic cotton in the cotton-based rotation has aggravated the situation. Therefore, it is necessary to develop short-duration varieties to resolve this issue. Keeping in view the above discussed facts and problem, major objective of the study was to characterize wheat genotypes for their response to late sowing to identify the association among growth and development traits of the genotypes adoptable to late sowing.
2 Materials and Methods
2.1 Experimental details
This study was undertaken during the 2019–20 and 2020–21 wheat growing seasons at the Bahadur Sub-Campus Layyah of the College of Agriculture at Bahauddin Zakariya University in Pakistan (30°57′N; 70°56′E; 151 m a.s.l.). On the experimental location, the soil was sandy loam with a bulk density of 1.29 Mg m3 and a pH of 8.2. The available nitrogen level was 435 mg per kilogram, the phosphorus content was 6.8 mg per kilogram, and the potassium concentration was 123 mg per kilogram, making the soil moderately fertile. The study region is subtropical with warm summers and cool winters and annual precipitation of ∼ 200 mm; therefore, characterized as semi-arid. Weather data of experimental duration is shown in Fig. 1. As weather data of two years was almost similar; therefore, average of two years is presented in the Fig. 1.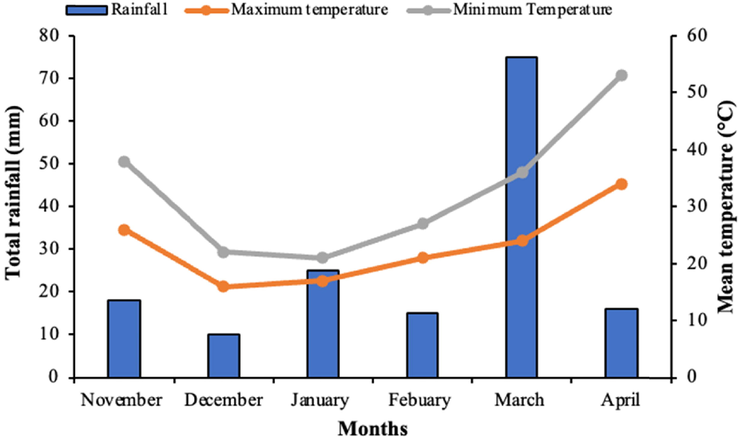
Weather data of experimental site for the duration of experiment (data is an average of two years 2019–20 and 2020–21).
Twenty different improved wheat genotypes were received from the University of Agriculture's Plant Breeding and Genetics Department in Faisalabad, Pakistan. The genotypes were planted on November 11 and 13, 2019 and 2020, for regular sowing, and on December 10 and 12, 2019, and 2020, for late sowing. Each genotype was planted in three rows, with a 30-centimeter gap between rows. Treatments in the experiments were set up in a factorial design with a randomized full block (sowing date and genotypes). For optimum crop growth and development, recommended fertilization (120–90-60 kg ha−1 NPK), irrigations (a total of five irrigations, i.e., at pre sowing, germination, tillering, booting and grain filling stage) and plant protection measures were adopted.
2.2 Data collection
We gathered information on morphological and yield-related traits. Data was collected for 10 randomly selected plants for all traits (excluding yield), and then an average was determined. To determine the height of the plant, a meter bar was used to measure from the top of the soil to the top of the spike, omitting the mother tiller's awn. We measured the length of each spike, omitting the awns. The number of tillers on each plant and the number of spikelets on each spike were counted. After harvesting and weighing two rows in the center, the biological yield was converted to kg per hectare. After the plants had been harvested, they were threshed, and the grains produced were weighed before being converted to kilos per hectare (kg ha−1).
2.3 Statistical analysis
The collected data were analyzed by two-way analysis of variance (ANOVA) considering two factor factorial experiment followed by Tukey post-hoc test to compare the means (Steel et al., 1997). The year effect was non-significant (p > 0.05); therefore, average of two years was used in mean comparisons and interpretation of results. Association among the traits was estimated by correlation analyses following standard procedure in MS Office Excel and associated was further dissected by the path coefficient analyses by following its standard procedure (Dewey and Lu, 1959). The PCA biplot analyses (Gabriel, 1971) was carried out to compute multivariate association among studied traits genotypes were grouped based on their performance under normal and late sowing. Broadsense heritability was calculated for all the traits under normal and late sowing separately. Following formulae was used to estimate the Broadsense heritability,
3 Results
3.1 Morphological and yield related traits
Plant height, spike length, number of spikelets per spike, number of tillers per plant, biological yield, and grain yield all showed very significant differences (p < 0.01) between sowing dates and genotypes. Except for the number of tillers per plant, the interaction between these two parameters was significant (p < 0.01). (Table 1A). The longest plant height was observed for the genotype ‘FSD-83’ (101 cm) in normal sowing and the shortest height (54.67 cm) was observed for genotype ‘9770’ (Fig. 2). *Significant at 5%; **Significant at 1%.
Source of Variation
Plant height
Number of tillers/plant
Number of spikelets/Spike
Spike
lengthBiological yield
Grain yield
Genotype (G)
272.11**
16.38**
37.70**
5.84**
248.47**
47.95**
Sowing Date (SD)
5796.30**
116.03**
175.21**
213.33**
1360.13**
533.48**
G × SD
181.77**
3.82*
2.752**
3.81*
45.20*
21.19**
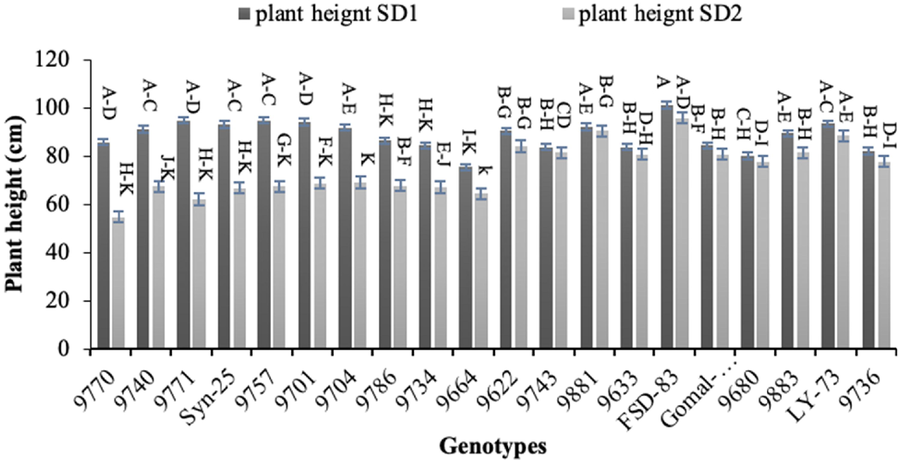
Effect of sowing date on plant height of wheat sown in Layyah, Pakistan (data is average of 2019–20 and 2020–21), SD1 is normal sowing, whereas SD2 is late sowing.
Genotypes ‘9740′ and ‘9680′ recorded the highest number of tillers (7) under normal sowing, while the lowest number of tillers (2) were noted for genotype ‘9771’ in late sowing (Fig. 3). Genotype ‘FSD-83’ resulted the longest spikes (12.00 cm) followed by genotype ‘9622′ (11.33 cm) in normal sowing, while the shortest spikes (8.00 cm) were produced by genotype ‘9680’ (Fig. 4). The longest spikes (9.67 cm) were produced by genotype ‘FSD-83’ under late sowing which was followed by genotype ‘9633’ (9.33 cm), whereas genotypes ‘9757’ and ‘9664’ produced the shortest spikes (6 cm). Twenty spikelets per spike were noted for genotypes ‘9740’, ‘9881’ and ‘FSD-83’ which were highest under normal sowing, whereas 10 spikelets per spike were recorded for genotype ‘Syn-25’ which were the lowest late sowing (Fig. 5).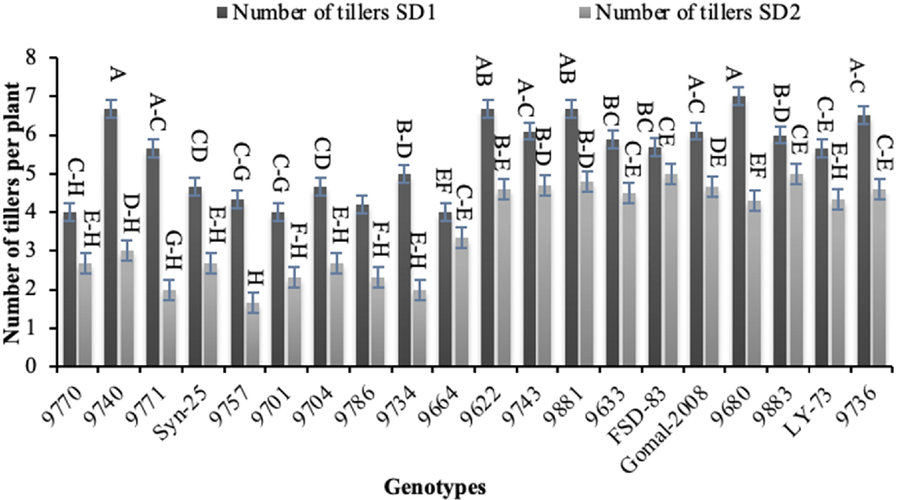
Effect of sowing date on number of tillers per plant of wheat sown in Layyah, Pakistan (data is average of 2019–20 and 2020–21), SD1 is normal sowing, whereas SD2 is late sowing.
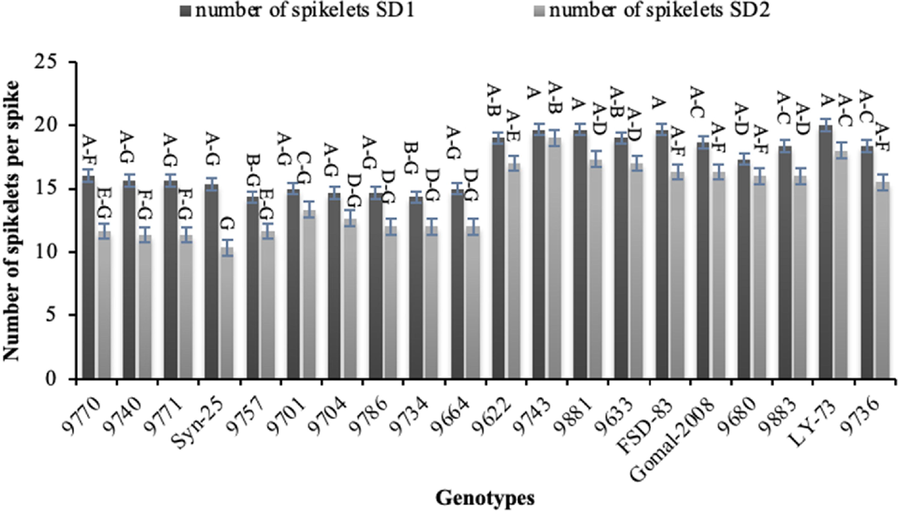
Effect of sowing date on number of spikelets per spike of wheat sown in Layyah, Pakistan (data is average of 2019–20 and 2020–21), SD1 is normal sowing, whereas SD2 is late sowing.
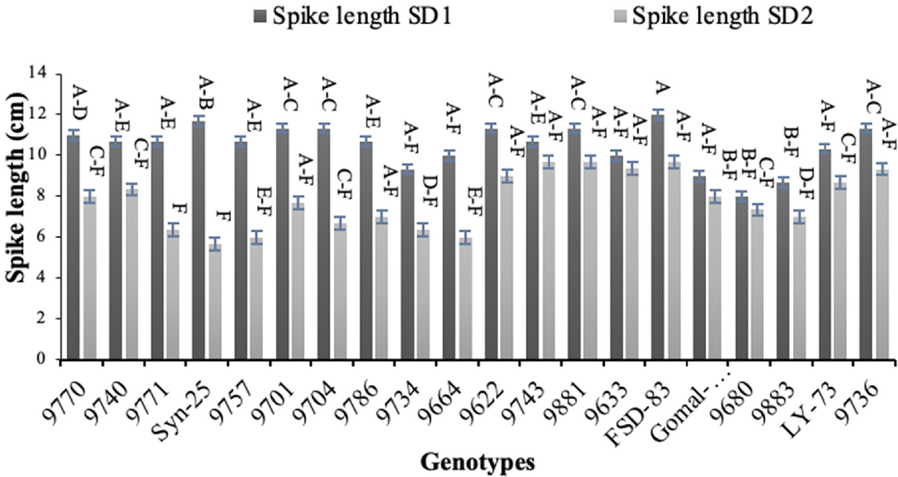
Effect of sowing date on spike length of wheat sown in Layyah, Pakistan (data is average of 2019–20 and 2020–21), SD1 is normal sowing, whereas SD2 is late sowing.
Grain and biological yields are of great significance which were significantly altered by late sowing. The highest biological yield under normal sowing was recorded for genotype ‘FSD-83’ (8.65 t ha−1), whereas the lowest (3.19 t ha−1) was noted for genotype ‘9883’ under late sowing (Fig. 6). The highest (3.74 t ha−1) grain yield was produced by genotype ‘FSD-83’ under normal sowing, whereas the lowest grain yield (1.48 t ha−1) was recorded for genotype ‘9771’ under late sowing (Fig. 7).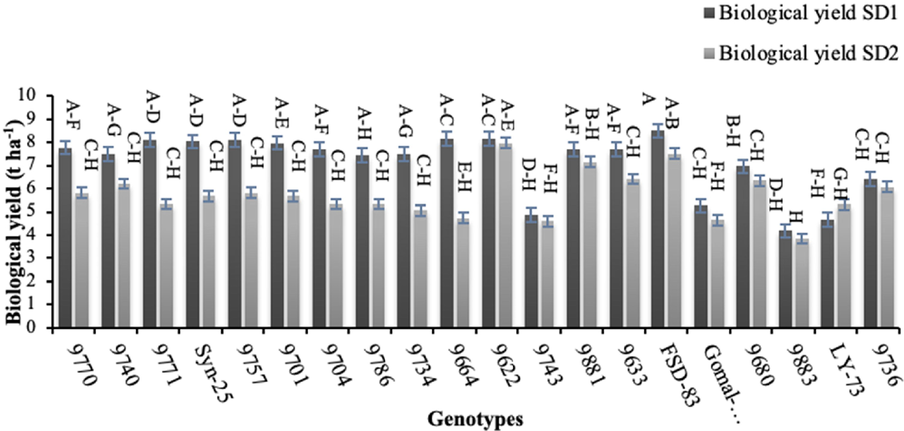
Effect of sowing date on spike length biological yield of wheat sown in Layyah, Pakistan (data is average of 2019–20 and 2020–21), SD1 is normal sowing, whereas SD2 is late sowing.
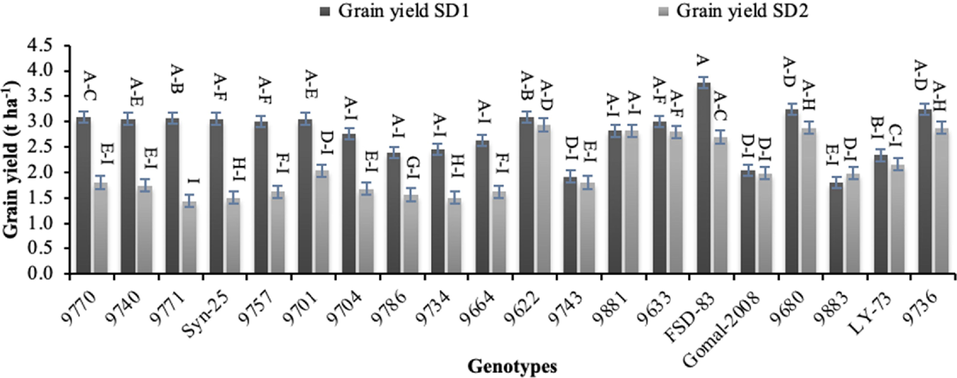
Effect of sowing date on grain yield of wheat sown in Layyah, Pakistan (data is average of 2019–20 and 2020–21), SD1 is normal sowing, whereas SD2 is late sowing.
3.2 Heritability
Heritability represents the portion of variation transferred to the next generation. The highest broad sense heritability (77 % and 76 %) was recorded for plant height and biological yield respectively under normal sowing, whereas heritability coefficient increased under late sowing and the greatest broad sense heritability (91 % and 92 %) was recorded for biological yield and plant height, respectively (Table 1B).
Sowing dates
Plant height
Number of
tillers/plantNumber of
spikelets/spikeSpike length
Biological
yieldGrain
yield
Normal Sowing
0.77
0.71
0.73
0.44
0.76
0.72
Late sowing
0.91
0.83
0.83
0.63
0.92
0.85
3.3 Correlation and path analyses
The importance of trait association is significant in the simultaneous selection of many attributes. After normal seeding, the correlation between examined features was moderate; however, it was high under late sowing (Table 1C). Number of tillers and number of spikelets per spike (r = 0.55) were shown to have a positive connection under normal sowing conditions, followed by grain yield and biological yield (r = 0.54). Plant height and number of spikelets per spike (r = 0.75) had a positive link with late sowing, followed by number of spikelets per spike and number of tillers (r = 0.73). *Significant at 5%, **Significant at 1%.
Traits
Plant
heightNumber of
tillersSpike
lengthNumber of
spikeletsBiological
yieldGrain
yield
Plant height
1
0.22 ns
0.30 *
0.03 ns
0.24 ns
0.27*
Number of tillers
0.73**
1
−0.07 ns
0.55 **
−0.02 ns
0.05 ns
Spike length
0.56**
0.52**
1
0.15 ns
0.29*
0.35**
Noumber of spikelets
0.75**
0.73 **
0.72**
1
−0.18 ns
0.06 ns
Biological yield
0.43**
0.39**
0.22 ns
0.09 ns
1
0.54**
Grain yield
0.64 **
0.68**
0.62 **
0.66**
0.60**
1
For all examined features, route coefficient analysis showed relationship was broken down, although overall indirect effects were modest (Fig. 8). The correlation between biological yield and normal sowing was 0.54, but path studies broke it down into direct and indirect impacts, with the direct effect being 0.49 and the latter being extremely low. The same was true for late planting, when biological yield and the number of spikelets per spike had a strong direct influence and a very low indirect effect. The number of spikelets per spike had a substantial indirect influence on plant height, number of tillers per plant, and spike length, whereas other indirect effects were minimal.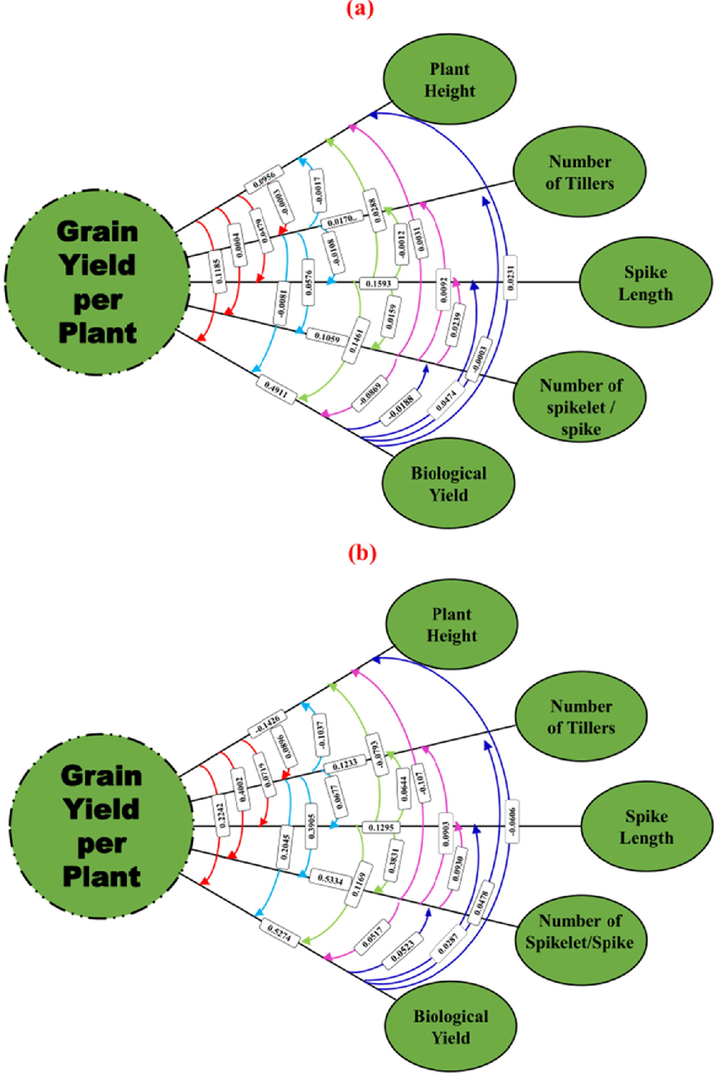
Path coefficient analysis of grain yield and its contributing traits under normal (a) and late sowing (b) conditions.
3.4 Biplot analyses
The 1st two principal components (PC) of biplot reported with 43.62 % and 29.56 % variability, respectively whereas collectively reflected about 73.18 % under normal sowing (Fig. 9). However, the contribution of 1st two PCs was 73.84 % and 16.02 %, respectively under late sowing. Both these PCs reflected ∼ 89.85 % of the total variability. The biplot classified all genotypes into four unique classes in which each class represented unique response regarding different traits under normal sowing. However, the genotypes were grouped into three classes under late sowing (Fig. 9).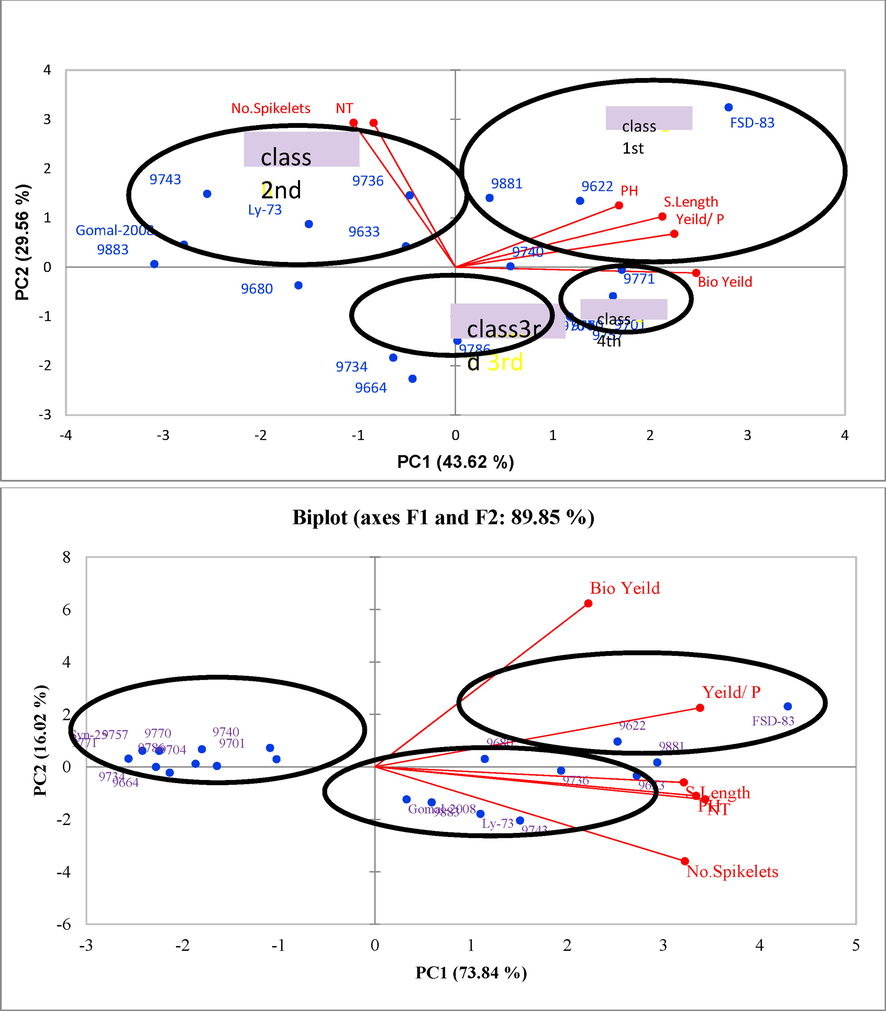
Biplot derived from PCA for yield and related genotypes under normal (a) and late sowing (b) conditions.
The PC1 had yield-related parameters, plant height, spike length, biological yield and grain yield as the principal components under normal sowing. The class 1st under normal sowing contained ‘FSD-83’, ‘9622’, ‘9881’, ‘9740’ and ‘9771’ genotypes which had higher grain yield, biological yield and spike length. The 2nd class comprised of genotypes ‘9736’, ‘LY-73’, ‘9743’, ‘9633’, ‘Gomal-2008’, ‘9883’ and ‘9680’ which had higher number of spikelets per spike and number of tillers but low grain yield, spike length and plant height compared to the genotypes grouped in class 1st. The 3rd class consisted of genotypes ‘9734’ and ‘9664’ which had comparatively low grain yield as well as plant height than the genotypes in class 1st and 2nd. The class 4th was composed of genotypes ‘9701’ and ‘9757’ which had moderate grain yield and high biological yield as compared to the genotypes hosted by class 1st, 2nd and 3rd (Fig. 9).
Out of three classes under late sowing, class 1st consisted of genotypes ‘FSD-83’, ‘9881’, ‘9680’, ‘9622’, ‘9735’, ‘9633’ with higher grain and biological yields, spike length, number of tillers, number of spikelets per spike and spike length. The class 2nd contained genotypes ‘9740’, ‘9701’, ‘9770’, ‘9704’, ‘9664’, ‘9774’, ‘9757’ and ‘Syn-25’ which had low grain and biological yield but high number of spikelets. The genotypes ‘9743’, ‘9883’, ‘Gomal-2008’ and ‘LY-73’ were grouped in class 3rd which had low grain and biological yields than the genotypes grouped in class 1st (Fig. 9).
4 Discussion
The development and yield of wheat crop is significantly affected by late sowing mostly in cotton-wheat cropping system. Grain and biological yields suffered greatly in late seeded wheat due to heat stress and a shorter harvest window. Also, when the sowing date shifted, so did the relative strength of the associations between the features. Improvements in grain production may be achieved by selecting for features that have shown either direct or indirect contributions, but it is important to examine the impact of traits independently across conditions. The results of several wheat genotypes when planted at various times varied. Normal sowing conditions favored the ‘FSD-83’ genotype, but the ‘9622’ genotype shown greater tolerance to the negative effects of late planting and yielded a greater crop. It is possible that this research may aid breeders in their efforts to create wheat with increased resistance to climate change.
Under late planting conditions, terminal heat stress impeded plant development and eventually reduced production (Sissons et al., 2018; Ul-Allah et al., 2021; Zain et al., 2017). It is shown how the sowing date and genotypes alone and in combination affected growth and yield parameters (Ul-Allah et al., 2021). Since wheat is a crop that is sensitive to photoperiod, the morphological characteristics of the examined genotypes in the present research were significantly impacted (Aslam et al., 2017; Whittal et al., 2018). Although there was a 30-day variation in sowing dates, the maturity dates for both early and late seeded crops were the same in April. Lately sowed crops have less time to finish their life cycles as a result. A poor seed setting was also a result of heat stress encountered by late-sown wheat during anthesis (Akter and Rafiqul Islam, 2017; Hütsch et al., 2019). A decreased grain production is also the effect of the high temperature's reduced sink capacity and less seed setting (Hütsch et al., 2019; Ul-Allah et al., 2021).
Pequeno et al. (2021) estimated that climate change, especially increase in temperature can lead to ∼ 16 % decreased wheat production in South Asian countries. Wheat does not experience heat stress in early stages; however, frequently exposed to high temperature stress at reproductive stage. It is a photoperiod-sensitive crop, and in late February or early March, it begins to reproduce (Wajid et al., 2021). Regardless of planting dates, wheat matures between late April and mid-May, particularly in South Asia's plain regions. In current study, grain and biological yields were decreased due to less growth time and high temperature at anthesis. Plant biomass and grain yield were negatively affected as there was less time interval for late sown wheat to complete growth and development (Aiqing et al., 2018; Whittal et al., 2018). However, performance of some genotypes remained constant under both sowing dates, and these showed resistance at some extent because of their unique genetic makeup. There might be multiple mechanisms behind this. Ullah and Chenu (2019) reported that delayed leaf senescence may play a role in maintaining grain size and grain yield to combat heat stress in late sown wheat. Hlaváčová et al. (2018) reported that tolerant genotypes maintain photosynthetic efficiency under stress conditions, which help in sustaining biological and grain yield. Thus, photosynthetic parameters, especially stay green must be considered while selecting genotypes for short duration (genotypes adopted to late sowing).
For a plant breeder, an understanding of the association of various traits to grain yield and degree of heritability is essential for selection of desired traits. In our study, overall heritability under normal sowing was good; however, increased under late sowing. As the value of broad sense heritability increased, strength of correlation was weak. This might be attributed to differential gene expression and expression of transcription in different environmental conditions and the interactive effect of genotypes and environment (Akter and Rafiqul Islam, 2017; Ravichandran et al., 2019). Similar findings in wheat have also been reported by other researcher (Mohamed and El-Gabry, 2018) who observed change in correlation and heritability estimates due to late sowing. This shows that selection criteria must be define separately for the breeding programs in different environmental conditions (Balkan, 2018; Iqbal et al., 2017; Mohamed and El-Gabry, 2018). Several earlier studies have reported genotypic difference in wheat for various growth and yield related traits (Farooq et al., 2020, 2017,2015; Hussain et al., 2016a; Hussain et al., 2016b).
Overall association for all traits under this consideration was strong as it changes according to change in environmental condition and sowing date. Therefore, each correlation was dissected into direct as well as indirect effect to check the contribution of each yield associated trait towards grain yield. From the direct and indirect effects, breeders can clearly understand importance of different traits in selecting multiple traits together (AbdulHamid et al., 2017; Baye et al., 2020). However, the genotypes which have mechanism to accumulate relatively more assimilate manifest less reduction in term of grain and biological yields which was confirmed by using biplot analysis (Yan and Frégeau-Reid, 2018). Therefore, for the creation of new cross combinations, breeders must select genotypes based on their performance in specific environmental condition (Ul-Allah et al., 2021). Likewise, in case of late sowing farmers should be more precise in selection of suitable genotypes which have better adaptability in late sowing and cause less loss of grain yield.
5 Conclusion
Heat stress and less time for crop maturity badly affected grain and biological yields in late sown wheat. Moreover, strength of the association among the traits also changed due to change in the sowing date. The traits which showed significant contribution either direct or indirect should be selected for improvement in grain yield, but the contribution of traits must be evaluated separately in different environments. Different wheat genotypes showed variation in performance under different sowing dates. The genotypes ‘FSD-83’ performed better under normal sowing and the genotype ‘9622’ exhibited higher tolerance to the deleterious effects late sowing and produced higher yield. This study may be helpful for the breeders in designing wheat breeding program for the development of climate resilient genotypes.
Acknowledgement
This project was supported by Researchers Supporting Project Number (RSP-2023R5) King Saud University, Riyadh, Saudi Arabia.
Declaration of Competing Interest
The authors declare that they have no known competing financial interests or personal relationships that could have appeared to influence the work reported in this paper.
References
- Genetic variability, correlation and path analyses for yield and yield components of some bread wheat genotypes. J. Plant Prod.. 2017;8:845-852.
- [CrossRef] [Google Scholar]
- Ahmad, A., Ashfaq, M., Wajid, A., Khaliq, T., Ahmd, I., Hoogenboom, G., 2019. Development of climate change adaptation strategies for rice-wheat cropping system of Punjab Pakistan.in: Australian Agricultural and Resource Economics Society (AARES). Melbourne, Australia.
- Heat stress during flowering affects time of day of flowering, seed set, and grain quality in spring wheat. Crop Sci.. 2018;58:380-392.
- [CrossRef] [Google Scholar]
- Heat stress effects and management in wheat. A review. Agron. Sustain. Dev.. 2017;37:37.
- [CrossRef] [Google Scholar]
- Assessment of yield criteria in bread wheat through correlation and path analysis. J. Anim. Plant Sci.. 2009;19:185-188.
- [Google Scholar]
- Can growing degree days and photoperiod predict spring wheat phenology? Front. Environ. Sci.. 2017;5
- [CrossRef] [Google Scholar]
- Rising temperatures reduce global wheat production. Nat. Clim. Chang.. 2015;5:143-147.
- [CrossRef] [Google Scholar]
- Improving wheat as a source of iron and zinc for global nutrition. Nutr. Bull.. 2019;44:53-59.
- [CrossRef] [Google Scholar]
- Genetic variability, heritability and genetic advance for yield and quality traits in M2–4 generations of bread wheat (Triticum aestivum L.) genotypes. Turkish J. F. Crop 2018:173-179.
- [CrossRef] [Google Scholar]
- Genotypic and phenotypic correlation and path coefficient analysis for yield and yield-related traits in advanced bread wheat (Triticum aestivum L.) lines. Cogent Food Agric.. 2020;6:1752603.
- [CrossRef] [Google Scholar]
- A Correlation and Path-Coefficient Analysis of Components of Crested Wheatgrass Seed Production 1. Agron. J.. 1959;51:515-518.
- [Google Scholar]
- Impact of terminal heat stress on wheat yield in India and options for adaptation. Agric. Syst.. 2020;181:102826
- [CrossRef] [Google Scholar]
- FAO, 2021. Food and Agriculture Organisation of the United Nations pistachio statistics [WWW Document].
- Osmopriming with CaCl2 improves wheat (Triticum aestivum L.) production under water-limited environments. Environ. Sci. Pollut. Res.. 2017;24:13638-13649.
- [CrossRef] [Google Scholar]
- Influence of seed priming techniques on grain yield and economic returns of bread wheat planted at different spacings. Crop Pasture Sci.. 2020;71:725.
- [CrossRef] [Google Scholar]
- Improving the productivity of bread wheat by good management practices under terminal drought. J. Agron. Crop Sci.. 2015;201:173-188.
- [CrossRef] [Google Scholar]
- The biplot graphic display of matrices with application to principal component analysis. Biometrika. 1971;58:453-467.
- [CrossRef] [Google Scholar]
- Interactive effects of high temperature and drought stress during stem elongation, anthesis and early grain filling on the yield formation and photosynthesis of winter wheat. F. Crop. Res.. 2018;221:182-195.
- [CrossRef] [Google Scholar]
- Wheat sown with narrow spacing results in higher yield and water use efficiency under deficit supplemental irrigation at the vegetative and reproductive stage. Agronomy. 2016;6:22.
- [CrossRef] [Google Scholar]
- The impact of seed priming and row spacing on the productivity of different cultivars of irrigated wheat under early season drought. Exp. Agric.. 2016;52:477-490.
- [CrossRef] [Google Scholar]
- Grain yield of wheat (Triticum aestivum L.) under long-term heat stress is sink-limited with stronger inhibition of kernel setting than grain filling. J. Agron. Crop Sci.. 2019;205:22-32.
- [CrossRef] [Google Scholar]
- Response of cotton genotypes to water and heat stress: from field to genes. Euphytica. 2017;213:131.
- [CrossRef] [Google Scholar]
- Mitigating the impact of climate change on wheat by use of liquid microbial inoculants under different planting dates. Res. Crop.. 2018;19
- [CrossRef] [Google Scholar]
- Genetic variability, heritability, correlation and path coefficient analysis for grain yield and its contributing traits in wheat crosses under different environments. Egypt. J. Plant Breed.. 2018;22:1503-1517.
- [Google Scholar]
- Climate impact and adaptation to heat and drought stress of regional and global wheat production. Environ. Res. Lett.. 2021;16:054070
- [CrossRef] [Google Scholar]
- MicroRNA-guided regulation of heat stress response in wheat. BMC Genomics. 2019;20:488.
- [CrossRef] [Google Scholar]
- Transplanting improves the allometry and fiber quality of Bt cotton in cotton–wheat cropping system. Exp. Agric.. 2020;56:26-36.
- [CrossRef] [Google Scholar]
- Ascorbic acid priming enhances seed germination and seedling growth of winter wheat under low temperature due to late sowing in Pakistan. Agronomy. 2019;9:757.
- [CrossRef] [Google Scholar]
- Sustainable and technological strategies for basic cereal crops in the face of climate change: a literature review. African J. Agric. Res.. 2018;13:220-227.
- [CrossRef] [Google Scholar]
- Farmers’ participatory varietal selection: a sustainable crop improvement approach for the 21st century. Agroecol. Sustain. Food Syst.. 2014;38:427-444.
- [CrossRef] [Google Scholar]
- Effects of heat exposure from late sowing on the agronomic and technological quality of tetraploid wheat. Cereal Chem.. 2018;95:274-287.
- [CrossRef] [Google Scholar]
- Steel, R., Torrei, J., Dickey, D., 1997. Principles and Procedures of Statistics A Biometrical Approach.
- Irrigation offsets wheat yield reductions from warming temperatures. Environ. Res. Lett.. 2017;12:114027
- [CrossRef] [Google Scholar]
- Assessment of Genetic Variability and Direct-Indirect Contribution of Post-Anthesis Traits to the Grain Yield in Bread Wheat (Triticum aestivum) at Different Sowing Dates. Int. J. Agric. Biol.. 2021;26:193-200.
- [CrossRef] [Google Scholar]
- Assessment of genetic variability and direct-indirect contribution of post-anthesis traits to the grain yield in bread wheat (Triticum aestivum) at different sowing dates. Int. J. Agric. Biol. 2021;26:193-200.
- [Google Scholar]
- Ullah, N., Chenu, K., 2019. Impact of post-flowering heat stress on stay-green and grain development in wheat, in: Proceedings of the Australian Agronomy Conference, Wagga Wagga. pp. 1–4.
- Crop models: important tools in decision support system to manage wheat production under vulnerable environments. Agriculture. 2021;11:1166.
- [CrossRef] [Google Scholar]
- Allelic variation of vernalization and photoperiod response genes in a diverse set of North American high latitude winter wheat genotypes. PLoS One. 2018;13:e0203068.
- [Google Scholar]
- Genotype by Yield*Trait (GYT) biplot: a novel approach for genotype selection based on multiple traits. Sci. Rep.. 2018;8:8242.
- [CrossRef] [Google Scholar]
- Assessment of the grain quality of wheat genotypes grown under multiple environments using gge biplot analysis. Fresenius Environ. Bull.. 2018;27:4830-4837.
- [Google Scholar]
- Foliar applied thiourea at different growth stages modulated late sown wheat. Pak. J. Sci.. 2017;69:39.
- [Google Scholar]


