

Translate this page into:
Performance evaluation of indigenous floppy sprinkler irrigation system for various crops water management
⁎Corresponding author. sarfraz.hashim@mnsuam.edu.pk (Sarfraz Hashim)
-
Received: ,
Accepted: ,
This article was originally published by Elsevier and was migrated to Scientific Scholar after the change of Publisher.
Peer review under responsibility of King Saud University.
Abstract
Freshwater resources are a natural blessing and vital to life. Water is required in many aspects of life due to its importance in the economy. A Floppy sprinkler system (FSS) is an innovative and unique method for pressurizing irrigation. This method has multiple applications other than traditional methods, which can overcome farmer's issues to adopt the high-efficiency irrigation system. The performance evaluation of two types of floppy sprinklers (imported and indigenous) was the primary objective of this research. Three parameters, application efficiency of the low quarter (AELQ), distribution uniformity (DU), and uniformity coefficient (CU), were evaluated under different levels of riser height and operating pressures. A portable testing bench was designed to determine these parameters and the overall performance of FSS in the agriculture field. The system operated at a different pressure range from 1.5 to 4 bar and riser heights 10ft, 12ft, and 15f for both sprinklers. The results revealed that the system achieved maximum CU, DU, and AELQ at the operating pressure of 2.5 bar and riser height of 10 ft for both types of floppy sprinklers. The corresponding values of CU, DU, and AELQ were 84.5%, 70.7%, and 87.0 % for imported and 82.2%, 67.7%, and 82.5% for indigenous FSS. An overlap simulation model was used to achieve a high percentage of system performance. The results declared that the overlapping between sprinklers should be more than 65% to avoid water losses and minimize the overall system cost.
Keywords
Floppy Sprinkler
Application efficiency of the low quarter
Innovative irrigation method
Distribution uniformity
Coefficient of uniformity

1 Introduction
Freshwater resources are the blessing of nature and valuable assets for the existence of life. All sectors of life have an inevitable water demand because it plays a pivotal role in the overall economy. The region is characterized into arid and semi-arid zones on the base imbalance between evapotranspiration rate and rainfall. The increasing water demand for agriculture, industries, and urban use has become a severe problem (AlEmadi, 2021). Water is used for irrigation more than any other purpose, accounting for more than 70% of water withdrawals globally. Water accounts for 40% of worldwide food production and is critical to feeding the world's population, accounting for 20% of total cultivated land (Hamidov & Helming, 2020). A highly efficient on-farm irrigation system is being required to meet the current demand and challenges of water. The pressurized irrigation system (PIS) tends to fulfill the main objective as desired to conserve water and efficient crop production per unit area. An efficient sprinkler system results from the proper design, scheduling of irrigation, and maintenance during the system's operation. The number of runoffs decreases due to sedimentation, silting, and some hydrological losses. Hence, it is a dire need to manage water for them (Gu et al., 2020).
Current irrigation methods can save a large quantity of water under good irrigation practices, especially in semi-arid and arid areas. Few major advantages of FSS, sprinkler and drip irrigation systems are; the flooded land magnitude represents the supply of water as a contrast to irrigation with the surface water, because of high irrigation efficiency and is possible to get high crop production along with more revenue with improved supervision (Samimi et al., 2020). A poorly managed and designed PIS results in non-uniform water circulation. In such irrigation practices, the maximum valued result of the evaluation method is irrigation water uniformity. The UC is an important gauge of how unequal or equal the application rates (AR) are after the transporting technologies (Sadeghi et al., 2021). The output of crops is directly related to the water quantity and method of irrigation used. It is advised that performance evaluation be carried out soon after the irrigation system is installed and then revisited on an irregular basis, especially when considering plans, due to their susceptibility to changing operating conditions over time (Elshaikh, Jiao, & Yang, 2018). Seven FSS in terms of field distribution efficiency was evaluated. They find out that the UCs of FSS fluctuated from 66 to 84%. In the meantime, the UC of FSS fluctuated from 59 to 78% (B. Griffiths & Lecler, 2001). Researchers also stated that the UC was outstanding, reasonable, and meager outputs of 75 to 85%, 65 to 75%, and 50 to 65%, respectively (Hanson, May, & Schwankl, 2003).
The most proficient irrigation techniques are surface irrigation, subsurface, sprinkler, micro-irrigation, and hybrid irrigation. The standard results obtained for water application and irrigation efficiency for each of the above systems are 68% for the solid set, 95% for subsurface drip, 74% for the floppy system, and 82% for the center pivot system (Shabbir et al., 2020). The sprinkler performance helps to differentiate the selection of a method for cropping system. In a highly efficient irrigation system, evaporation losses, distribution uniformity, and wind drift are the primary factors that measure the sprinkler system's performance (Roberts, Yost, Ransom, & Creech, 2021). Sprinkler performance was analyzed by the distribution pattern, droplet size, application rate, wetted radius, and water discharge. The variation in hydrant, sprinkler spacing, layout, design, or weather situations causes heterogeneity in sprinkler irrigation systems (Zema, Nicotra, & Zimbone, 2019). The sprinkler design's wind direction or speed ignoring may affect the peak flow of water capacity in the sprinkling irrigation system. High wind speed is disfavored in the design management and reliability of the sprinkler system in irrigation (Darko et al., 2017). A recent study revealed the consequences of pulsating pressure on uniformity distribution of sprinklers sloping land (Zhang, Fu, Ren, & Huang, 2019). It concluded that 10% higher uniformity on pulsating pressure than constant pressure. The study evaluated the sprinkler system's performance at the Kakara Tea Irrigation System (KTIS). It was determined that the Coefficient of uniformity results are 90.9 % and 79% of the delivery performance ratio (Ngasoh, Anyadike, Mbajiorgu, & Usman, 2018).
There are multiple reasons to create or plan an innovative proficient sprinkler irrigation system. It must be obligatory to determine the optimal operating conditions associated with the AELQ, DU, CU, and exceptional delivery efficiency. Consequently, an innovative floppy sprinkler is being introduced to compare the irrigation performance of indigenous floppy sprinklers manufactured with local and original floppy sprinklers. The prime objective of this research was to simulate the experimental data and achieved the field results and hurdles faced to adopt the PIS (Table 1).
Floppy Type
Nozzle Diameter (mm)
Operating Pressure (Bar)
1.5
2.0
2.5
3.0
3.5
4.0
Original
F.12.5
0.45
0.50
0.53
0.54
0.51
0.52
3
0.85
0.88
0.92
0.91
0.90
0.89
3.5
1.10
1.12
1.15
1.12
1.10
1.08
Local
F.22.5
0.43
0.48
0.51
0.52
0.51
0.47
3
0.83
0.85
0.88
0.87
0.88
0.84
3.5
1.08
1.10
1.12
1.12
1.10
1.08
2 Material and methods
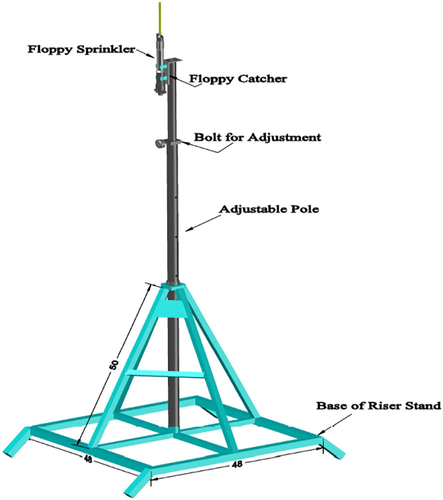
An indigenous floppy sprinkler was developed with the local material and field experiment conducted on the half hectare of land at the research farm of the Muhammad Nawaz Shareef University of Agriculture, Multan, Pakistan (Latitude 300 08.77′ N and longitude 710 26.59′). The experimental site has clay loam soil and the availability of surface water. A representation view of the investigational setup illustrates in Fig. 1. The system operated with a 5.5 horsepower (HP) centrifugal pump and 4 kW (KW) motor. A permanent overhead cable system is installed with nine rows. Each row has a different length which consists of 6 to 9 floppy sprinkler ports. The overall plan was designed with adjustable heights from 8 ft to 14 ft and overlapping variations from 65 to 80 percentage. A water meter, disk screen filter, non-return valve, and pressure gauge (up to 10 bar) were installed at the head unit to approximate the desired water and pressure at the field. Two types of floppy sprinklers (imported and indigenous) were established as a permanent (solid set) system and a portable system (Fig. 2). This unique floppy sprinkler project is appropriate for diverse installation possibilities as mandatory for different crops. It contains a plastic pipe with an elastic silicon tube present in the inner part of the sprinkler. The water enters from the inlet cap and passes from the flow controller. Self-operational pressure produces, and silicon tubes rotate into up and down motion at 360° with uniform droplets. The droplet size varied with the pressure control at the head unit and was adjustable according to crop size and water requirement.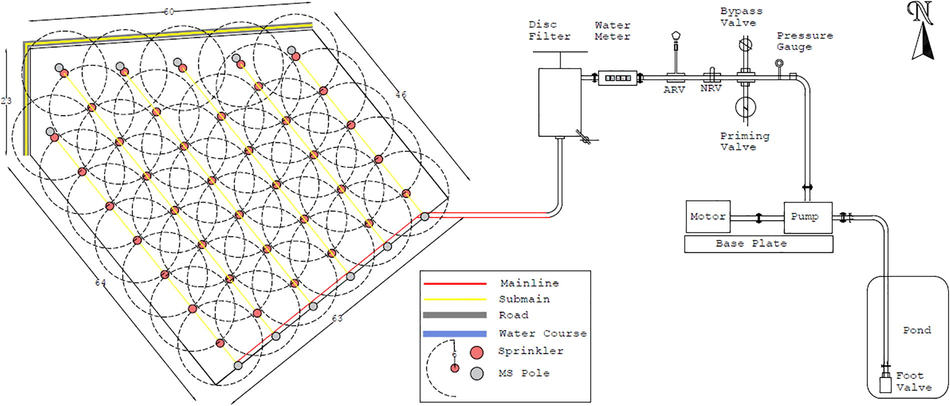
Schematic diagram for fix or solid set sprinkler site.
Portable Floppy Sprinkler System.
2.1 Data collection and experimental design
Several experiments were designed and arranged for both types of sprinklers and systems. The indigenous floppy sprinkler was developed and modified to improve the system's capacity and life. The plastic cans of 11.5 cm diameter, 80 mm height were placed crossways on the circle of both sprinkler systems inside the water range, or the throwing radius must be 33ft, as shown in Fig. 3. The floppy sprinkler was operated at different operating pressure levels from 1.5 to 4.0 Bar and riser heights 10 ft, 15ft, and 20 ft. The height was adjusted with measuring tape and calculate the operating pressure by using a pressure gauge attaching to the pressure pitot tube. A pressure gauge or flow meter was placed or estimate an anticipated pressure imported and locally made sprinkler nozzle.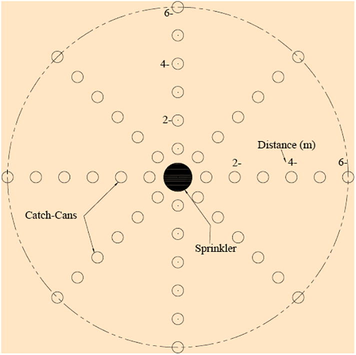
Schematic diagram for the placement of plastic catch Cans.
The flow rate of each floppy sprinkler was measured by providing fix volume of water against time. The following formula was used to measure the flow rate (Rundo & theory, 2017):
Wherever: “Q” shows the rate of flow for sprinkler floppy liter/hr.
“V” shows the volume of water in liter
“t” shows time to collect water in hr.
Individual sprinkler water application was determined through installed catch cans transversely the complete loop of each sprayer during the experiment. The following formula was used to measure the application rate (James, 1988):
Wherever: “A” shows the rate of application mm/hr.
“Q” shows the rate of flow for floppy sprinkler liter/min
Sprinkler floppy wetted area in illustrating as m2 “a.”
Constant unit represented by “k” (“Q” in liter/min, “A” mm /hr. K = 60., or “a” in m2)
2.2 Parameters for irrigation performance measurement
The selection of a suitable high-efficiency irrigation system depends on is a challenge for farmers. The field performance in crop variety, operational cost, and water distribution on the target area could be helpful to select and design the proper pressurize irrigation system (Pereira, Oweis, & Zairi, 2002). Some different worldwide studies and reports quoted different parameters to evaluate a system for field performance. In this study, three parameters DU, CU, and AELQ, were used to evaluate the efficiency of the floppy sprinkler irrigation system.
2.2.1 Distribution uniformity (DU)
Distribution uniformity for irrigation water distributes the water to the field. The uniformity denoted as DUlq (and all terms involving the low quarter) equals around 1/8 of the area. In addition, it is a lesser amount than the cost of a numerator. According to (Heermann & Solomon, 2007), the DU, “regular depth penetrated in the small ¼ of field alienated by an average distance of water penetrated incomplete field,” expressed as:
Wherever: DU shows the distribution uniformity in %age
Dav shows the average depth penetrated over the total area
Dlq shows the average depth penetrated on 1/4th of the entire field with minimum infiltration.
According to Roger, the Ud is the ratio of the average application quantity expected in minimum watered 1/4th of the filled (Roger et al., 1997), which is expressed as
Dav indicates the water infiltrated at average depth.
2.2.2 Uniformity Coefficient (Uc)
The term Uc measures the water uniformity of sprinkler irrigation systems (Christiansen, 1942), representing the respective sprinkler's performance efficiency. The Uc has been occasionally applied to other forms of irrigation. It is used to measure the performance of sprinkler systems which has the most substantial historical standard in sprinkler irrigation systems. The Coefficient of uniformity treats under irrigation and over-irrigation equally and is compared to the mean (Pahlevani, Ebrahimian, Abbasi, & Fujimaki, 2021). The Christiansen formula is used to measure this, such as:
Vi shows the water depth in individual collectors
‾v shows the average water's depth in all cans
In addition to the distribution uniformity and Coefficient of uniformity, some other parameters are necessary to measure sprinkler performance, such as runoff, wind speed, AR, pump performance, amount of water applied, and overall management of the system should be under consideration for the sprinkler performance evaluation (Hartin et al., 2018). According to (Liu, Zhu, Yuan, & Fordjour, 2019), Christiansen's uniformity coefficient is the maximum extensively used for the Distribution of water uniformity calculation in High-efficiency sprinkler irrigation systems.
2.2.3 Application efficiency of the low quarter (AELQ)
AELQ was calculated using the following formula (Xiang, Xu, & Chen, 2018):
Zr. lq shows the average low quarter depth of water measured (mm), and D demonstrates the required average water depth (mm).
3 Results
The consequence of working pressure on the current flow rate for two types of floppy sprinklers, indigenous type (F1) and imported type (F2), is shown in Fig. 4. It shows, as mentioned above that the flow rate from specific sprinklers was highly affected by working pressure. The rate of application reduced with increasing the operating pressure under the same riser height. In the intervening time, the rate of application reduced with the increase of height of riser as presented in Fig. 6 A&B. The rate of application decreased thru 11.80 % and 7.58 % for F.1 and F.2, respectively, while the working pressure raised from 1.5 to 4.0 Bar at the height of riser of 10 feet. The same inclination was detected for heights of 12 and 15 ft. The rate of application was reduced by 4.03 % and 3.15 % by raising heights from 10 to 15 ft at operational pressure 1.0 Bar for F1 and F2. The high rate could be attained by the arrangement of low working pressure with a low riser height for the two types of floppy sprinkler, F.1 and F.2, respectively. The outcomes additionally exhibited that rising operating pressure from 1.5 to 4.0 Bar increased discharge rate by 19, 16, and 17% at 2.50, 3.00, and 3.50 nozzle diameter, respectively. Broadly, it was noted that the highest discharge rate was recorded with the highest values of both pressure and nozzle diameter (Fig. 5).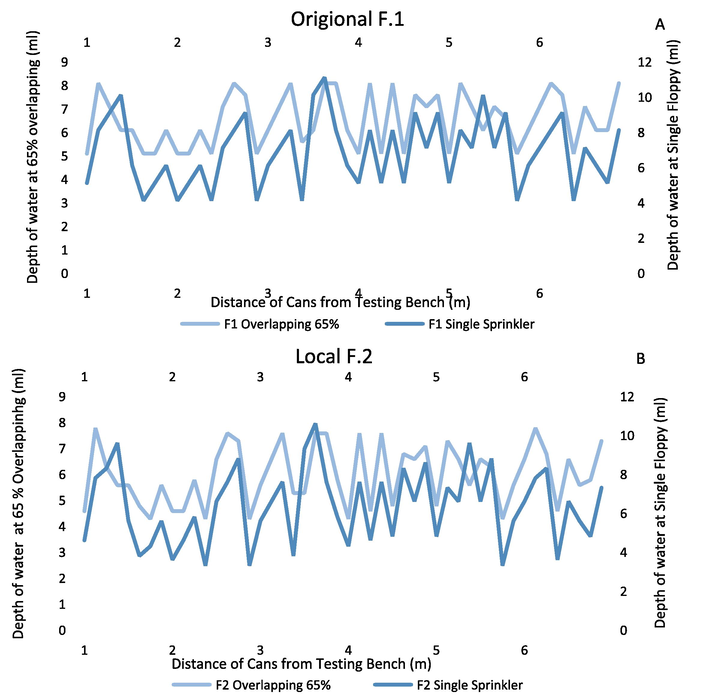
A & B: Amount of water received (ml) at Cans placing at various distances (m) of Single Floppy F.1 and F.2 and 65 % overlapping of two Floppies.
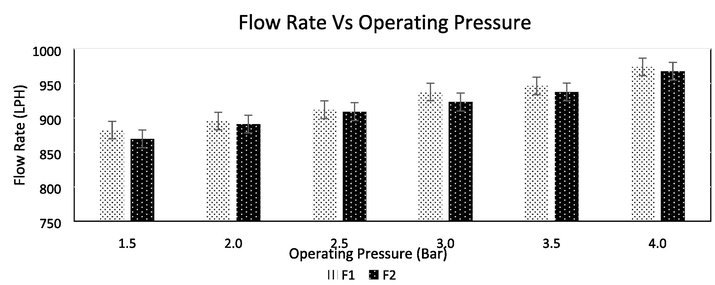
Pressure and flow rate relationship for both types of sprinklers.
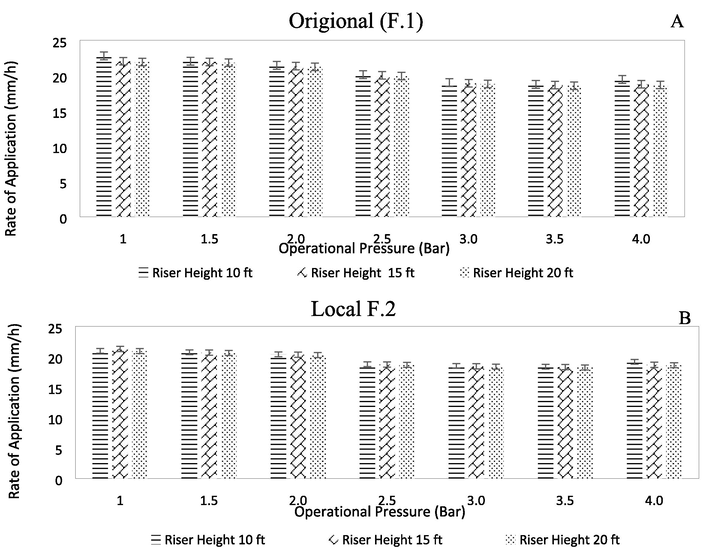
A&B: Average application rate for two types of floppy sprinklers under different operating pressure and height range.
The comparative results are revealed in above Fig. 6A&B, which shows the changes in a similar pattern. The CU increased with the increased operating pressure until it reached up to 2.5 bar. It would be declined when the operating pressure increased from 2.5 bar. It was observed that the CU values increased from 75.8 % to 84.5 % for F.1 and from 75.6 % to 83.2 % for F2 during the increase of working pressure from 1.0 to 2.5 bar at the height of riser 10 feet. In contrast, when the working pressure increased from 2.5 to 4.0 bar at the same height, the CU outcomes decreased from 84.5 to 69.0 % and 83.2–68.6 % for floppy sprinkler F.1 and F.2, respectively.
Also, the CU was affected by the riser height of the sprinkler too as presented in Fig. 6. When working pressure was raised from 1.5 to 2.5 bar at height 10 feet, the DU values increase from 55.6 to 70.7 % for F.1 and from 55.2 to 67.7 % for F.2. Meanwhile, the working pressure increased from 2.5 to 4.0 bar, and DU values decreased from 70.7 to 49.6 % and from 67.7 to 48.5 % for floppy sprinkler F.1 and F.2, respectively at the riser height of 10 feet. The DU values decreased at the same operating pressure when the riser height increased for 12and 15 ft. Similar results were obtained for CU at the same operating pressure when the riser height increases by 15ft and 20 ft. At the operating pressure of 2.5 bar, the values of DU were 70.7, 68.0, and 66.1% for F.1 sprinkler and 67.7, 66.1, and 64.6 % for F.2 sprinkler at riser heights of 15 and 20 ft., correspondingly (Figs. 7–9).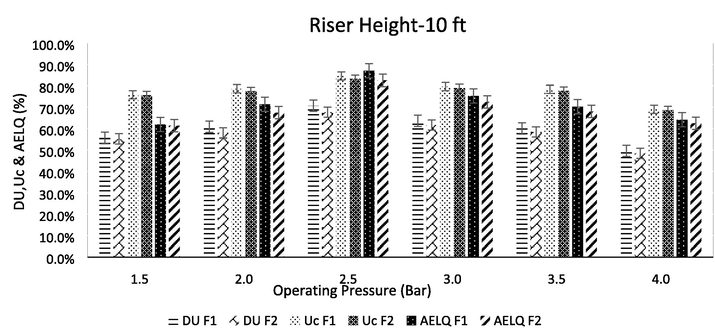
Relationship of operating pressure with DU, CU, and AELQ for two types of floppy sprinklers F1 and F2 at Riser height 10 ft.
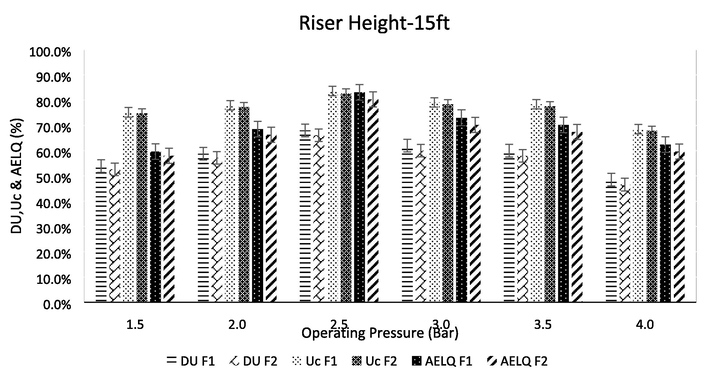
Relationship of operating pressure with DU, CU, and AELQ for two types of floppy sprinklers F1 and F2 at Riser height 15 ft.
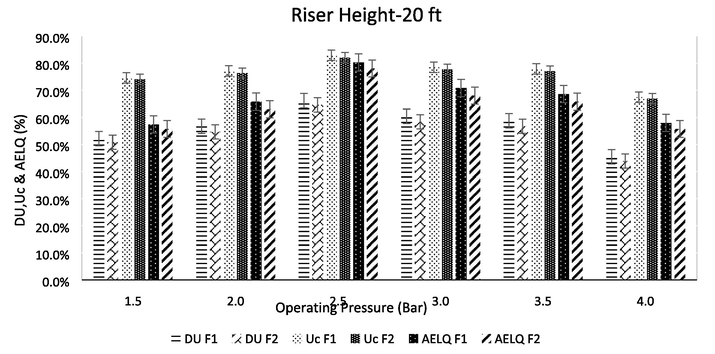
Relationship of operating pressure with DU, CU, and AELQ for two types of floppy sprinklers F1 and F2 at Riser height 20 ft.
The values of AELQ at different operating pressure levels and riser heights of F.1 and F.2 are presented. When operating pressure increased from 1.0 to 2.5 bar, the AELQ values increased from 61.9 to 87.0 % and from 61.3 to 82.5 % for F.1 and F.2, respectively. Meanwhile, when the working pressure was increased from 2.5 to 4.0 bar at the riser heights of 10 feet, the AELQ values decreased from 87.0 to 64.1 % and from 82.5 to 62.4 % for F1 and F2, respectively. A similar trend was established for heights of 15 and 20 feet, but with changed results. Besides, the increases of riser height from 10 to 20 feet lead the AELQ to be decreased from 61.9 to 57.4 % for F1 and from 61.3 to 55.7 % for F2, respectively, at the operating pressure 1.0 bar. The same trend was found for operating pressures of 1.5 to 4.0 bar, but with different values.
4 Discussion
The floppy sprinkler irrigation system was designed to achieve maximum distribution efficiency and yield the maximum crop yield. Floppy sprinkler comprises four main assemblies: floppy casing, silicon emitter tube, flow controller, and flow controller sleeve along with different main parts, i.e., sprinkler head, weight to retract tube, and floppy end cap. Floppy casing held all the parts and was strong enough to bear pressure from 1.8 to 8 bar. The selected range for operating pressure from 1.5 to 4 bar was considered to evaluate the cost of energy or power required to operate the system. The maximum power or energy helps the water or system to operate at the desired pattern. For this purpose, a flow controller fixed in FSS has the main function of creating the unique flow pattern and maintaining the pressure supported by the flow controller sleeve. Secondly, the silicon emitter tube contributes to creating that unique pattern under said pressure supported by the sprinkler head and weight to retract the emitter tube. The floppy sprinkler is unique in maintaining its pressure and flow rate under the said pressure range. This sprinkler system was an overhead cable system that causes no hurdles during agricultural practices and low maintenance costs.
The decreases in distribution uniformity, application efficiency, and Coefficient of the low quarter at small at high working pressures may be due to non-uniform water distribution. The main factors affecting water application (water distribution uniformity) are sprinkler nozzle type, operating pressure, nozzle diameters, nozzle material, heat, and dampness (Alemayehu, 2017; Ortiz, De Juan, & Tarjuelo, 2010). Such factors include wind speed and direction and sprinkler nozzle characteristics (Darko et al., 2017; Hewitt, 1998).
The results indicated a parallel trend of CU, DU, and AELQ with the maximum values at the operating pressure of 2.5 bar and riser height of 10 ft. The more improved water application uniformity could be achieved under the previously mentioned operating pressure and riser height. Also, the F1 sprinkler improved water application uniformity compared with F2 under all tested levels of operating pressure and riser height. It may be due to the manufacturing reliability of the F1 sprinkler.
Two types of sprinklers were investigated by (Tarjuelo, Montero, Honrubia, Ortiz, & Ortega, 1999) (i.e., center pivot and solid set system). The results revealed that when the working pressure raised from 210 to 480 kPa, the average CU was found 84.59 % for a solid established system. While the working pressure raised from 55 to 375 kPa, the result of CU reduced from 87.16 to 84.25 % for the center pivot. (Ahmed, 1994) revealed that when the height of the riser was raised from 50 to 150 cm, the CU values reduced from 78.50 to 72.0 % for Rain Bird sprinkler and 84.60–65.0 % for established sprinkler in the same working pressure of 150 kPa, and the size of the nozzle was about 3.5 × 2.4 mm. A study (Ismail, 1985) exposed that when the working pressure raised from 220 to 275 kPa, the AELQ outcomes fluctuated from 52.70 to 75.70 % under a low-pressure operating center pivot sprinkler system. An investigation carried by (B. M. Griffiths, School of Bioresources Engineering & Environmental Hydrology University of KwaZulu-Natal Pietermaritzburg, 2006) estimated seven floppy sprinklers and 27 sub-surface drips (SSD) systems about field distribution. They exposed that the UCs of floppy sprinklers fluctuated from 66.0 to 84.0 % and 53.0–98.0 % for the SSD system. Whereas the DUs of floppy sprinklers were fluctuated from 59.0 to 78.0 % and fluctuated from 33 to 94% for the SSD system.
According to (Amer, 2006), uniformity distribution of water at a high degree was achieved at 60% of sprinkler diameter at the square pattern, and the triangular pattern was created at 50% to 70% of sprinkler spacing. The recommended spacing of sprinklers was 50% for square and 50% to 60% for triangular layout.
5 Conclusions
Floppy Sprinkler is unique and innovative for arid and semi-arid areas. This system is more reliable due to its low energy and operational cost. It was installed with a fixed structure and hang on two poles. Therefore, it produced more efficient results due to control wear and tear cost. This research concluded that the performance of both types of floppy sprinklers was more effective at 2.5 bar operating pressure and 10ft riser height. The results led to the following concluding points.
-
Increase the operating pressure by increasing the application rate or flow rate for both types of sprinkler floppy.
-
Maximum water distribution uniformity was attained on 2.5 bar operating or riser altitude of 10 ft.
-
The system designed on 65% or above overlapping produced the maximum wetted radius.
Acknowledgment
This work was supported by the project TDF-02-217 funded by Higher Education Commission (HEC) Pakistan. Amor Hedfi and Mohammed Almalki are thankful to the Deanship of Scientific Research at Taif University for funding through project number (TURSP 2020/225), Taif University, Taif, Saudi Arabia.
Declaration of Competing Interest
The authors declare that they have no known competing financial interests or personal relationships that could have appeared to influence the work reported in this paper.
References
- Ahmed, A. (1994). Design of sprinkler and drip irrigation systems in newly reclaimed soils.
- The Water Crisis in the Middle East: Exploring the Relationship Between Water Insecurity and Political Instability. Georgetown University in Qatar, GU-Q; 2021.
- Alemayehu, M. (2017). Evaluating The Effect Of Drag line Sprinkler Operating Pressure, Riser Height, Nozzle Size And Wind Velocity On Irrigation Water Application Under Different Wind Speed Conditions; The Case Of Tedecha Large Scale Irrigation Scheme.
- Amer, K. H. J. M. J. A. E. (2006). Water distribution uniformity as affected by sprinkler performance. 23(1), 82-94.
- Christiansen, J. J. T. o. t. A. S. o. C. E. (1942). Closure to “Christiansen on Sprinkling Systems For Irrigation”. 107(1), 248-250.
- Darko, R. O., Shouqi, Y., Junping, L., Haofang, Y., Xingye, Z. J. I. J. o. A., & Engineering, B. (2017). Overview of advances in improving uniformity and water use efficiency of sprinkler irrigation. 10(2), 1-15.
- Elshaikh, A. E., Jiao, X., & Yang, S.-h. J. A. w. m. (2018). Performance evaluation of irrigation projects: Theories, methods, and techniques. 203, 87-96.
- Griffiths, B., & Lecler, N. (2001). Irrigation system evaluation. Paper presented at the Proc S Afr Sug Technol Ass.
- Gu, J., Lu, Y., Ji, R., Wang, Z., Jia, L., & Mo, S. J. M. G. (2020). Channel response to low water levels in the Pearl River Delta: A multi-decadal analysis. 429, 106290.
- Hamidov, A., & Helming, K. J. S. (2020). Sustainability considerations in water–energy–food nexus research in irrigated agriculture. 12(15), 6274.
- Hanson, B. R., May, D. M., & Schwankl, L. J. J. H. (2003). Effect of irrigation frequency on subsurface drip irrigated vegetables. 13(1), 115-120.
- Hartin, J. S., Fujino, D. W., Oki, L. R., Reid, S. K., Ingels, C. A., & Haver, D. J. H. (2018). Water requirements of landscape plants studies conducted by the University of California researchers. 28(4), 422-426.
- Efficiency and uniformity. In: Design and Operation of Farm Irrigation Systems (2nd Edition). American Society of Agricultural and Biological Engineers; 2007. p. :108-119.
- [Google Scholar]
- The importance of nozzle selection and droplet size control in spray application. In: Paper presented at the Proc. of the North American Conf. on Pest. Spray Drift Manag. 1998.
- [Google Scholar]
- Ismail, S. J. M. J. A. E. (1985). Water distribution under low-pressure center-pivot sprinkler irrigation system. 2(4), 81-96.
- Principles of farm irrigation systems design. John Wiley and Sons Limited; 1988.
- Liu, J., Zhu, X., Yuan, S., & Fordjour, A. J. W. (2019). Modeling the application depth and water distribution uniformity of a linearly moved irrigation system. 11(4), 827.
- Performance evaluation of sprinkler irrigation system at Mambilla beverage limited, Kakara-Gembu. Taraba State-Nigeria.. 2018;37(1):268-274.
- [Google Scholar]
- Ortiz, J., De Juan, J., & Tarjuelo, J. J. B. e. (2010). Analysis of water application uniformity from a centre pivot irrigator and its effect on sugar beet (Beta vulgaris L.) yield. 105(3), 367-379.
- Distribution of soil water and nitrate in furrow irrigation under different plastic mulch placement conditions for a maize crop. Field and modelling study. 2021;35(2):131-144.
- [Google Scholar]
- Pereira, L. S., Oweis, T., & Zairi, A. J. A. w. m. (2002). Irrigation management under water scarcity. 57(3), 175-206.
- Effects of Irrigation, Herbicide, and Oat Companion Crop on Spring-Seed Alfalfa. In: Paper presented at the Western Society of Crop Science Annual Meeting (WSCS). 2021.
- [Google Scholar]
- Roger, D., Lamm, F., Mahbub, A., Trooien, T., Clark, G., Barnes, P., & Kyle, M. J. I. M. S. K. (1997). Efficiencies and Water Losses of Irrigation System.
- Rundo, M. J. S. m. p., & theory. (2017). Theoretical flow rate in crescent pumps. 71, 1–14.
- Sadeghi, M., Shearer, E. J., Mosaffa, H., Gorooh, V. A., Naeini, M. R., Hayatbini, N., . . . Sorooshian, S. J. J. o. H. (2021). Application of remote sensing precipitation data and the CONNECT algorithm to investigate spatiotemporal variations of heavy precipitation: Case study of major floods across Iran (Spring 2019). 600, 126569.
- Samimi, M., Mirchi, A., Moriasi, D., Ahn, S., Alian, S., Taghvaeian, S., & Sheng, Z. J. J. o. H. (2020). Modeling arid/semi-arid irrigated agricultural watersheds with SWAT: Applications, challenges, and solution strategies. 125418.
- Shabbir, A., Mao, H., Ullah, I., Buttar, N. A., Ajmal, M., & Lakhiar, I. A. J. A. (2020). Effects of drip irrigation emitter density with various irrigation levels on physiological parameters, root, yield, and quality of cherry tomato. 10(11), 1685.
- Tarjuelo, J. M., Montero, J., Honrubia, F., Ortiz, J., & Ortega, J. J. A. W. M. (1999). Analysis of uniformity of sprinkle irrigation in a semi-arid area. 40(2-3), 315-331.
- Xiang, Q., Xu, Z., & Chen, C. J. J. D. I. M. E. (2018). Experiments on air and water suction capability of 30PY impact sprinkler. 36(1), 82-87.
- Zema, D. A., Nicotra, A., & Zimbone, S. M. J. I. S. (2019). Improving management scenarios of water delivery service in collective irrigation systems: a case study in Southern Italy. 37(1), 79-94.
- Zhang, L., Fu, B., Ren, N., & Huang, Y. J. W. (2019). Effect of pulsating pressure on water distribution and application uniformity for sprinkler irrigation on sloping land. 11(5), 913.


