

Translate this page into:
Pb2+ ions adsorption onto raw and chemically activated Dibetou sawdust: Application of experimental designs
⁎Corresponding author. fehmiboufahja@yahoo.fr (Fehmi Boufahja)
-
Received: ,
Accepted: ,
This article was originally published by Elsevier and was migrated to Scientific Scholar after the change of Publisher.
Abstract
Dibetou wood sawdust, SEM and IRTF characterized, collected from a local sawmill, was used in its raw and chemically activated forms using nitric acid and sodium hydroxide to retain Pb2+ ions, according to several parameters (pH, contact time, initial metal concentration, mass of adsorbent and temperature of the medium). The results obtained reveal that the removal rate of Pb2+ ions on raw and activated Dibetou sawdust reached a percentage of about 84% and 93% successively. The experimental design methodology using the full factorial design has enabled us to study and to check the influence of the various parameters on Pb2+ ions adsorption onto raw and activated Dibetou sawdust; it allowed us, also, to define the interactions between these latters. A response surface methodology (RSM) based on the central composite design (CCD) was used to optimize this process. The results obtained showed that initial concentration, pH, contact time and mass of adsorbent affected the lead (II) removal by adsorption. The optimum conditions were found as pH = 6, mass of adsorbent = 0.875 g per 100 mL of solution and contact time = 90 min for raw Dibetou and 47.5 min for activated Dibetou using a concentration of 275 mg.L−1 of metallic ion. In these conditions, removal rates of Pb2+ ions reach 94% onto raw sawdust and 99% using its activated form. The adsorption data are well fitted with Langmuir isotherm. The maximum adsorption capacities are 33.33 mg·g−1 for the raw sawdust and 61.73 mg·g−1 for its activated form. Kinetic modeling is well described by the pseudo-second order model (0.99 < R2 < 1). Raw and/or activated Dibetou sawdust have good efficiency for the removal of Pb2+ ions, which making them environmentally friendly decontaminants of choice of polluted waters.
Keywords
Dibetou sawdust
Lead II adsorption
Chemical activation
Experimental designs

1 Introduction
The environmental protection is one of the sustainable development challenges; it is considered a major pillar for the future of living beings and the entire planet. Nowadays, humanity is facing an ecological disaster because of the environmental pollution by various materials (organic and inorganic) of different origins (Strungaru et al., 2018; Guzzetti et al., 2018; Prokić et al., 2018; Alimba and Faggio, 2019; Stara et al., 2019a,b; Fiorino et al., 2018; Chromcova et al., 2015; Plhalova et al., 2017; Savoca et al., 2019).
The growth and diversity of industrial activities have contributed massively to the economic progress and to the development of countries. But unfortunately, this development is always accompanied by an immense degradation of the ecosystems by the generation of different types of pollution (Bouras, 2003; Demim et al., 2013; Gobi et al., 2018; Sehonova et al., 2018; Torre et al., 2013; Capillo et al., 2018; Fazio et al., 2014; Vajargah et al., 2018; Vajargah et al., 2019; Vijayakumar et al. 2019; Burgos-Aceves et al., 2018). The entirety or great majority of the industries use toxic chemicals in their manufacturing processes. Among these substances we mainly find heavy metals, which are used in large quantities (Vignes, 1993; Jitar et al., 2015; Strungaru et al., 2015; Plavan et al., 2017) and this explains the increasing rate of the effluents loaded with these metals, which find their way to the ecosystems and water bodies through liquid discharges from industries such as batteries, pigments and paints, metallurgy, tanning, pulp and paper, petroleum refining and rubber processing industries, etc. (Meena et al., 2008; El Hajam et al., 2020).
Lead is considered to be one of the most dangerous micropollutants for humans, plants and animals and it is highly toxic even in tiny quantities (Carretero, 2002; Zhang et al., 2013). It causes the death of plants and animals, as well as anemia, brain damage, mental retardation, anorexia, vomiting and various types of serious health problems leading to death in extreme cases (Waldron and Stöfen, 1974; Niu et al., 1993). It has also a great ability to replace calcium in bone tissue and accumulates there (Harte et al., 1991; Yu et al., 2001).
Given the adverse effects of these metals on the environment and health, it is essential to eliminate them from all types of industrial effluents before their release into the aquatic systems (Savorelli et al. 2017; Pagano et al., 2017; Faggio et al., 2018; Aliko et al., 2018). A number of technologies have been developed for the removal and recovery of these toxic metal ions, through the implementation of specific processes, namely chemical precipitation (Collon et al., 2005), electrodeposition (Kowalik et al., 2008), liquid-liquid extraction (Testard et al., 2007), coagulation-flocculation (Karthik et al., 2008), reverse osmosis (Thekkedath et al., 2007) and activated carbon adsorption (Momčilović et al., 2011). However, most if not all of these methods are generally expensive, except the adsorption, which has become a method of choice (El Hajam et al., 2019a), but remains limited by the high price of the adsorbent material.
For this purpose, the choice of adsorbent material is a key step for the development of a simple, effective, inexpensive and environmentally friendly treatment technique. Adsorbents that meet these requirements are biodegradable and low cost materials compared to the ion exchange resins or the activated carbon which its generation presents low performance, increasing the cost of its utilization (Al-Asheh and Duvnjak, 2011). Among these materials they are: sunflower stalks (Sun and Shi, 1998), rice husks (Khalid et al., 1999), almond husks (Hasar, 2003), mango sawdust (Ajmal et al., 1998), wood bark (Gaballah and Kilbertus, 1998), grain residues (Low et al., 2000), peat (Ho et al., 1996), onion peel (Kumar and Dara, 1981), tea leaves (Orhan and Büyükgüngör, 1993) etc. These adsorbents are used either in their native state or by making them a suitable chemical treatment. The adsorption capacity can be considerably improved (Raji and Anirudhan, 1997).
The experimental design methodology is a collection of mathematical and statistical techniques, which can be used to evaluate the significance of various affecting factors and to optimize some industrial processes (Khuri and Cornell, 1996). It can result in improved product yields, reduced process variability, development time and overall costs. It is also possible to reduce the number of experiments (Seyhan et al., 2007).
Full factorial design model was used to evaluate and investigate the effects of experimental parameters and their interactions. An optimization was achieved using response surface methodology based on central composite design, which aims to determine the optimum operational conditions for the system (Annadurai et al., 2002).
Our work is part of this perspective, which involves testing the capacity of Dibetou wood sawdust in its raw and chemically activated state using nitric acid and sodium hydroxide to fix Pb2+ ions contained in aqueous solutions with different concentrations. After characterizing the raw and activated sawdust by scanning electron microscopy and infrared spectroscopy, the study of the effects of initial lead concentration, mass of adsorbent, contact time, temperature and pH were investigated. The examination of the main factors affecting the adsorption process and their interactions followed by its optimization were studied by the application of experimental designs method. Kinetic and isothermal experiments were conducted to evaluate the adsorption rate of Pb2+.
2 Materials and methods
2.1 Adsorbent
2.1.1 Raw wood sawdust
Dibetou wood sawdust was collected from a primary wood processing industry in Fez city/Morocco. It was washed several times with water, dried at 105 °C during 24 h and then crushed and sieved to particle sizes of 100–500 µm.
2.1.2 Chemically activated wood sawdust
The raw Dibetou sawdust was subjected to a double chemical activation by nitric acid (20%) and by sodium hydroxide (1 mol.L−1) according to the following protocols:
-
‐
The sawdust was first pretreated by 20% HNO3 with a liquid/solid ratio of 10:1 and stirred for 4 h at 60 °C. After filtration, washing with water was carried out until a pH equal to 7. Then the pretreated sawdust was dried at 105 °C for 6 h.
-
‐
The pre-hydrolyzed sawdust was treated with sodium hydroxide (NaOH), by adding 250 mL of NaOH (1 mol.L−1) to 10 g of previously pre-hydrolyzed Dibetou; the mixture was then mechanically stirred for 1 h at 90 °C. After filtration, the treated sawdust was washed with tap water until a pH of 7 and then dried for 4 h at 105 °C.
2.2 Adsorbate
Stock solution of lead (II) was prepared by dissolving lead nitrate Pb(NO3)2 in double distilled water. Pb (II) solutions of different desired concentrations were obtained by diluting the stock solution. Standard solution of Pb(II) (1000 mg.L−1) for atomic adsorption spectrophotometer was obtained from Merck, Germany. 0.1 mol.L−1 NaOH and 0.1 mol.L−1 HNO3 were used for pH adjustment.
2.3 Characterization of adsorbent
The raw and activated Dibetou sawdust were characterized by Scanning Electron Microscopy (SEM: Philips XL30i scanning electron microscope) and the surface functional groups were detected by the Fourier Transform Infrared Spectroscopy (FTIR: Perkin Elmer brand spectrometer) using a KBr wafer with the wavenumber ranging 500–4000 cm−1.
2.4 Pb2+ ions adsorption process
The adsorption of Pb2+ ions onto raw and activated Dibetou wood sawdust was investigated by batch technique. The removal rate study was followed as a function of initial lead concentration (C), mass of adsorbent (m), contact time (t), pH of the solution (pH) and temperature of the medium (T).
After the adsorption process, the concentration of Pb2+ ions was determined by flame atomic absorption spectrometry (AAS) using a GBC 932 AA spectrophotometer.
The quantities adsorbed (qe) are conventionally calculated by the difference between the initial and the equilibrium concentrations, according to the Eq. (1):
The adsorption rate (% ads) of Pb2+ ions was calculated using Eq. (2):
2.5 Experimental designs methodology
During this study, we have adopted two types of experimental designs namely:
-
‐
The 2 k-full factorial design that aims to evaluate the effect of a number of factors (k = 5) which are pH of the solution (pH), temperature of the medium (T), contact time (t), mass of the adsorbent (m) and initial metal concentration (C) on the adsorption rate of Pb2+ ions (% Ads), using raw and activated Dibetou sawdust. It consists in taking for each factor two significant values (or levels) which correspond to the limits of the domain of variations. The lower bound is the low level (-1) and the upper bound is the high level (+1). The regression equation is given by the following mathematical model (Eq. (3)):
During this study, we consider that the interactions between three or more variables are negligible.
-
‐
The response surface methodology that allows to define the optimal experimental conditions in order to reach a maximum adsorption rate, using central composite design with k factors which include Nf tests of a full factorial plan 2k, 2 k star tests on the axes and N0 central tests.
The regression equation is expressed by the second order polynomial model (Eq. (4)):
All results and calculations (regression, statistical tests and graphs) were performed with Nemrodw software (New Efficient Methodology for Research Using Optimal Design, LPRAI).
2.6 Monitoring of adsorption kinetic
The kinetic study of Pb2+ adsorption on raw and activated Dibetou sawdust has been conducted based on the correlation between the experimental results and those obtained with two models of kinetics, namely:
-
‐
Lagergren model (pseudo-first order) which is expressed by the Eq. (5):
-
‐
Blanchard model (pseudo-second order) which is expressed by the Eq. (6):
The agreement between the experimental results and those predicted by these models was based on the determination coefficients (R2) and the values of the theoretical and experimental maximum capacities.
2.7 Modeling of adsorption isotherms
Langmuir and Freundlich models were chosen to describe the adsorption of Pb2+ ions at equilibrium, which allows the calculation of experimental data for the adsorption reactions. Langmuir (Eq. (7)) and Freundlich (Eq. (8)) models can be represented by the following mathematical equations:
where, Ce is the concentration of lead (II) at equilibrium (mg.L−1), qe is the adsorbate amount per unit of the adsorbent mass at equilibrium (mg.g−1), qmax is the theoretical maximum adsorption capacity (mg.g−1) and b is the adsorption constant.
3 Results and discussions
3.1 Characterization of raw and activated Dibetou sawdust
3.1.1 Scanning electron microscopy (SEM)
The morphological analysis of both raw and activated Dibetou sawdust by scanning electron microscopy shows that the fibers of raw sawdust (Fig. 1-A) are intact and have a heterogeneous outer surface, which is due to the existence of natural constituents of wood (waxes, resins, pectins, hemicellulose, lignin…etc.) that cover the bundles of microfibrils (El Hajam et al., 2019b). However, after the chemical treatments with nitric acid and hydroxide of sodium (Fig. 1-B) significant changes in the surface topography have been observed; it is seen that the cellulosic fibers are separate and well identical, even if they do not have a well-defined orientation. The chemical activation has therefore allowed the dissolution of the extractive material, hemicelluloses and an important part of the lignin, resulting in a reduction of the length of the microfibrils and the improvement of sawdust porosity (Mirahmadi et al., 2010).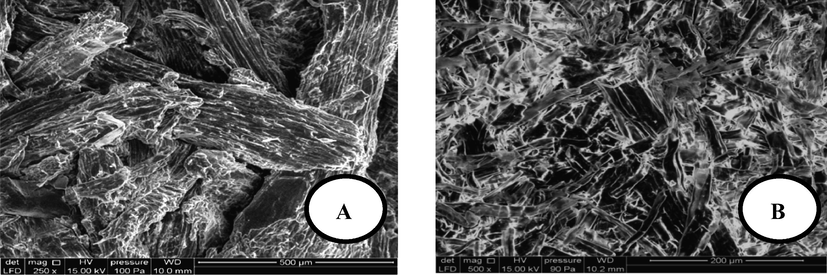
SEM photos of Dibetou sawdust; (A): Raw sawdust and (B): Activated sawdust.
3.1.2 Infrared absorption spectroscopy (IRTF)
The analysis and the comparison of the infrared absorption spectra (Fig. 2) reveals some differences in the characteristic bands between raw and activated Dibetou. The treatment of sawdust with nitric acid and sodium hydroxide leads to a decrease in the intensity of the absorption band located at 3390 cm−1 which corresponds to the elongation vibrations of O—H bond of the aromatic and aliphatic structures of phenol, lignin and cellulose (Sain and Panthapulakkal, 2006). The absorption band detected at 1725 cm−1 which is characteristic of C⚌O valence vibration of carboxylic acids and/or xylan esters present in hemicelluloses and lignins (Sun et al. 2005; Mortazavi and Kamali, 2010) was completely disappeared from the spectrum of activated sawdust because of the elimination of most hemicelluloses and lignin. The pics at 1500 cm−1, 1381 cm−1 and 1163 cm−1 which are attributed to the deformation C⚌C of the aromatic cycles of the lignin, to C—H bending vibration and to C–O–C asymmetric stretch vibration in cellulose and hemicelluloses successively (Himmelsbach et al., 2002, El Hajam et al., 2019b) were completely removed after the treatments. The bands observed at 1137 cm−1, 1115 cm−1 and 1032 cm−1 became larger after the chemical treatment because of the removal of hemicellulose and lignin, thus increasing the cellulose level.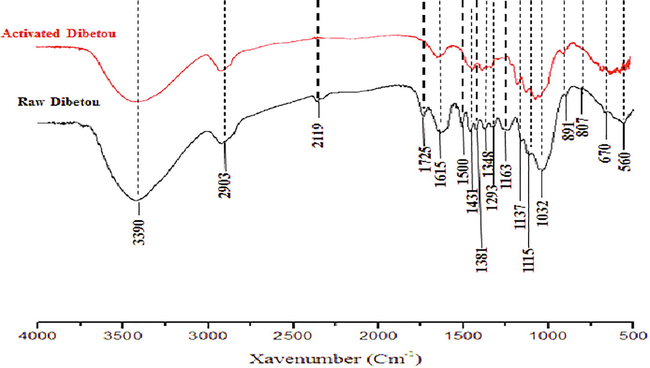
Infrared spectrum of raw and activated Dibetou sawdust.
3.2 Adsorption process: preliminary study
3.2.1 Effect of initial Pb2+ concentration
The study of the influence of the initial metal concentration on the adsorption rate is carried out by considering seven concentrations namely 10, 20, 50, 100, 200, 300 and 500 mg.L−1. The experiments were conducted using 100 mL of lead solution with a pH of 6 containing 2 g of Dibetou sawdust. The whole is stirred at room temperature for 2 h.
The results obtained (Fig. 3) indicate that the adsorption rate of Pb2+ ions onto raw Dibetou sawdust reached a percentage of about 84% and it remained virtually constant over a concentration range of 10 to 100 mg.L−1. However, an adsorption rate of 91% was noted using the activated Dibetou sawdust over a concentration range of 10 to 250 mg.L−1. This led to the establishment of a plateau indicating a steady state resulting from the saturation of the active sites. But, by exceeding these intervals, removal rates of Pb2+ ions decrease progressively to reach 44% with raw Dibetou and 72% with its activated form using an initial concentration of about 500 mg.L−1 of Pb2+.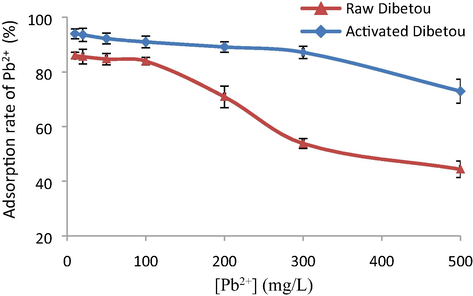
Effect of initial Pb2+ concentration on the adsorption rate (pH = 6, m = 2 g, V = 100 mL, t = 2 h and room temperature), values are expressed as mean ± SD (n = 2), (p < 0.05).
The analysis of the results obtained shows that the chemical activation of Dibetou sawdust resulted in higher adsorption rates, exceeding those obtained using raw sawdust of about 10% when the initial Pb2+ concentration is less than 100 mg.L−1 and about 30% when this latter reaches 500 mg.L−1. Then, it can be concluded that the chemical treatment of Dibetou sawdust ensured activation of the adsorption sites, by minimizing the content of the lignin and hemicelluloses contained therein and by increasing the porosity of the adsorbent matrix and its specific surface (Mahmoudi et al., 2014). The same conclusion was reported by Srinivasa et al. (2007), proving that chemical activation of sawdust with acid improves the ability of the material adsorbent to attach to the adsorbate.
3.2.2 Effect of adsorbent quantity
The evolution of the adsorption rate of Pb2+ ions as a function of the adsorbent quantity was carried out by dispersing increasing amounts of sawdust, ranging from 0.25 to 3 g in 100 mL of lead solution which has an initial concentration of 100 mg.L−1 and an initial pH of 6. The mixture was stirred at room temperature for 2 h.
The results obtained (Fig. 4) show that the increase in the adsorbent mass leads to a gradual improvement in the removal rate of Pb2+ ions.![Effect of adsorbent quantity on the adsorption rate of Pb2+ ([Pb2+] = 100 mg/L, V = 100 mL, pH = 6, t = 2 h and room temperature), values are expressed as mean ± SD (n = 2), (p < 0.05).](/content/185/2020/32/3/img/10.1016_j.jksus.2020.02.027-fig4.png)
Effect of adsorbent quantity on the adsorption rate of Pb2+ ([Pb2+] = 100 mg/L, V = 100 mL, pH = 6, t = 2 h and room temperature), values are expressed as mean ± SD (n = 2), (p < 0.05).
The adsorption rate of Pb2+ ions increases from 49.36% for raw sawdust to 55.6% for activated sawdust when the mass of these sawdusts is 0.25 g. However, with a mass of 3 g these rates reached 81.24% for raw Dibetou and 93.52 for the activated Dibetou.
Indeed, if the dispersed adsorbent amount increases, the active adsorption sites will be more numerous, thus promoting the retention of Pb2+ ions. The same remark was noted by Argun et al. (2007), El Hajam et al., 2019b and Rafatullaha et al. (2009) for oak, Cedar and Meranti sawdusts successively. In addition, it can be concluded that the activated sawdust ensures a retention of Pb2+ ions which exceeds 12% that obtained by the raw sawdust.
We have also noted that from a determined amount of sawdust, there was establishment of an equilibrium plateau because of the saturation of the active sites of adsorption. This optimum dose was equal to 1 g for activated sawdust and to 1.5 g for raw sawdust. A similar observation was previously reported by Ajmal et al. (1998) and Fiset et al. (2000) for the adsorption of Cu (II) on Mango sawdust.
3.2.3 Effect of pH of lead solution
In this study, we tested the effect of the pH of lead (II) solution on the adsorption rate of Pb2+ ions. The pH values vary from 1 to 6 with a pitch of 1, by adding 2 g of each type of sawdust to the solutions, the whole mixture was then stirred for 2 h at room temperature.
The results obtained (Fig. 5) show that the adsorption process of Pb2+ ions was effectively influenced by the initial pH of the medium. There was an increase in the removal rate of Pb2+ with increasing pH of the solution. Indeed, when the pH of the medium passes from 1 to 6 successively, the adsorption rate of Pb2+ passes from 48% to 83% for the raw Dibetou and from 59% to 92% for activated Dibetou.![Effect solution pH on the adsorption rate of Pb2+ ([Pb2+] = 100 mg/L, m = 2 g, V = 100 mL, t = 2 h and room temperature), values are expressed as mean ± SD (n = 2), (p < 0.05).](/content/185/2020/32/3/img/10.1016_j.jksus.2020.02.027-fig5.png)
Effect solution pH on the adsorption rate of Pb2+ ([Pb2+] = 100 mg/L, m = 2 g, V = 100 mL, t = 2 h and room temperature), values are expressed as mean ± SD (n = 2), (p < 0.05).
The analysis of these data has led us to notice that the adsorption rates of Pb2+ ions on activated sawdust exceed those obtained using raw sawdust by 10%.
This result can be explained by the fact that in a strongly acidic medium (pH < 3), the concentration of H+ ions in solution is very high and thus compete with the Pb2+ ions for the active sites of the adsorbent, which leads to a drop in the effectiveness of sawdust to fix Pb2+ ions. By increasing the pH of the solution (3 < pH < 5), the concentration of H+ protons decreases, however that of Pb2+ ions remains constant, which explains the increase in the adsorption rate. At pH = 6, it is assumed that there are fewer H+ protons in the solution which justifies the maximum rate of adsorption from this pH value. But at pH values above 6, the precipitation process becomes dominant or the ion exchange and the formation of metallic hydroxide can become significant mechanisms in the Pb2+ removal process.
According to the solubility product constant of Pb(OH)2 (Ksp = 1.43 x10⁻¹⁵) and the initial Pb2+ concentration of 100 mg.L−1, the pH of appearance of lead hydroxide (Pb(OH)2) calculated is 8.33, which indicates that the choice of our pH range is reasonable, because the metal precipitation could lead to a false calculation of the adsorption capacity. The same observation was reported by Deng et al. (2010), and Hao et al. (2012), who studied the adsorption of Pb (II) on functionalized graphene.
3.2.4 Effect of temperature
The experiments of this study were carried out in a range of 25 to 50 °C. The conditions of the experiment are as follows: Pb2+ concentration of 100 mg.L−1, pH of 6 and 2 g of sawdust. The mixture was stirred for 2 h.
The results obtained (Fig. 6) show that the adsorption rate of Pb2+ ions is inversely proportional to the temperature. It is therefore an exothermic adsorption phenomenon. The same result was previously reported by Jianga et al. (2009) in the study of Cu (II) adsorption on modified bagasse.![Effect of temperature on adsorption rate of Pb2+ ([Pb2+] = 100 mg/L, pH = 6, m = 2 g, V = 100 mL and t = 2 h), values are expressed as mean ± SD (n = 2), (p < 0.05).](/content/185/2020/32/3/img/10.1016_j.jksus.2020.02.027-fig6.png)
Effect of temperature on adsorption rate of Pb2+ ([Pb2+] = 100 mg/L, pH = 6, m = 2 g, V = 100 mL and t = 2 h), values are expressed as mean ± SD (n = 2), (p < 0.05).
The decrease in the removal rate of Pb2+ ions can be explained by the degradation of some sites responsible for the adsorption and by the solubilization of low-molecular-weight organic compounds present in raw Dibetou sawdust, which weakens the adsorption forces between the active sites of sawdust and the solution loaded with Pb2+ and also between the adjacent molecules of the adsorbed phase.
3.2.5 Effect of contact time
The plot of the adsorption rate as a function of time (Fig. 7) shows that the adsorption equilibrium was practically reached after the first 60 min of the contact with activated Dibetou sawdust and after 90 min of contact with raw sawdust.![Evolution of the adsorption rate of Pb2+ as a function of time ([Pb2+] = 100 mg/L, m = 2 g, V = 100 mL pH = 6 and room temperature), values are expressed as mean ± SD (n = 2), (p < 0.05).](/content/185/2020/32/3/img/10.1016_j.jksus.2020.02.027-fig7.png)
Evolution of the adsorption rate of Pb2+ as a function of time ([Pb2+] = 100 mg/L, m = 2 g, V = 100 mL pH = 6 and room temperature), values are expressed as mean ± SD (n = 2), (p < 0.05).
Based on the same treatment method, other studies (Yu et al., 2001; Ahmad et al., 2009) have shown that a contact time of 2–3 h is sufficient to have a maximum retention rate of Pb2+ ions on other types of wood sawdust namely maple and Meranti.
The adsorption of Pb2+ ions on raw and activated wood sawdust was done in three steps:
The first step corresponds to a rapid adsorption during the first 20 min, because of the saturation of the accessible sites located at the solid-liquid interface. The adsorption rates were 78.4% for raw Dibetou and 85.52% for activated Dibetou.
The second step was slower, it lasted 40 min and the adsorption was done by the diffusion of the metal in the micropores.
The last stage which is characterized by a plateau was due to the establishment of a balance between the adsorption and desorption speeds. The adsorption rates in this step were about 84.48% with raw sawdust and 92.56% with the activated one.
The analysis of these results has shown that the activated sawdust was very effective in retaining the maximum of Pb2+ ions in a short time compared to raw sawdust.
3.3 Experimental designs
3.3.1 Full factorial design
The domain of study of each parameter was defined based on the results of the preliminary study of Pb2+ adsorption on raw and activated sawdust. The five factors chosen are shown in Table 1, by giving for each of them a minimum value (-1) and a maximum value (+1).
Designation
factors studied
Low level (-1)
High level (+1)
Coefficients
X1
m (g)
0.25
1.5
b1
X2
C (mg.L−1)
50
500
b2
X3
T (°C)
25
50
b3
X4
pH
1
6
b4
X5
t (min)
5
90
b5
We have chosen two-level full factorial design with five factors (25), by performing a repetition for each experiment, so the total number of experiments required for this study was 64.
3.3.1.1 Statistical validation of the model
3.3.1.1.1 Analysis of variance
The significance of the independent variables and their interactions was tested with various statistical analyses such as analysis of variance (ANOVA), coefficients of determination (R2), and adjusted determination coefficients (R2 A).
The results presented in Table 2 for both raw and activated sawdust reveal that the main effect of the regression is significant, since the probability of the significance of p-value risk is less than 0.05. Furthermore, the model does not show lack of adjustment, since the probability of risk significance is greater than 0.05 (p-values are 80.4 for raw Dibetou and 7.4 for activated Dibetou). The coefficients of determination (R2) which are 94% for the raw Dibetou and 93% for the activated Dibetou are enough to validate the model, because these latters give a good agreement between the experimental values and those predicted.
Source of variation
Sum of squares
Degrees of freedom
Mean square
Rapport
Signif. P-value
Raw Dibetou sawdust
Regression
8.67548 * 104
15
5.78366 * 102
56.0556
<0.01 ***
Residual
4.95250 * 102
48
10.3177
Validity
1.23750 * 102
16
7.73438
0.6662
80.4
Error
3.71500 * 102
32
11.6093
Total
9.17073 * 103
63
R2
0.946
R2A
0.929
Activated Dibetou sawdust
Regression
1.07213 * 104
15
7.14757 * 102
44,2688
<0,01 ***
Residual
7.75000 * 102
48
16.1458
Validity
3.68500 * 102
16
23.0313
1.8130
7.4
Error
4.06500 * 102
32
12.7031
Total
1.14963 * 104
63
R2
0.933
R2A
0.912
3.3.1.1.2 Residue distribution
The results of residue distribution (Fig. 8) are consistent with those obtained by the analysis of variance (Table 2), showing that the residues are distributed randomly according to the response Y. Based on these results we can conclude that the adapted model is validated.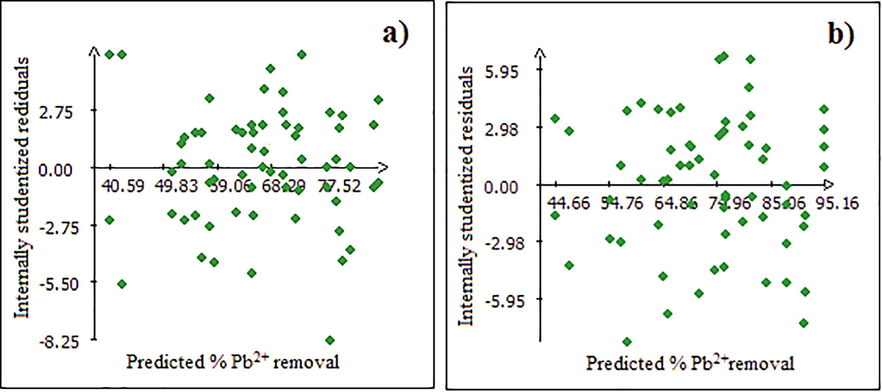
Study of residue; (a: Raw Dibetou and b: Activated Dibetou).
3.3.1.2 Study of the effect of factors on Pb2+ ions adsorption
3.3.1.2.1 Estimation of the coefficients
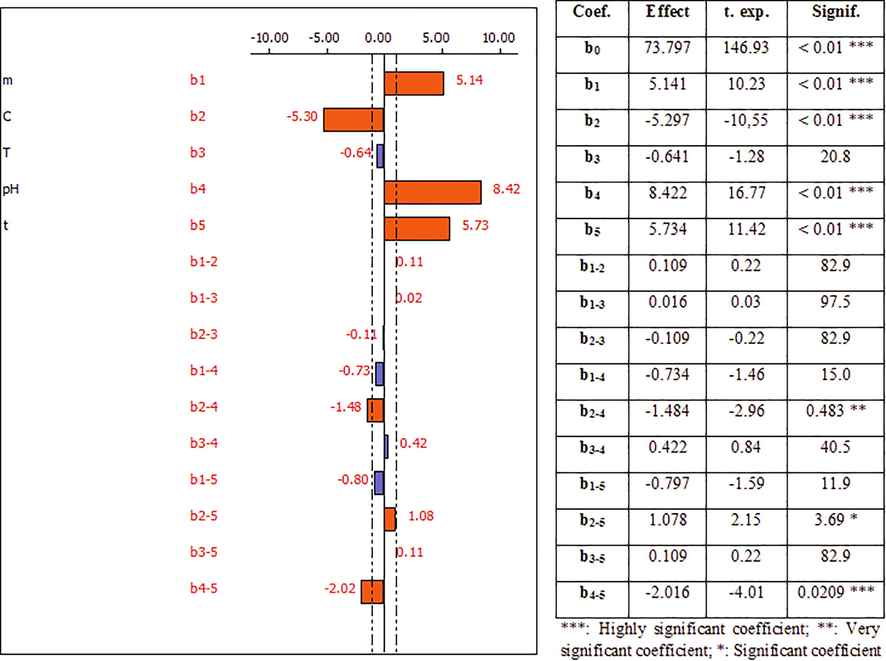
Figs. 9 and 10 link each coefficient to its “t-student” values which determine the significance of the determination coefficients of each factor and to its “p-values” which are defined as the lowest level of significance that reject the null hypothesis H0 (bi = 0 and α = 0.05). More the t-student’s value is higher, more the p-value is lower, and more the corresponding coefficient term is significant (Pennington et al., 2004). These figures show also the main effects of the five factors studied.
Raw Dibetou
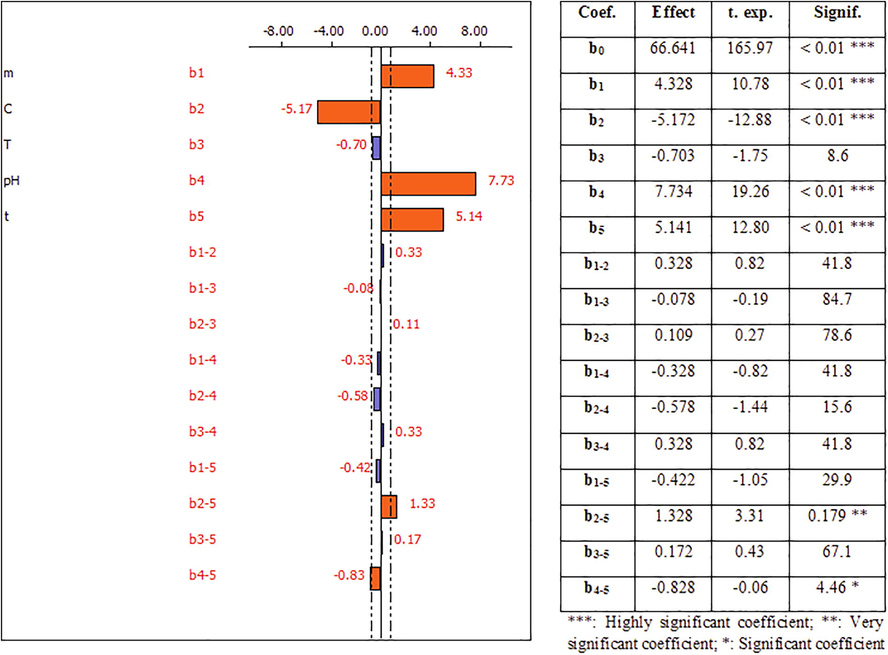
- Effect of the factors influencing the adsorption of Pb2+ ions onto raw Dibetou and their coefficients.
- Effect of the factors influencing the adsorption of Pb2+ ions onto activated Dibetou and their coefficients.
For raw Dibetou, the analysis of the results obtained (Fig. 9) leads to conclude that the constant b0, the coefficients b1 (mass of the adsorbent), b2 (metal concentration), b4 (pH) and b5 (contact time), as well as the interactions between the second and the fifth factors (b2-5) and the fourth and fifth factors (b4-5) are statistically significant, which then influence the adsorption process of Pb2+ ions since their significance risks are less than 5%.
Activated Dibetou
For activated Dibetou, the analysis of the results obtained (Fig. 10), shows that the constant b0, the coefficients b1 (sawdust mass), b2 (metal concentration), b4 (pH) and b5 (contact time), as well as the interactions between the second and the fourth factors (b2-4), the second and fifth factors (b2-5) and the fourth and fifth factors (b4-5) influence the adsorption process of Pb2+ ions (statistically significant) since the risk of significances are<5%.
3.3.1.2.2 Mathematical model
Based on the results of the estimation of the coefficients and the study of the interactions between the different factors governing the adsorption of Pb2+ ions on the different sawdust, the mathematical models representing the response Y as a function of the most influential factors are:
3.3.2 Response surface methodology: central composite design
To optimize the factors influencing the adsorption of Pb2+ ions, the selection of a response surface methodology has been designed in order to seek an optimal combination of the four main parameters (mass of adsorbent (m), metal concentration (C), pH of the solution (pH) and contact time (t)). Response surface methodology (RSM) was applied using a central composite design (CCD), which comprises a full factorial design with 16 tests, 8 axial points and 3 central tests. We performed a repetition for the axial and the full factorial tests, which giving 51 experiments.
Based on the previous effects, experimental domains of factors were constructed, which are presented in Table 3.
Designation
Notation
Low level (−1)
Central level (0)
High level (+1)
X1
m (g)
0.25
0.87
1.5
X2
C (mg.L−1)
50
275
500
X3
pH
1
3.5
6
X4
t (min)
5
47.5
90
3.3.2.1 Model validation and process optimization
The coefficients of determination R2 which are about 96% for raw Dibetou and 95% for activated Dibetou are proof for the validity of the model, because they give a good agreement between the experimental values and those predicted by the model. In addition, the main effect of the regression is significant since the probability of significance of the risk p is less than 0.05. The chosen model doesn’t show a lack of adjustment since the probability of risk significance is greater than 0.05. These results are consistent with those of the residues distribution, showing that the curves presenting the experimental values as a function of the predicted ones have a linear appearance, proving then the validity of the adapted model.
All coefficients have a significant influence on Pb2+ adsorption. Only b2-2, b1-2, b1-3, b1-4, b2-3 and b3-4 interaction effects in the case of Pb2+ adsorption onto raw Dibetou sawdust and b2-2, b1-2, b1-3 and b1-4 in the case of Pb2+ onto activated Dibetou sawdust showed to be statistically not significant. Based on these results, second-order polynomial equations for Pb2+ removal percentage is expressed as follows:
3.3.2.2 Profile of isoresponses
To achieve the maximum adsorption of Pb2+ ions onto raw and activated Dibetou sawdust, the RSM modeling was used.
The 2D graphs allow to illustrate the isoreponses curves that show the adsorption rate of Pb2+ ions onto raw Dibetou (Fig. 11-A1) and activated Dibetou (Fig. 11-B1), depending on the level of parameters. Moving towards areas of low concentration and high values of contact time, it is found that the adsorption rate of Pb2+ ions increases, while it decreases for the highest concentrations and the lowest contact times.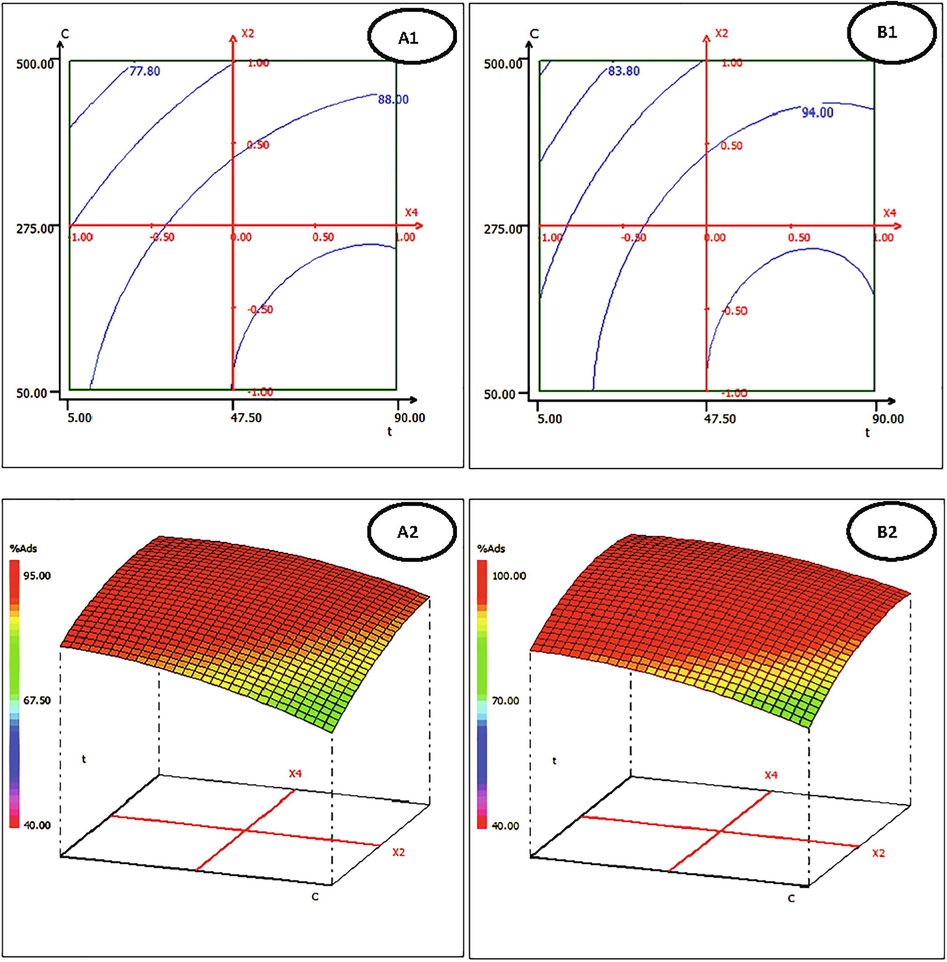
RSM (3D) and corresponding contour plot (2D) in the plane (C, t): (A1 and A2) Pb2+ adsorption onto raw Dibetou sawdust; (B1 and B2) Pb2+ adsorption onto activated Dibetou sawdust; (Fixed factors: m = 0.875 g and pH = 6).
The 3D graphical presentations (Fig. 11-A1 and B2) reveal response surfaces where the red color expresses the surface with higher adsorption rate of Pb2+ ions. It is found that the optimal conditions for reaching maximum adsorption rates are to work in the case of raw Dibetou at high levels (+1) of pH and contact time and at central levels (0) of adsorbent mass and metal concentration and in the case of activated Dibetou at high level (+1) of pH and at central levels (0) of adsorbent mass, contact time and metal concentration.
3.3.2.3 Experimental test
In order to finalize the experimental validity tests of the chosen model, we used the test point which allowed us to obtain a result that corresponds to the desired response (adsorption rate of Pb2+). The optimum values of different independent variables (mass of adsorbent (m), initial lead concentration (C), pH of the solution (pH) and contact time (t)) are determined as shown in Table 4.
Parameters
Real values
Code
Predicted response %
Experimental response %
Raw Dibetou
m (g)
0.875
0
95
94.12
C (mg.L−1)
275
0
pH
6
+1
t (min)
90
+1
Activated Dibetou
m (g)
0.875
0
100
98.94
C (mg.L−1)
275
0
pH
6
+1
t (min)
47.5
0
The results presented in Table 4 show that there are no significant differences between experimental and predicted responses, which confirm that the proposed model combined with RSM is an effective approach for modeling the adsorption process and to understand the relationships between the independent variables and response.
3.4 Kinetics of adsorption
In order to study the adsorption kinetics of Pb2+ onto raw and activated Dibetou sawdust, two models were used to verify the experimental results, namely the pseudo-first order model and that of the pseudo-second order.
The results obtained are shown in Figs. 12 and 13; the kinetic constants derived from these graphs are summarized in Table 5.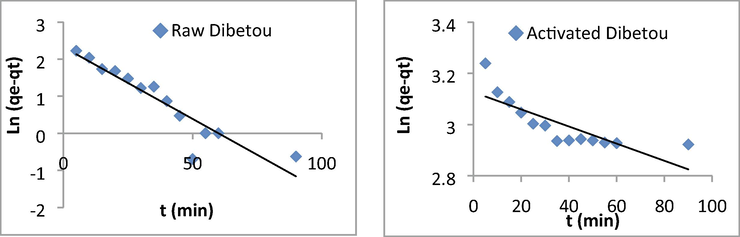
Curves illustrating the pseudo-first order kinetic model for Pb2+ adsorption on raw and chemically activated Dibetou sawdust.
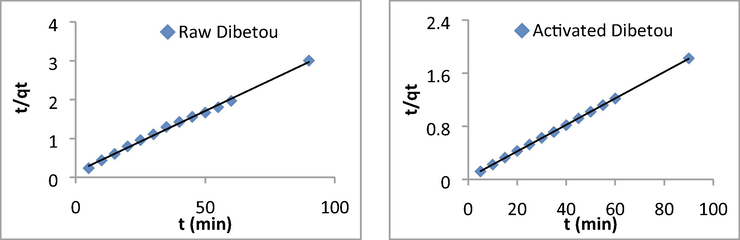
Curves illustrating the pseudo-second order kinetic model for Pb2+ adsorption on raw and chemically activated Dibetou sawdust.
1st order
2nd order
R2
K1 (min−1)
qe (mg.g1)
R2
K2 (g·mg−1min)
qe (mg.g1)
Raw Dibetou
0.8569
0.0388
10.26
0.9968
0.0074
31.75
Activated Dibetou
0.6489
0.0033
22.79
0.9999
0.0183
50.26
The mathematical equations of the pseudo-first order model of Pb2+ adsorption on raw (Eq. (13)) and activated (Eq. (14)) Dibetou sawdust and those of the pseudo-second order model of Pb2+ adsorption on raw (Eq. (15)) and activated (Eq. (16)) Dibetou sawdust are:
The linear regression results and the determination coefficients show that the adsorption data are well represented by the pseudo-second-order kinetic model. This can be explained by the high values of the determination coefficients (0.99 < R2 < 1) and the agreement between the experimental and the calculated maximum adsorption capacities (Table 5). This result has also been proved by Taty-Costodes et al. (2003) and by Arabkhani and Asfaram, (2020).
3.5 Adsorption isotherms
The study of the Pb2+ adsorption isotherm on raw and activated Dibetou sawdust was carried out under the optimal conditions mentioned previously by plotting the quantity adsorbed (qe) vs. the equilibrium metal concentration (Ce), for Pb2+ concentrations ranging from 10 to 500 mg.L−1. The graphics of Langmuir and Freundlich isotherms models are shown in Fig. 14.
According to the classification of the adsorption isotherms adopted by Giles et al. (1960), the adsorption isotherm of Pb2+ on both raw and activated sawdust is of type “L” which corresponds to the Langmuir isotherm (Fig. 14). This model assumes that the adsorption is monolayer and is done on homogeneous and specific sites. The adsorption capacity of Pb2+ ions on the activated sawdust is very important compared with that obtained with raw sawdust: they are 61.73 mg.g−1for activated Dibetou and 33.33 mg/g for raw Dibetou (Table 6). The same observation was reported by Ghaedi et al. (2015) and El Hajam et al. (2019c).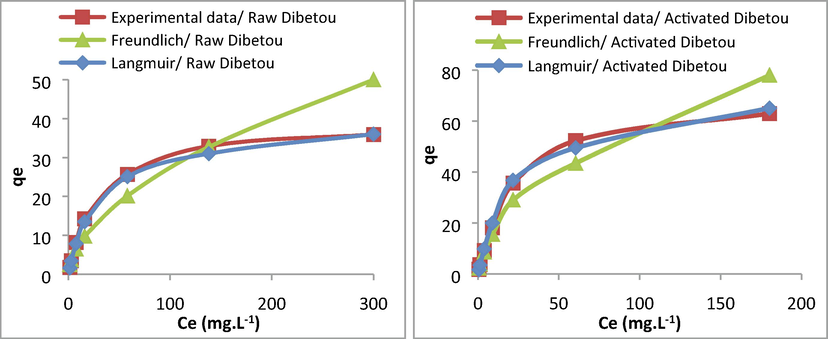
Modeling of the adsorption isotherms of Pb2+ ions on raw and activated Dibetou sawdust by Langmuir and Freundlich models.
Langmuir model
Freundlich model
R2
qmax (mg.g1)
b (L·mg−1)
R2
Kf
n
Raw Dibetou
0.9817
33.33
0.0196
0.9387
0.85
1.63
Activated Dibetou
0.9961
61.73
0.0864
0.9247
1.57
1.99
4 Conclusion
The adsorption experiments of Pb2+ ions on raw and chemically activated Dibetou sawdust were carried out in order to study their capacities to treat water loaded with Pb (II) and their abilities to retain these ions.
After characterizing raw and activated Dibetou sawdust, various parameters have been determined and optimized namely pH, temperature, initial metal concentration, mass of adsorbent and contact time in order to predict the optimal conditions for adsorbing Pb2+ ions on these sawdusts. Atomic absorption spectroscopy was used to quantify the residual concentration of Pb2+ ions in the synthetic aqueous solutions.
The results obtained lead to conclude that the adsorption process of Pb2+ ions on both raw and chemically treated sawdust was effective. We have also noticed that activated sawdust is more effective than raw sawdust.
The application of full factorial design allows to determine the main effects of different factors and their interactions on the adsorption phenomena. It shows that the temperature of medium has no effect on the adsorption process. The optimization using central composite design shows that the adsorption rates of Pb2+ ions on both sawdusts reached its maximum at pH of 6 using a mass of sawdust of about 0.875 g and a metallic ions concentration of 275 mg.L−1 during a contact time of about 90 min for raw Dibetou and 47.5 min for activated Dibetou.
The modeling of the adsorption isotherms of Pb2+ ions on both sawdusts follows well the Langmuir model (0.999 < R2 < 1). The maximum adsorbed quantities determined experimentally are close to those calculated by the model, with the adsorption capacities of about 61.73 mg.g−1 for activated Dibetou, and 33.33 mg.g−1 for raw Dibetou. The adsorption kinetics follows the pseudo-second order model with determination coefficients very close to the unity.
The results obtained are encouraging for the continuation of this work and therefore contribute to the depollution of water loaded with heavy metal cations.
Acknowledgments
We would like to thank the Erasmus program for the fellowship and the Regional University Center of Interface (CURI) for the characterization of the samples.
All authors equally contributed.
Funding
This work was supported by Researchers Supporting Project number RSP-2019/17, King Saud University, Riyadh, Saudi Arabia.
Declaration of Competing Interest
The authors declare that they have no known competing financial interests or personal relationships that could have appeared to influence the work reported in this paper.
References
- removal of Cu(II) and Pb(II) ions from aqueous solutions by adsorption on sawdust of Meranti wood. Desalination. 2009;247(1–3):636-646.
- [CrossRef] [Google Scholar]
- Role of sawdust in the removal of copper(II) from industrial wastes. Water Res.. 1998;32(10):3085-3091.
- [CrossRef] [Google Scholar]
- Binary metal sorption by pine bark: study of equilibria and mechanisms. Sep. Sci. Technol.. 2011;33(9):1303-1329.
- [CrossRef] [Google Scholar]
- Antioxidant defense system, immune response and erythron profile modulation in Gold fish, Carassius auratus, after acute manganese treatment. Fish Shellfish Immun.. 2018;76:101-109.
- [CrossRef] [Google Scholar]
- Microplastics in the marine environment: current trends in environmental pollution and mechanisms of toxicological profile. Sci. Total Environ.. 2019;68:61-74.
- [CrossRef] [Google Scholar]
- Factorial design analysis of adsorption of activated carbon on activated carbon incorporated with calcium alginate. Adv. Environ. Res.. 2002;6(2):191-198.
- [CrossRef] [Google Scholar]
- Development of a novel three-dimensional magnetic polymer aerogel as an efficient adsorbent for malachite green removal. J. Hazard. Mater.. 2020;384:121394
- [CrossRef] [Google Scholar]
- Heavy metal adsorption by modified oak sawdust: thermodynamics and kinetics. J. Hazard. Mater.. 2007;141(1):77-85.
- [CrossRef] [Google Scholar]
- Bouras, O., 2003. Thèse de doctorat. Ecole Doctorale Sciences Technologie et Santé, Faculté des Sciences et Techniques, Université de Limoge, p. 15.
- MicroRNAs and their role on fish oxidative stress during xenobiotic environmental exposures. Ecotoxicol. Environ. Saf.. 2018;148:995-1000.
- [CrossRef] [Google Scholar]
- Assessment of electrolytes and metals profile of the Faro Lake (Capo Peloro Lagoon, Sicily, Italy) and its impact on Mytilus galloprovincialis. Chem. Biodivers.. 2018;15(5):1800044.
- [CrossRef] [Google Scholar]
- Clay minerals and their beneficial effects upon human health. A review. Appl. Clay Sci.. 2002;21:155-163.
- [CrossRef] [Google Scholar]
- NeemAzal T/S – toxicity to early-life stages of common carp (Cyprinus carpio L.) Vet. Med-Czech.. 2015;60(1):23-30.
- [CrossRef] [Google Scholar]
- Evolution of water quality in the abandoned iron mines of Lorraine: towards a semi-distributed modelling approach. C. R. Geosci.. 2005;337(16):492-1499.
- [CrossRef] [Google Scholar]
- Cadmium and nickel: assessment of the physiological effects and heavy metal removal using a response surface approach by L. gibba. Ecol. Eng.. 2013;61:426-435.
- [CrossRef] [Google Scholar]
- The adsorption properties of Pb(II) and Cd(II) on functionalized graphene prepared by electrolysis method. J. Hazard. Mater.. 2010;183(1–3):923-930.
- [CrossRef] [Google Scholar]
- (c). Adsorption of Methylene Blue on industrial softwood waste “Cedar” and hardwood waste “Mahogany”: comparative study. Mater. Today-Proc.. 2019;13:812-821.
- [CrossRef] [Google Scholar]
- (a). Batch adsorption of Brilliant Green dye on raw Beech sawdust: equilibrium isotherms and kinetic studies. Mor. J. Chem.. 2019;7:431-435.
- [Google Scholar]
- (b). Physicochemical characterization of softwood waste “Cedar” and hardwood waste “Mahogany”: comparative study. Mater. Today-Proc.. 2019;13:803-811.
- [CrossRef] [Google Scholar]
- Evaluation of softwood and hardwood sawmill wastes impact on the common carp “Cyprinus carpio” and its aquatic environment: an oxidative stress study. Environ. Toxicol. Pharmacol.. 2020;75(2020):103327
- [CrossRef] [Google Scholar]
- Mussel digestive gland as a model for assessing xenobiotics: an overview. Sci. Total Environ.. 2018;613:220-229.
- [CrossRef] [Google Scholar]
- Bioaccumulation of heavy metals in blood and tissue of striped mullet in two Italian LAKES. J. Aquat. Anim. Health. 2014;26(4):278-284.
- [CrossRef] [Google Scholar]
- Effect of glyphosate on early life stages: comparison between Cyprinus carpio and Danio rerio. Environ. Sci. Pollut. Res.. 2018;25(9):8542-8854.
- [CrossRef] [Google Scholar]
- Review on metal removal from effluents by adsorption on sawdust and wood barks. Rev. Sci. Eau. 2000;13(3):323-347.
- [CrossRef] [Google Scholar]
- Recovery of heavy metal ions through decontamination of synthetic solutions and industrial effluents using modified barks. J. Geochem. Explor.. 1998;62(1–3):241-286.
- [CrossRef] [Google Scholar]
- Comparative studies on removal of Erythrosine using ZnS and AgOH nanoparticles loaded on activated carbon as adsorbents: Kinetic and isotherm studies of adsorption. Spectroc. Acta A. 2015;138:176-186.
- [CrossRef] [Google Scholar]
- Studies in adsorption. Part XI. A system of classification of solution adsorption isotherms, and its use in diagnosis of adsorption mechanisms and in measurement of specific surface areas of solids. J. Chem. Soc. Londo.. 1960;3973–3993
- [CrossRef] [Google Scholar]
- Bioaccumulation, cytotoxicity and oxidative stress of the acute exposure selenium in Oreochromis mossambicus. Ecotoxicol. Environ. Saf.. 2018;162:147-159.
- [CrossRef] [Google Scholar]
- Microplastic in marine organism: environmental and toxicological effects. Environ. Toxicol. Pharmacol.. 2018;64:164-171.
- [CrossRef] [Google Scholar]
- SiO2/graphene composite for highly selective adsorption of Pb(II) ion. J. Colloid Interface Sci.. 2012;369(1):381-387.
- [CrossRef] [Google Scholar]
- Toxic A to Z: A Guide to Everyday Pollution Hazards. Berkeley: University of California Press; 1991.
- Adsorption of nickel (II) from aqueous solution onto activated carbon prepared from almond husk. J. Hazard. Mater.. 2003;97(1–3):49-57.
- [CrossRef] [Google Scholar]
- The use of FT-IR microspectroscopic mapping to study the effects of enzymatic retting of flax (Linum usitatissimum L) stems. J. Sci. Food Agric.. 2002;82(7):685-696.
- [CrossRef] [Google Scholar]
- Removal of lead ions from aqueous solution using sphagnum moss peat as adsorbent. Water S.A.. 1996;22(3):219-224.
- [Google Scholar]
- Removal of copper (II) ions from aqueous solution by modified bagasse. J. Hazard. Mater.. 2009;164(1):1-9.
- [CrossRef] [Google Scholar]
- Bioaccumulation of heavy metals in marine organisms from the Romanian sector of the Black Sea. New Biotechnol.. 2015;32(3):369-378.
- [CrossRef] [Google Scholar]
- Biodegradability enhancement of purified terephthalic acid wastewater by coagulation–flocculation process as pretreatment. J. Hazard. Mater.. 2008;154(1–3):721-730.
- [CrossRef] [Google Scholar]
- Removal of mercury from aqueous solutions by adsorption to rice husks. Sep. Sci. Technol.. 1999;34(16):3139-3153.
- [CrossRef] [Google Scholar]
- Response Surfaces: Designs and Analyses (second ed.). New York: Marcel Dekker; 1996.
- Binding heavy metal ions with polymerized onion skin. J. Polym Sci. Polym. Chem.. 1981;19(2):397-402.
- [CrossRef] [Google Scholar]
- Sorption of cadmium and lead from aqueous solutions by spent grain. Process Biochem.. 2000;36:59-64.
- [CrossRef] [Google Scholar]
- Preparation and characterization of activated carbon from date pits by chemical activation with zinc chloride for methyl orange adsorption. J. Mater. Environ. Sci.. 2014;5(6):1758-1769.
- [Google Scholar]
- Alkaline pretreatment of Spruce and Birch to improve bioethanol and biogas production. BioResources. 2010;5(2):928-938.
- [Google Scholar]
- Adsorptive removal of heavy metals from aqueous solution by treated sawdust (Acacia arabica) J. Hazard. Mater.. 2008;150:604-611.
- [CrossRef] [Google Scholar]
- Removal of lead (II) ions from aqueous solutions by adsorption onto pine cone activated carbon. Desalination. 2011;276(1–3):53-59.
- [CrossRef] [Google Scholar]
- An analysis of structure and properties of a natural cellulosic fiber (Leafiran) Fiber Polym.. 2010;11(6):877-882.
- [CrossRef] [Google Scholar]
- Removal of lead from aqueous solution by Penicillium biomass. Biotechnol. Bioeng.. 1993;42(6):785-787.
- [CrossRef] [Google Scholar]
- The removal of heavy metals by using agricultural wastes. Water Sci. Technol.. 1993;28(2):247-255.
- [CrossRef] [Google Scholar]
- The influence of exposure of cadmium chloride and zinc chloride on haemolymph and digestive gland cells from Mytilus galloprovincialis. Int. J. Environ. Res.. 2017;11(2):207-216.
- [CrossRef] [Google Scholar]
- Life cycle assessment part 2, current impact practice. Environ. Int.. 2004;30(5):721-739.
- [CrossRef] [Google Scholar]
- Toxic metals in tissues of fishes from the Black Sea and associated human health risk exposure. Environ. Sci. Pollut. Res.. 2017;24(8):7776-7787.
- [CrossRef] [Google Scholar]
- The effects of subchronic exposure to NeemAzal T/S on zebrafish (Danio rerio) J. Chem. Ecol.. 2017;34(3):199-210.
- [CrossRef] [Google Scholar]
- Ecotoxicological effects of microplatics: Biomarkers of response, current state and future perspective. TrAC Trends Anal. Chem.. 2018;111:37-46.
- [CrossRef] [Google Scholar]
- Adsorption of copper (II), chromium (III), nickel (II) and lead (II) ions from aqueous solutions by meranti sawdust. J. Hazard. Mater.. 2009;170(2–3):969-977.
- [CrossRef] [Google Scholar]
- Kinetics of Pb(II) adsorption by polyacrylamide grafted sawdust. Ind. J. Chem. Technol.. 1997;4(3):157-162.
- [Google Scholar]
- Bioprocess preparation of wheat straw fibers and their characterization. Ind Crops Prod.. 2006;23(1):1-8.
- [CrossRef] [Google Scholar]
- Microplastics occurrence in the tyrrhenian waters and in the gastrointestinal tract of two congener species of Seabreams. Environ. Toxicol. Pharmacol.. 2019;67:35-41.
- [CrossRef] [Google Scholar]
- Fitness evaluation of ruditapes philippinarum exposed to Ni. Biol. Trace Elem. Res.. 2017;177(2):384-393.
- [CrossRef] [Google Scholar]
- Effects of waterborne antidepressants on non-target animals living in the aquatic environment: a review. Sci. Total Environ.. 2018;631–632:789-794.
- [CrossRef] [Google Scholar]
- Application of iron-rich natural clays in Camlica, Turkey for boron sorption from water and its determination by fluometric-azomethine-H method. J. Hazard. Mater.. 2007;146(1–2):180-185.
- [CrossRef] [Google Scholar]
- Comparative sorption of copper and nickel from aqueous solutions by natural neem (Azadirachta indica) sawdust and acid treated sawdust. Wood Sci. Technol.. 2007;41(5):427-442.
- [CrossRef] [Google Scholar]
- a). Acute exposure of neonicotinoid pesticide on common yabby (Cherax destructor. Sci. Total Environ.. 2019;665:718-723.
- [CrossRef] [Google Scholar]
- b). Effects of S-metolachlor and its degradation product metolachlor OA on marbled crayfish (Procambarus virginalis. Chemosphere. 2019;224:616-625.
- [CrossRef] [Google Scholar]
- Influence of urban activity in modifying water parameters, concentration and uptake of heavy metals in Typha latifolia L. into a river that crosses an industrial city. J. Environ. Health. Sci Engineer. 2015;13:5.
- [CrossRef] [Google Scholar]
- Micro (nano) plastics in freshwater ecosystems: abundance, toxicological impact and quantification methodology. TrAC Trends Anal. Chem.. 2018;110:116-128.
- [CrossRef] [Google Scholar]
- Sun flowers stalks as adsorbents for the removal of metal ions from wastewater. Ind. Eng. Chem. Res.. 1998;37(4):1324-1328.
- [CrossRef] [Google Scholar]
- Characteristics of degraded cellulose obtained from steam-exploded wheat straw. Carbohydr. Res.. 2005;340(1):97-106.
- [CrossRef] [Google Scholar]
- Removal of Cd(II) and Pb(II) ions, from aqueous solutions, by adsorption onto sawdust of Pinus sylvestris. J. Hazard. Mater.. 2003;105(1–3):121-142.
- [CrossRef] [Google Scholar]
- Liquid-liquid extraction: an adsorption isotherm at divided interface? C. R. Chim.. 2007;10(10–11):1034-1041.
- [CrossRef] [Google Scholar]
- Macroscopic and microscopic characterizations of a cellulosic ultrafiltration (UF) membrane fouled by a humic acid cake deposit: first step for intensification of reverse osmosis (RO) pre-treatments. C. R. Chim.. 2007;10(9):803-812.
- [CrossRef] [Google Scholar]
- Effect of CdCl2 on Regulatory Volume Decrease (RVD) in Mytilus galloprovincialis digestive cells. Toxicol. In Vitro. 2013;27(4):1260-1266.
- [CrossRef] [Google Scholar]
- Effect of long term exposure of silver nanoparticles on growth indices, hematological and biochemical parameters and gonad histology of male Gold fish (Carassius auratus gibelio) Microsc. Res. Technol.. 2019;82(7):1224-1230.
- [CrossRef] [Google Scholar]
- Histopathological lesions and toxicity in common carp (Cyprinus carpio L. 1758) induced by copper nanoparticles. Microsc. Res. Tech.. 2018;81(7):724-729.
- [CrossRef] [Google Scholar]
- Vignes, J.L., 1993. Données industrielles économiques géographiques sur des produits inorganiques et métaux. 5ème éd, Cachan: Centre de ressources pédagogiques en chimie-économie et industrie-EXC-1, Paris.
- Bioinspired zinc oxide nanoparticles using Lycopersicon esculentum for antimicrobial and anticancer applications. J. Clust. Sci. 2019 In press
- [CrossRef] [Google Scholar]
- Sub-Clinical Lead Poisoning. Academic Press; 1974.
- The removal of heavy metals from aqueous solutions by sawdust adsorption – removal of lead and comparison of its adsorption with copper. J. Hazard. Mater.. 2001;84(1):83-94.
- [CrossRef] [Google Scholar]
- Heavy metal pollution and assessment in the tidal flat sediments of Haizhou Bay. China. Mar. Pollut. Bull.. 2013;74(1):403-412.
- [CrossRef] [Google Scholar]


