

Translate this page into:
Optimization strategies for improved biogas production by recycling of waste through response surface methodology and artificial neural network: Sustainable energy perspective research
⁎Corresponding authors at. Department of Zoology, Annamalai University, Annamalainagar 608002, Tamil Nadu, India (M. Govindarajan); CO2 Research and Green Technologies Center, VIT University, Vellore 632014, Tamil Nadu, India (S. Vijayalakshmi). drgovind1979@gmail.com (Marimuthu Govindarajan), mushahid@ksu.edu.sa (Shahid Mahboob), vijimicro21@gmail.com (Vijayalakshmi Shankar)
-
Received: ,
Accepted: ,
This article was originally published by Elsevier and was migrated to Scientific Scholar after the change of Publisher.
Peer review under responsibility of King Saud University.
Abstract
Objective
The primary aim of the study is to augment the biogas production from flower waste through optimization and pretreatment techniques.
Methods
Enhancement of biogas production by using response surface methodology (RSM) and artificial neural network (ANN) was done. The time for agitation, the concentration of the substrate, temperature and pH were considered as model variables to develop the predictive models. Pretreatment of withered flowers was studied by using physical, chemical, hydrothermal and biological methods.
Results
The linear model terms of concentration of substrate, temperature, pH, and time for agitation had effects of interaction (p < 0.05) significantly. From the ANN model, the optimal parameters for the biogas production process increased when equaled to the model of RSM. It indicates that the artificial neural network model is predicting the yield of biogas efficiently and accurately than the RSM model. Chemical pre-treatments were found to enhance the biogas production from flower waste with higher biomethane kinetics and cumulative yield.
Conclusion
Biogas production was significantly improved with statistical optimization and pretreatment techniques.
Keywords
Flower waste
Biogas production
Response surface methodology
Artificial neural network
Pretreatments
Sustainable energy

1 Introduction
In recent times, about 85% of the world’s universal energy demands will be obtained from fossil fuels (Edenhofer et al., 2010), these are contributing to a lot of global warming and natural damages (Nigam and Singh, 2011; Rahman et al., 2011). Present approaches deliver the utilization of alternative energy, which is renewable, such as biomass, geothermal, solar and wind, to decrease the GHG. There is an immense possibility for the generation of biofuels from biomass (Naik et al., 2010).
Liquid biofuels or gaseous fuels that are chiefly made by using biomass will be classified as three generations (1st, 2nd and 3rd generations) (Dragone et al., 2010). From the edible portion of plants, such as seeds, grains and sugars, are considered to be first-generation fuels. From the non-edible parts of plants, such as Lignocellulosic substrates are termed as second-generation fuels, and fuels from microalgae are called as third-generation fuels (Behera et al., 2015). Production of 1st generation biofuels contains well-developed technologies and strategies with well-known pathways. Due to limitations of ecology and economic conditions, the biofuels from first-generation biofuels is provocative. The first restriction with first-generation fuels is its antagonism with the agriculture area for food crops (Schenk et al., 2008). Hence, lignocellulosic biomasses offer the possibility for biofuel production, which emerged as second-generation biofuels, because of its non-competitive with food crops for land utilization (Kleinert and Barth, 2008). Fuels from the second generation can be used for transportation and also can be compressed and utilized with the natural gas grid as an alternative fuel (Fernando et al., 2008). Lignocellulosic biomasses comprise of lignin (15–20%), hemicelluloses (25–35%) and cellulose (40–50). Though, the structural features and composition can be denatured by enzymatic degradation (Chang and Holtzapple, 2000; Monlau et al., 2013) and some pretreatment techniques are needed for biomass, which is hard to degrade (Taherzadeh and Karimi, 2008). Hence, pretreatment of the lignocellulosic substrate will be highly useful in the conversion of substrate into methane (Mood et al., 2013). The paper focuses on the statistical optimization of flower waste into biogas by using artificial neural network and response surface methodology and pretreatment.
2 Materials and methods
2.1 Effect of inoculum concentration
For experimental set-up 1 the digester was initially filled with cow dung and flower waste at 2:1 ratio, respectively. For experimental set up 2, the cow dung and flower waste were added to the digester at 1:1 ratio, respectively. For experimental set-up 3, the digester was filled with cow dung and flower waste at a 1:2 ratio, respectively.
2.2 Effect of substrate concentration
The influence of flower waste concentration was analyzed by grinding the flower waste into small size particles and introduced through the inlet pipe of the digester at varying concentrations. Five varying proportions (5%, 7.5%, 9%, 10% and 12.5%) were chosen for the flower waste to be introduced in the reactor. Continuous checking of pressure, temperature and pH was done every 24 h to a period of 14 days for acclimatization of inoculum.
2.3 Response surface methodology design
Parameters affecting biogas production were designed experimentally by using RSM (Arslan Alaton et al., 2010). The relationship between independent variables and biogas production was evaluated in response surface methodology (Güven et al., 2008). The best model for numerical experiments is central composite design. Four essential factors, such as substrate concentration, temperature, pH, and agitation, were taken. Table 1 describes the independent variables of coded and actual values (Myers et al., 2009). For the above mentioned four factors, a total of 30 experiments (Table. 2) were designed (Montgomery and Wiley, 2001).
Factors
Name
Variables range
−2
−1
0
+1
+2
A
Temperature (°C)
35
40
45
50
55
B
pH
6.6
6.9
7.2
7.5
7.8
C
Substrate Concentration (kg)
80
90
100
110
120
D
Agitation Time (s)
1
3
5
7
9
Std
Run
Temperature
Acid Production
Substrate Concentration
Agitation Time
Biogas Yield
deg C
pH
kg
sec
%
20
1
45
7.2
80
5
710
6
2
45
6.8
100
5
678
21
3
45
7.2
100
5
747
15
4
40
7.4
90
3
615
8
5
50
7
110
3
674
19
6
50
7.4
90
3
666
28
7
45
7.2
100
5
748
11
8
45
7.2
100
5
744
22
9
40
7.4
110
3
613
26
10
45
7.2
100
5
742
9
11
35
7.2
100
5
444
14
12
40
7
90
3
624
1
13
50
7.4
110
7
727
5
14
45
7.2
100
5
746
4
15
40
7
90
7
594
25
16
45
7.6
100
5
706
12
17
45
7.2
120
5
713
30
18
45
7.2
100
5
747
27
19
55
7.2
100
5
602
23
20
50
7
110
7
710
7
21
50
7
90
7
688
29
22
40
7.4
90
7
614
10
23
50
7.4
90
7
714
13
24
45
7.2
100
9
727
17
25
45
7.2
100
1
710
2
26
50
7.4
110
3
694
16
27
40
7
110
7
587
18
28
50
7
90
3
668
3
29
40
7
110
3
602
24
30
40
7.4
110
7
595
2.4 Design of artificial neural network
According to biological neurons, artificial network architectures have been formed in recent years. It has an extensive range of usages in various areas, especially in artificial intelligence.
2.4.1 Back propagation neural network
These methods usually consist of an output layer, some hidden layers and an input layer (Fig. 1). The information flows in a forward and backward direction, which enables the artificial neural network a dynamic memory (Bashir, 2010). Neurons will generate the output layer according to the given input layer (Balaji et al., 1987). The first layer consists of the input layer, the second consists of the layer, which is hidden and the third layer is for the output. Four inputs had been chosen, such as agitation time (AT), substrate concentration (SC), pH, and temperature (T). One hundred twenty inputs had been formed, and 30 days were taken for every parameter.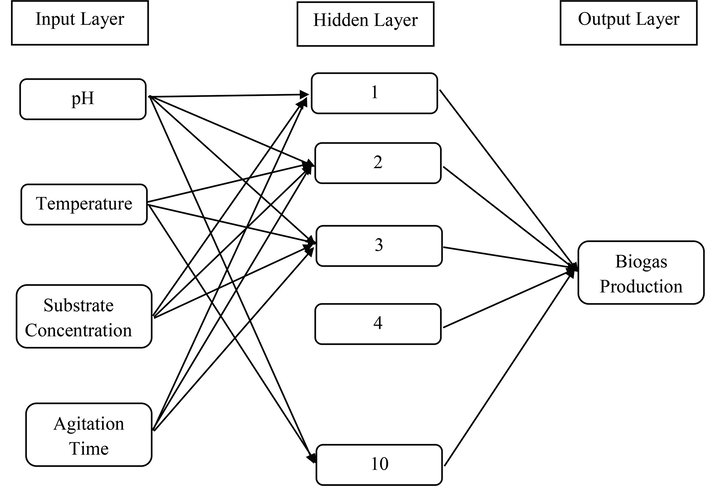
Architecture of neural network.
2.5 Pretreatment of substrate
The substrate was pretreated with various methods such as physical, chemical, hydrothermal and biological methods (Bondesson et al., 2013).
2.5.1 Physical pretreatment
-
Milling pretreatment was done to reduce the size to increase an higher amount of surface area which will fasten the decomposition process. The grinding procedure was conveyed out by using mixers.
-
Microwave pretreatment was done by keeping the flower waste in a glass beakers (250 ml) and kept in microwave at 560 W, until bubbling of the fluid stage. The samples are left hot intended for about 30 s. The execution of pretreatment was done in a traditional microwave stove (Sharp conservative R230A, 50 Hz).
-
Ultrasonic pretreatment was done in Vibra Cell ultrasonic processor with a working recurrence of 20 kHz and power yield 130 W. Ultrasonication was processed for 30 m.
-
A kinetic study was performed by Modified Gompertz model as well as a logistic model to determine the biogas production parameters where ‘C’ is cumulative biogas generation (ml), ‘production of biogas (ml), ‘Rb’ represents biogas generation level (ml/day), ‘l represents lag phase period for times as well as ‘exist exp (1) ¼ 2. 7183.
2.5.2 Chemical pretreatment
-
NMMO pretreatment of flower waste was done by treating the substrate with N-methyl morpholine-N-oxide. Pretreatment was achieved by using the NMMO solution, which is prepared at 85% (w/w) in a rotating evaporator, was added with 7. 5 gm of flower waste was kept for 3 hrs at 120 °C and propyl gallate was added for oxidation. Reaction was prevented by adding deionized hot water (Mancini et al., 2016).
-
Solvent pretreatment was done by adding flower waste (15 gm) with 150 ml of ethanol and kept the containers for 60 min in a convection oven (TCF 50 PRO), at 180 °C and then transferred to ice bath for cooling. After pretreatment the substrate was rinsed with deionized water until it reaches pH 7. 0.
-
Acidic pretreatment was carried out by mixing flower waste (1 kg) with 0. 1 N H2SO4 at different percentages such as 1%, 2%, 3 and kept in incubation for half an hour to enable the breakdown of lignocellulose and was washed thoroughly with water.
-
Alkaline pretreatment thoroughly mixed with the flower waste at different percentages 1%, 2% and 3% of NaOH (0.1 N) and kept incubation for half an hour then the substrate was washed thoroughly with water.
2.5.3 Hydrothermal and digestion tests
Autoclave made up of stainless steel was used for the hydrothermal treatment of flower waste. The flower waste (400 g) and deionized water (80 g) was subjected to hydrothermal treatment in a reactor. Continuous stirring was done to prevent the temperature gradient in the reactor; after the reaction, the liquid phase was separated and stored in the fridge at 4℃. The temperature and time for hydrothermal treatment were ranging from 80℃ to 180℃ and 0, 30, and 60 min, respectively. The rate of heating ranges from 2.5 to 3℃/min with a time of heating about 3080 min and the cooling time was around 40–70 min. The slurry pH was adjusted to 6.8 to 7.2 and the residual air was removed by purging the nitrogen. Control was maintained with an untreated flower waste sample.
2.5.4 Biological pretreatment
For pretreatment with biological methods, the solid-state fermentation was followed by using Aspergillus fumigatus SL1. The samples with and without fungal suspension were tested for biochemical methane potential tests. After pretreatment, filtering of the sample was done and the portion of solid content was separated.
3 Results and discussion
3.1 Effect of inoculum concentration
Moisture content was measured for all three experimental setup. The moisture content ranges from 70 to 80% for all three sets of experiments. Set 3 on day 3 shows the higher moisture content of 76.5%. On day 1, irrespective of experimental sets shows lesser moisture content varies from 71 to 72%. Temperature plays a significant role in the production of biogas (Gou et al., 2014). The pH plays a vital role in biogas production with a range from 6.5 to 8 (Kalloum et al., 2005), with an optimal beach of 6.8 in 7.4 (Raposo et al., 2006). The variation of inoculum with flower waste in varied proportions, i.e. 2:1, 1:1, 1:2, were analyzed and showed that 1:2 is found to be the most effective composition (Kalloum et al., 2007). The flower waste for anaerobic digestion process was considered in a ground and ungrounded state in order to achieve the results from both, to compare and choose the best result. To initiate the process of anaerobic decomposition of flower waste (feedstock) and cow dung was used as an inoculum. The amount of cow dung to water proportion was taken as 1:1 ratio. pH, temperature, moisture content, and pressure were monitored continuously. Microorganisms break down in length chain carbohydrates, lipids and proteins, into small chains. Polysaccharides will be converted into monosaccharides and proteins into amino acids. The biogas produced under a controlled parameter of pH 5.5, temperature 28 °C was monitored with no pressure in the beginning to 0.07 kg/cm2 at the end of 15 days. Knowing the pressure of inoculums the digester was introduced with flower waste. The proportion of cow dung with water and the flower waste was varied from 2:1, 1:1 and 1:2. These microscopic organisms need aid anaerobic. Also, camwood develops under acidic states. To prepare acidic acid, they compelling reason oxygen furthermore carbon. The proportion of cow dung with water and the flower waste was varied from 2:1, 1:1, and 1:2. The pH, temperature, moisture content, and the pressure were monitored, and the maximum pressure was recorded. Hence this proportion of the inoculums was considered for carrying out the optimization process. The results of ungrounded flowers were not obtained as the process of decomposition is delayed.
3.2 Effect of substrate concentration
Influence of substrate concentration was studied at different flower waste concentration such as 5%, 7.5%, 9%, 10% and 12.5%. Maximum biogas production was seen in 8th day. The graph shows that 7% substrate is more efficient in biogas production. The grounded flower waste was sent to the pipe placed inside to the digester. Five different compositions of flower waste such as 5%, 7.5%, 9%, 10% and 12.5% were tested for the anaerobic digestion. Continuous checking of pressure, temperature and pH was done for every 24 hrs up to 14 days. Results indicated the pH varies from 4.8 to 6.4 in the temperature range of 27–28 °C. The pressure for different composition of flower waste ranging from 5% to 12.5% was found to be 0 to 0.51 kg/sq.cm. The microbial activity was found higher at 5.2 pH for 9% flower waste. It shows the temperature of 27 °C aiding in the efficient working of microorganisms.
3.3 Statistical optimization
Around 30 runs was designed based on response surface models. The F-value of the model is 220.57 and the probability value (Pr > F < 0.0012) is meager, which indicates that for biogas production, the model was significant (Wang et al., 2015). By identifying the difference between the responses from maximum and minimum predictive variables, the signal to noise ratio will be calculated. Usually, a ratio of more than 4 is necessary (Jiménez et al., 2014). The linear model terms of A (temperature), B (pH), C (substrate concentration) and D (agitation time) were significant (P < 0.05). Two variables, such as pH and concentration of substrate, have a distinct effect on the production of biogas. For all the four factors, the interactive effect was identified to be insignificant (P > 0.05). In a polynomial equation, the correlation coefficient (R2) was calculated as 0.9951 for the production of biogas, which indicates the variability of the observed response values. The polynomial equation for the second-order was framed to signify the final regression model of biogas production (Table 3).
Source
Sum of Square
Degree of Freedom
Mean Square
F-Value
P Value
Remarks
Model
140650.4
14
10046.46
129.1779
5.06E-13
Significant
A-A
28567.52
1
28567.52
367.3229
5.84E-12
B-B
624.0375
1
624.0375
8.023912
0.012601
C–C
690.2042
1
690.2042
8.874687
0.009364
D-D
2781.204
1
2781.204
35.76089
2.52E-05
AB
60.0625
1
60.0625
0.772287
0.393371
AC
885.0625
1
885.0625
11.38019
0.004179
AD
2525.063
1
2525.063
32.46741
4.22E-05
BC
27.5625
1
27.5625
0.3544
0.560508
BD
162.5625
1
162.5625
2.090239
0.168812
CD
0.0625
1
0.0625
0.000804
0.977758
A2
91311.07
1
91311.07
1174.083
1.16E-15
B2
6545.503
1
6545.503
84.16248
1.53E-07
C2
3066.146
1
3066.146
39.42469
1.48E-05
D2
2135.146
1
2135.146
27.45384
9.99E-05
Residual
1166.583
15
77.77222
Lack of Fit
1141.25
10
114.125
22.52467
0.001532
significant
Pure Error
25.33333
5
5.066667
Cor Total
141,817
29
Biogas = 730.1771 – 73.1875A + 8.0625B + 8.479167C + 17.02083D + 1.9375AB + 7.4375 AC + 12.5625 CE + 1.3125 BCE + 3.1875 BD − 0.0625CD − 57.6979 A2 −15.4479 B2 −10.5729 C2 −8.82292 D2
In a polynomial equation, the correlation coefficient (R2) was calculated as 0.9951 for biogas production. According to the present study, the correlation coefficient value for optimum biogas production is higher than R2 value (0.9806), which indicates the more considerable agreement between observed and calculated values. The mean values and standard deviation of the model were found to be 0.4543 and 0.141, respectively. The three-dimensional surface plots were created by keeping the intermediate level for one variable and varying the experimental range for other variables. By plotting the 3-dimensional surface curves, the interactive effects for biogas yield were studied. Based on the results, we found that dependency for the production of biogas was increased with an increase in temperature up to 45 °C and the yield of biogas was ceased with a further increase in temperature (Hosseini et al., 2012).
A 3-dimensional response surface plots have been designed by keeping a variable at center and range of experiments differed with other variables. The effect of interaction for the production of biogas was analyzed from the three-dimensional surface curve plot. The variable interaction and the calculated response were plotted and the three-dimension surface curves were shown in Figs. 2–4. The biogas production and temperature increase up to 50 °C was found to be directly proportional after 50 °C the yield for biogas was found to be decreased with an increase in temperature. The optimum pH was found to be 7.2, after which the production found to be decreased. Since the microbes involve in biogas production are highly sensitive and it requires a specific range of temperature and pH for its growth and production. Following the result, a previous study showed the optimum range of pH between 6.3 and 7.8 (Wu et al., 2017). A similar trend of biogas production trend was found within the range. For the concentration of substrate, 100 kg was found to increase the biogas production after which it seems to reduce and the time for agitation is optimum in 5, after which production found to be reduced. For maximal biogas production, the optimum condition was found to be 50 °C temperature, 7.2 pH, 100 kg substrate concentration, 5 s agitation time.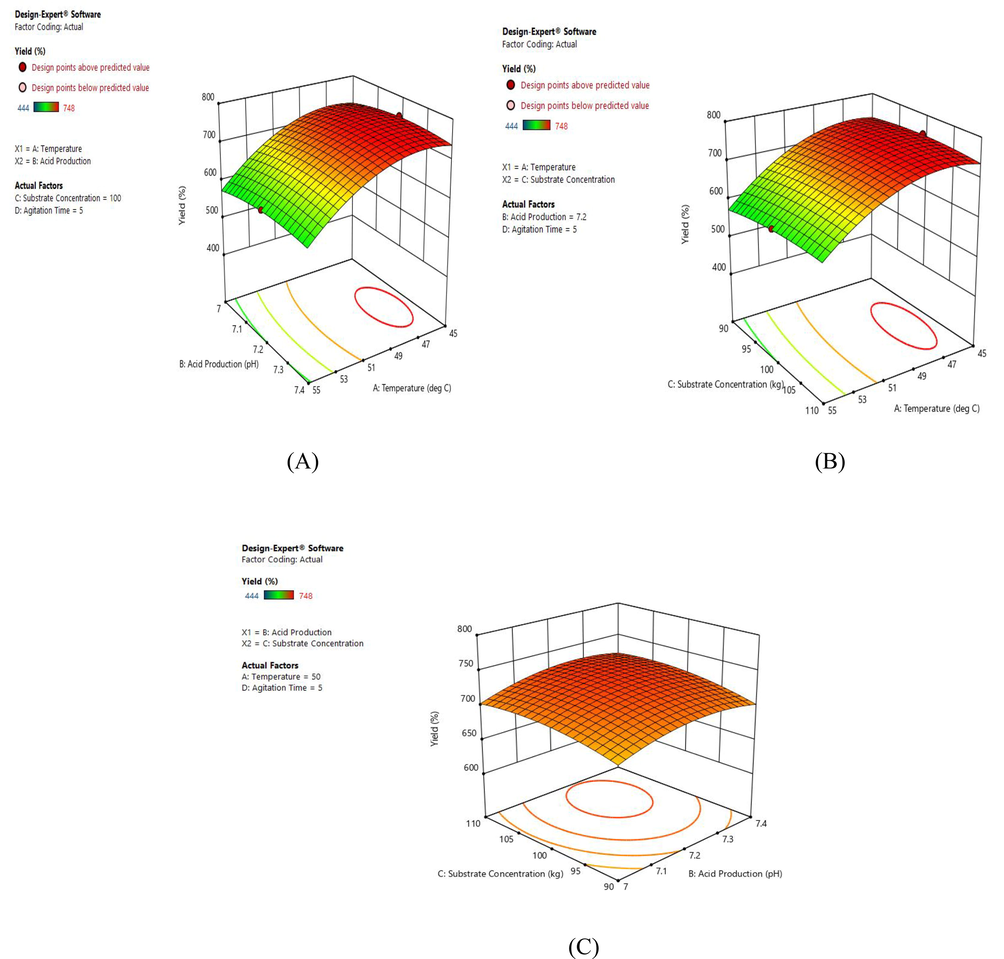
Interaction between the variables (A) pH and temperature interaction; (B) Substrate and temperature interaction; (C) Substrate and pH temperature interaction.
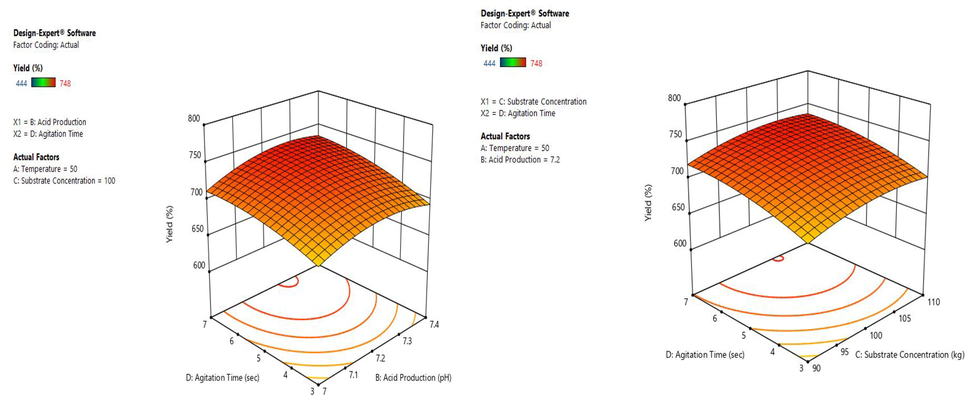
Interaction between the variables (A) pH and agitation time interaction; (B) Agitation and substrate concentration interaction.
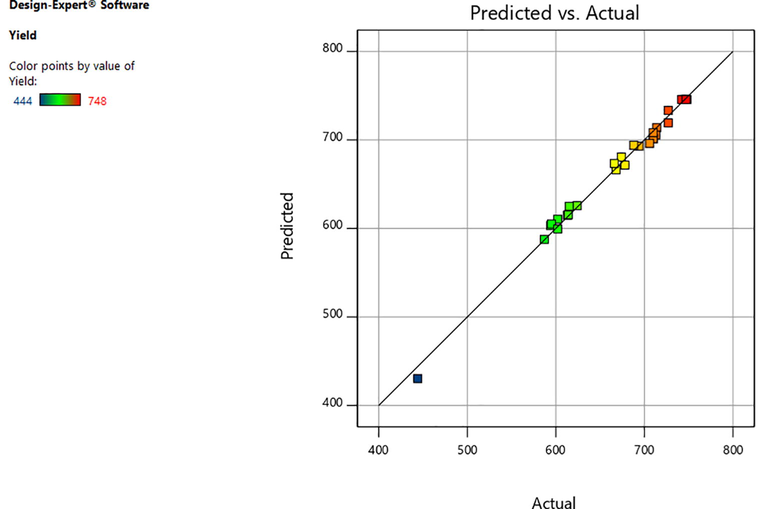
Correlation between predicted and actual values.
3.4 Conditions for optimum response and model validation
The efficient tools in simulating and controlling biogas production are artificial neural network and response surface methodology. In order to understand the interactive effects of biogas production with various parameters and to ensure the quality of the experiments, an artificial neural network is applied. MAE (%) and R2 factors of the model was used for the comparison. The absolute mean errors for response surface methodology and artificial neural network were identified as 1.98% and 1.01%, respectively. The higher R2 value indicates that the model can be used for better estimation for the yield of biogas, which is in correlation with the previous study (Liew, 2012). The targets and the output is better correlated, which was reflected by the higher R2 value. The values of an artificial neural network were the best fit with experimental values. The RSM and ANN R2 value was found to be 0.9951 and 0.999, respectively. According to the higher R2 value, it can be concluded that the model can be better used to predict the yield of biogas and best-fitted data indicate the usefulness of the model in predicting the biogas yield. The methane yield with the optimization was found to be 568 ml CH4/g Vs). The artificial neural network model is highly capable of predicting the yield of biogas.
3.5 Effect of physical pretreatment on biogas production
The displacement of the water method measured biogas production daily and the biogas generation was categorized as phase I known as a lag phase for about 3 days, phase II known as peak phase for about 15 days, phase III known as sub-peak phase for about 20 days and phase IV known as fade phase after 21st day. Throughout that lag phase, the production of biogas was less due to the entrapment of oxygen within the digester. Higher gas yield (906 ml) was achieved with a maximum concentration of methane (532 ml) in ultrasonic pretreated flower waste on day ten, followed by substrate pretreated with milling with 847 ml of biogas (493 ml of methane content) on day nine and 723 ml of biogas (387 ml for methane content) for the microwaved substrate on day ten.
To determine the cumulative biogas in the reactors, logistic and Gompertz model (modified) was used. With the modified Gompertz model, a higher Rb (biogas synthesis rate) for the untreated substrate was found to be 709.4 ml/day. In milling, ultrasonic, and microwave treatments, the Rb was identified as 769.5, 819.1, and 745.2 ml/day, respectively. The Rb with a logistic model for untreated, milling, ultrasonic, and microwave was found to be 718.2, 785.0, 839.1, and 758.1 ml/day, respectively.
The Rb value indicates that ultrasonic treatment improves the biogas synthesis rate and also shorten the lag phase. Connection coefficients acquired to the logistic model and Gompertz models were 99.84% and 99.94%, respectively. It concludes that the Gompertz model modified was found to be the best fit model.
3.6 Effect of chemical pretreatment
With NMMO pretreatment, there was no significant impact on the original composition of flower waste. In agreement with previous research with NMMO pretreatment on grain (Mancini et al., 2016), there was less impact on carbohydrates content (i.e. under 0.5%) on flower waste (Kabir et al., 2015). The presence of lignin is not favorable for the digestion process (McDonough, 1992).
Solvent pretreatment showed significant effect on flower waste. After pretreatment, lignin content was reduced to 12%. Moreover, the hemicelluloses part was significantly affected by pretreatment with solvent with a 48% reduction. Also, the compositional investigation demonstrated that the pretreatment with solvent resulted in comparable enhancement of cellulose content (15%) of flower waste. The structural transforms caused by pretreatment with solvent will be attributed by linkages between ether to ester between lignin and hemicellulose (Gopalan et al., 2013).
The composition of flower waste was affected majorly by alkaline pretreatment. Hemicellulose content of flower waste was reduced to 31% after pretreatment. The flower waste composition was analyzed after alkali pretreatment and found that cellulose content was improved by about 13%.
The pretreatments with the chemical method were found to be effective in improving the biogas yield from flower waste. The untreated flower waste shows a biomethane yield of 266 (±3) ml, while NMMO treated sample shows a cumulative biomethane yield of 301 (±3) ml. and with solvent, alkaline, and acidic pretreatment found to yield biomethane of about 317 (±1), 328 (±2) and 321 (±1) ml, respectively.
The specific rate constants (k0) were obtained by using a classical 1st order model, while biogas production rate (Rm) was obtained by using the modified Gompertz model. The kinetic constant of flower waste was found to be 0.011 throughout the first 10 days of anaerobic digestion. The consistent k0 was enhanced to 79 (NMMO), 60 (solvent), 62 (acidic) and 148% (alkaline), with a higher Rm of 48, 51 and 115%. After 10 days of digestion, the untreated flower waste showed 172 mLCH4/g VS, with 92% of methane production. An appropriate fit was seen between predicted and experimental data for the determination of coefficient (r2) more than 0. 99.
3.7 Hydrothermal pretreatment
The maximum methane concentration of 65 vol% was found with hydrothermal pretreatment for 30 min at 90 ℃. With 160 ℃ of the hydrothermally pretreated sample, the methane and biogas yield was lesser time from 0 to 60 min. Protein denaturation could occur at 80℃ will leads to depletion of organic matters, which results in the Maillard reaction at 160℃. With higher the temperature for hydrothermal pretreatment, the more will be the Maillard reaction. The biogas and methane concentration was found to be minimum with pretreatment at 180 °C and maximum was found at 90 °C with 434 ml/g VS of biogas and 285 ml/g VS of methane concentration (Fig. 5).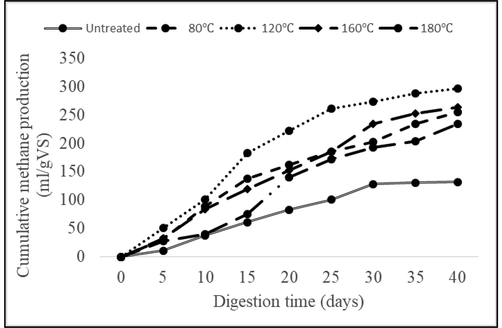
Cumulative methane yield by hydrothermally pre-treated substrate at different temperatures.
3.8 Biological pretreatment
Aspergillus, a filamentous fungus, is highly potential in producing the enzymes which break the cell wall of the plant, which will help in degrading the organic matter, especially the cellulose content. The fungus was grown in solid-state fermentation (SSF) typically utilized for enzyme production (Liu et al., 2006) as a pretreatment step for biogas generation from flower waste.
A notable enhancement (p < 0. 05) in the biomethane process was seen with fermentation after 10 days (148 ± 2 mLCH4 g−1VS). Methanogenic bacteria did not well process that flower waste and it was quickly metabolized by fungus for biological pretreatment (Dubigeon et al., 1997). Similarly, SSF was performed in Japan with Aspergillus sp found to have a higher biomethane potential of about 77. 6 mLCH4 g−1VS (Otsuka and Yoshino, 2004). The solid-state fermentation is more beneficial as it reduced the need for costly nutrient medium, less risk of contamination, the stability of the product will be higher, higher volumetric production.
4 Conclusion
The biogas production response value is very near to experimental value. The RSM and ANN R2 value was found to be 0.9951 and 0.999, respectively. Both models can be better used for the biogas yield prediction. The ANN prediction is highly efficient when compared to RSM. The removal of chemical oxygen demand, volatile solids, total solids and biogas generation were found to be higher with physical pretreatment. Kinetic factors were determined by using logistic and Gompertz model modified. Chemical pre-treatments were found to enhance the biogas production from flower waste with higher biomethane kinetics and cumulative yield. The surface area accession was studied with water retention value and volatile fatty acid production was analyzed and validated. Hydrothermal pretreatment of flower waste was also tested at different temperatures such as 80, 120, 160 and 180 °C, and found to have higher yield with 120 °C. The solid-state fermentation was found to be a beneficial pretreatment method for enhancing the production of biogas.
Acknowledgments
The authors extend their appreciation to the Deputyship for Research & Innovation, “Ministry of Educations” in Saudi Arabia for funding this research work through the project number IFKSURG-1435-012.
Declaration of competing interest
The authors declare that they have no known competing financial interests or personal relationships that could have appeared to influence the work reported in this paper.
References
- Development of experimental design models of commercially important naphthalene sulfonate and its organic carbon content. Chem. Eng. J.. 2010;165:597-606.
- [Google Scholar]
- Application of response surface methodology (RSM) for optimization of ammonia cal nitrogen removal from semi-aerobic landfill leachate using ion exchange resin. Desalination. 2010;254:154-161.
- [Google Scholar]
- Batch ethanol production from cassava (Manihot esculenta Crantz.) flour using Saccharomyces cerevisiae cells immobilized in calcium alginate. Ann. Microbiol.. 2015;65:779-783.
- [Google Scholar]
- Ethanol and biogas production after steam pretreatment of corn stover with or without the addition of sulphuric acid. Biotechnol. Biofuel.. 2013;6:6-11.
- [Google Scholar]
- Fundamental factors affecting biomass enzymatic reactivity. Appl. Biochem. Biotechnol.. 2000;5:84-86.
- [Google Scholar]
- Third generation biofuels from microalgae. Madrid: Formatex; 2010. p. :1315-1366.
- Factors limiting the biodegradation of Ulva sp cell wall polysaccharides. J. Sci. Food Agric.. 1997;75:341-351.
- [Google Scholar]
- The economics of low stabilization: model comparison of mitigation strategies and costs. Ener. J.. 2010;31:11-48.
- [Google Scholar]
- Biorefineries: current status, challenges, and future direction. Ener. Fuel.. 2008;20:1727-1737.
- [Google Scholar]
- Biochemical methane potential of beef feedlot manure: impact of manure age and storage. J. Environ. Qual.. 2013;42:1205-1212.
- [Google Scholar]
- Effects of temperature and organic loading rate on the performance and microbial community of anaerobic co-digestion of waste activated sludge and food waste. Chemosphere. 2014;105:146-151.
- [Google Scholar]
- Electrochemical treatment of deproteinated whey wastewater and optimization of treatment conditions with response surface methodology. J. Hazard. Mater.. 2008;157:69-78.
- [Google Scholar]
- Enhancement of rice straw biodegradability by alkaline and acid thermochemical pretreatment process: optimization by response surface methodology (RSM) Casp. J. Appl. Sci. Res.. 2012;1:8-24.
- [Google Scholar]
- Methanogenic activity optimization using the response surface methodology, during the anaerobic co-digestion of agriculture and industrial wastes. Microbial community diversity. Biomas. Bioener.. 2014;71:84-97.
- [Google Scholar]
- Experimental and economical evaluation of bioconversion of forest residues to biogas using organosolv pretreatment. Bioresour. Technol.. 2015;178:201-208.
- [Google Scholar]
- Winery and distillery wastewater treatment by anaerobic digestion. Wat. Sci. Technol.. 2005;51:137-144.
- [Google Scholar]
- Etude de l’influence du pH sur la production du biogaz à partir des déchets ménagers. Revue. Des. Energies. Renouvelables.. 2007;10:539-543.
- [Google Scholar]
- Towards a Lignincellulosic Biorefinery: Direct One-Step Conversion of Lignin to Hydrogen-Enriched Biofuel. Ener. Fuel.. 2008;22:1371-1379.
- [Google Scholar]
- Methane production from solid-state anaerobic digestion of lignocellulosic biomass. Biom. Bioen. 2012;46:125-132.
- [Google Scholar]
- Assessing global vegetation-climate feedbacks from the observation. J. Clim.. 2006;19:787-814.
- [Google Scholar]
- Solvent pretreatments of lignocellulosic materials to enhance biogas production: a review. Ener. Fuel.. 2016;30:1892-1903.
- [Google Scholar]
- Specificity of unsaturated fatty acid-regulated expression of the Saccharomyces cerevisiae OLE1 gene. J. Biol. Chem.. 1992;267:5931-5936.
- [Google Scholar]
- Lignocellulosic materials into biohydrogen and biomethane: impact of structural features and pretreatment. Crit. Rev. Env. Sci. Technol.. 2013;43:260-322.
- [Google Scholar]
- Design Analysis of Engineering Experiments. New York: John Wiley & Sons; 2001.
- Ligno-cellulosic biomass to bioethanol, a comprehensive review with a focus on pre-treatment. Renew. Sustain. Ener. Rev.. 2013;27:77-93.
- [Google Scholar]
- Response Surface Methodology: Process and Product Optimization Using Designed Experiments (third ed.). Hoboken:: Wiley; 2009.
- Production of first and second generation biofuels: a comprehensive review. Renew. Sust. Ener. Rev.. 2010;14:578-597.
- [Google Scholar]
- Production of liquid biofuels from renewable resources. Prog. Ener. Combus. Sci.. 2011;37:52-68.
- [Google Scholar]
- Otsuka, K., Yoshino, A. 2004. A fundamental study on anaerobic digestion of sea lettuce, In: Oceans 04 Mts/Ieee Techno-Ocean, 04, 1–2. Conf. Proceed, 1770–1773.
- Environmental impact of wind energy. Renew. Sustain. Ener. Rev.. 2011;15:2423-2430.
- [Google Scholar]
- Influence of inoculum to substrate ratio on the biochemical methane potential of maize in batch tests process. Biochem.. 2006;41:1444-1450.
- [Google Scholar]
- Second generation biofuels: high-efficiency microalgae for biodiesel production. Bioenerg. Res.. 2008;1:20-43.
- [Google Scholar]
- Pretreatment of lignocellulosic wastes to improve ethanol and biogas production: a review. Int. J. Mol. Sci.. 2008;9:1621-1651.
- [Google Scholar]
- Optimizing feeding composition and carbon–nitrogen ratios for improved methane yield during anaerobic co-digestion of dairy, chicken manure and wheat straw. Bioresour. Technol. 2015;120:78-83.
- [Google Scholar]
- Real-time performance of a self powered environmental IoT sensor network system. Sensors. 2017;17:1-14.
- [Google Scholar]


