

Translate this page into:
Optimization of tensile properties of epoxy aluminum particulate composites using regression models
⁎Corresponding author at: Department of Materials Science and Engineering, Kwara State University, Malete, Nigeria. sefiu.bello@kwasu.edu.ng (Sefiu Adekunle Bello)
-
Received: ,
Accepted: ,
This article was originally published by Elsevier and was migrated to Scientific Scholar after the change of Publisher.
Peer review under responsibility of King Saud University.
Abstract
Aluminum particles (sourced from aluminum can wastes) were incorporated into diglycidyl ether of bisphenol A (DGEBA) cured with 1,3-diethanamine benzene hardener. Phases occupying the infusible cross linked-developed epoxy composite structures were identified and their spatial arrangements were also examined. The mechanical property tests conducted on the developed epoxy composites include tensile, flexural, impact toughness and micro hardness tests. The density of the epoxy composite sample was determined using Archimedes’ principle. Regression models were developed, confirmed and validated to appraise effects of aluminum particle sizes and percentage weight on the tensile strength. XRD results indicated a chemical reaction between epoxy system and aluminum particles. There is a fair homogenous distribution of the second phase particles within the developed epoxy structure. Deductions from mechanical property tests revealed epoxy/10% aluminum nanoparticle composite (E/10%Alnp) having optimal tensile strength of 18.58 Nmm−2 with flexural strength of 130.87 Nmm−2, impact energy of 16.30 J and micro hardness value of 12.03 HV. The mechanical property values of E/10% Alnp Nano-composite are comparable with those of existing bumper materials. Moreover, the regression models agree with experiments.
Keywords
Tensile properties
Aluminum particulate
Nano-composites
Bumper
Epoxy

1 Introduction
Pedestrian disability and fatality are worldly health challenges. Bumper and bonnet are identified as automobile parts that wreck havocs most on pedestrians during a pedestrian/automobile collision (Fredriksson et al., 2010; Brussels, 2016). To reduce pedestrian/automobile collision problems, legislation has been made by European Union and Asian Pacific for incorporating pedestrian safety into a bumper design. This demands the use of light materials for automobile bumper and paves ways for development of green materials for automobile applications (Carroll and Barrow, 2014; Brussels, 2016). Epoxy resin is an adhesive thermoset which possesses good thermal stability, low shrinkage on cure, corrosion and chemical resistance (Bello et al., 2015; Agunsoye et al., 2016; Li and Cui, 2016). These properties justify epoxy as a matrix for synthesis of high performance composites for automobile applications. The need to increase safety and enhance fuel efficiency has made development of a light weight car a top priority in automobile industries (Gerard, 2014; America's Plastic Maker, 2016). Generally, advantages of polymeric composites are high specific strength/modulus, reduction in overall weight of the automobiles, fuel efficiency and ease of formability that gives freedom to designers in shapes detailing especially in complicated parts like a tailgate or trunk lid (Wiel, 2012). Application of fibres reinforced plastics have been established in automobile industries, defense, aerospace, electronics and sports but anisotropic problems exist due to inhomogeneous distribution of the fibre within the matrix. The difficulty in the manufacturing of fibres reinforced plastics are also buttressed in the literature (Cheon et al., 1995; Technology and Innovation, n,d).
Now, many researchers are focusing on particle reinforced plastics composite for replacing anisotropic fibre reinforced plastics for engineering applications. Moreover, aluminum micro-particle epoxy composites have been developed. Enhancement in electrical conductivity, wear resistance and impact toughness have been revealed (Vasconcelos et al., 2005; Jianwen et al., 2006; Jafar et al., 2011; Kim et al., 2012; Agrawal and Satapathy, 2014; Agunsoye et al., 2014; Jamaludin et al., 2014) but their poor tensile properties limit their ideality as a replacement for conventional heavy alloys for automobile applications (Srivastava and Verma, 2015). Poor tensile performance of the aluminum micro particle reinforced composites has been linked to weak interface between the matrix and the reinforcing particles which in turns depends on particle sizes (Bello et al., 2017b). A structure developed after curing of epoxy depends on a degree of chemical reaction between epoxy/hardener system and the additive reinforcement (Peters, 1998; Lucas et al., 2011). Also, rate of chemical reaction relates to surface area of reactants which increases with particle refinement (Jeffery et al., 1989; Pokropivny et al., 2007). Epoxy/hardener system when filled with aluminum nanoparticles may display better chemical interaction which is an index to a good interfacial adhesion between epoxy system and the reinforcement.
Optimization is an applied science that aids in producing a best solution to a problem under investigation via systematic input value selection from available or allowable values (Mazahery et al., 2014). Optimization problems can be solved by many approaches including particle swarm optimization, genetic algorithm, adaptive neuro fuzzy-inference system and multiple regression models (Shabani et al., 2014; Shamsipour et al., 2016; Agunsoye et al., 2017). Optimization via adaptive neural network based fuzzy inference system explores a human-like reasoning technique of fuzzy inference systems. It employs input-output and a list of IF-THEN fussy rules. Fussy inference system contains a structured knowledge in which each fuzzy explains a native behavior of the system but it does not have adaptability to deal with a varying external environment. Therefore, for effective optimization, neural network learning technique is usually incorporated to support fuzzy inference system, leading to adaptive neural network based fuzzy inference system (Tofigh et al., 2014). Particle swarm optimization uses population of particles flying over a fitness landscape. It solves optimization problems through physical mobility of individual particles in the swarm and uses simple coding system. Genetic algorithms employ a group of random methods involving several individuals in population working in parallel to know a best solution. Everyone is a potential solution that matures slowly to an optimal solution. Therefore, a measure of fitness is examined via high value that indicates a better solution than a low fitness value (Mazahery et al., 2014). Multiple regressions are data analysis approaches employed to establish a relationship between one continuous criterion variable and other variables or factors (Pallant, 2005; Berger, 2008). Correlation is employed as a basis for regression. It permits a sophisticated exploration of interrelationship among a list of factors/variables and its application is found in investigating both laboratory based and real-life research questions. Two main benefits in using regression models for solving optimization problems are their capability to determine relative influence of one or more predictor variable on the dependent or criterion variable and the use of diagnosis tools such as outlier to identify abnormalities in a set of responses (Agunsoye et al., 2017).
In the present study, epoxy/aluminum particulate Nano-composites have been developed, their micro particle composite grades were also synthesised to appraise the effects of aluminum nanoparticles on the tensile properties of reinforced epoxy Nano-composites through experiment and regression models. Regression models were employed because of its ability to provide significant influences of each predictor variable on the dependent variable through analysis of variance and outlier to fish out abnormalities from responses. Impact toughness, flexural and micro hardness tests were performed on the composite exhibiting peak tensile strength to check its suitability for automobile bumper application through comparison with properties values of existing bumper materials.
2 Materials and methods
Epoxy resin/hardener (Max 1618A/B), alcohol, 56.03 μm aluminum micro particle (Almp) and 59 nm aluminum nanoparticle (Alnp) are the materials used in this study. Epoxy resin/hardener was bought from Polymer Composite Institute, Ontario Canada while ethanol was procured from Guangzhou Jinhuada Chemical Reagent Co. Ltd, China through a local vendor in Lagos. Almp and Alnp were produced from aluminum cans using Top Down Approach in accordance with (Bello et al., 2017a, 2018). Epoxy resin is a glycidyl ether of bisphenol A and hardener belongs to 1,3-diethanamine benzene. In the typical production of epoxy/aluminum composites, Almp was added to 40 cm3 of ethanol in a container. The mixture was mechanically stirred for 5 min at 314 rpm. The mixture was added to epoxy resin (40 cm3) in a beaker and stirred manually for additional 5 min. The mixture was simultaneously stirred magnetically and heated for 60 min at 120 °C using hotplate/stirrer (Stuart UC 152) to evaporate the ethanol. After heating, the composite mix was degassed at 25 mmHg for 1 h. Then, 20 cm3 hardener was added to the mixture equivalent to 2:1 epoxy/hardener ratio and an amount of Almp addition is equivalent to 2wt% of epoxy resin. Then, the mixture was stirred manually with the aid of glass rod and accompanied with 5 minutes’ mechanical stirring at 314 rpm. Thereafter, the composite mix was degassed and manually stirred continuously until the mixture began to cure after which the blend was poured into an open cavity mould. After 48 hours’ room temperature curing, epoxy/aluminum particulate micro-composites (E/Almp) were gently removed from the mould and post cured at 130 °C for 4 h as shown in Fig. 8.
The process was repeated with an increment in wt% of Almp addition up to 12 wt% at an interval of 2wt%. Pristine epoxy without addition of Almp was also produced. The same wt% and procedural techniques were employed for the synthesis of epoxy/aluminum particulate Nano-composite (E/Alnp). This was carried out at Department of Materials Science and Engineering, Kwara State University, Malete. Phases occupying the microstructure of the developed E/Almp and E/Alnp were identified using X-ray diffractometer (XRD) and their morphologies were examined using scanning electron microscope with attached energy dispersive X-ray spectroscope (SEM/EDX). XRD was carried out at Department of Chemical, Metallurgical and Materials Engineering, Tshwane University, Pretoria South Africa.
Tensile dog-bone shape samples, 80 mm long (gage length), 10 mm thick and 6 mm wide were subjected to uniaxial tensile loading at cross-head speed, 0.008 mms−1 equivalent to a strain rate of 0.0001 s−1 in accordance with ASTM D 3039. Flexural test was carried out on 120 mm × 10 mm × 6 mm rectangular samples using 3-point bending method per ASTM D 790-03. The sample was placed on two pivots at 60 mm apart and loaded perpendicularly in the centre using universal testing machine (Instron 3369). 75 mm × 10 mm × 4 mm notched sample was subjected to impact loading in accordance with ASTM D 3763 using House Balance Izod impact tester (serial no 3915) and the micro hardness value of the sample was also determined. Three different samples per level of reinforcement were examined. Average property values and standard deviation were calculated. To appraise the effects of particle size (Ps) and wt% on the tensile strength (Ts) of the developed epoxy/aluminum composites, regression models were developed using a full factorial design of experiment through historical approach involving seven levels-one factor and two factors-five level (25 = 32) experiments. Models were built at α = 0.05, that is 95% confidence level and diagnosed using least square criterion.
Similar mechanical tests were carried out on representative material samples cut from bought Nissan (Almera) and Toyota (Sienna) bumpers. Correlation between mechanical properties of the developed epoxy/aluminum composites and those of existing bumper materials were made.
3 Results and discussion
3.1 X-ray diffractometric profiles and micrographs of epoxy/aluminum particulate composites
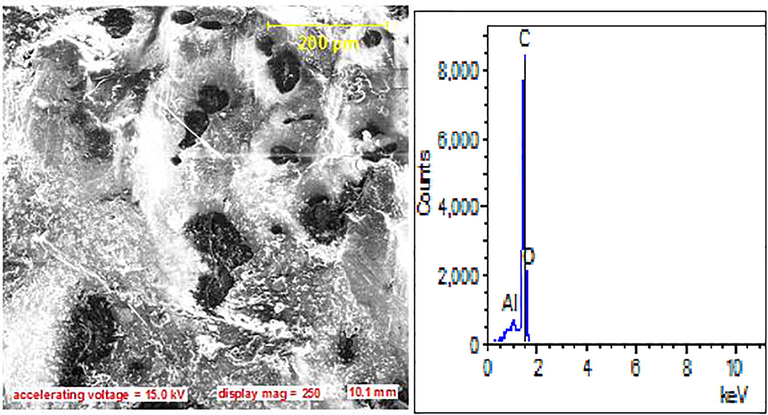
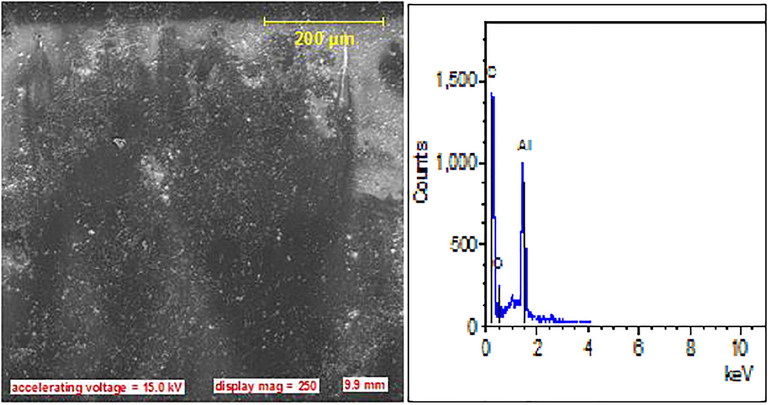
X-ray diffractometric profiles of epoxy polymer and epoxy/aluminum particulate Nano-composite are presented in Figs. 1–2. Two broad peaks found at 18.938 and 42.341° (angle of diffraction, 2θ) in Fig. 1 justify amorphous infusible cross-linked structure developed from chemical reaction between epoxy resin and hardener in a certain stoichiometric ratio. Phases belonging to the peaks are C5H9NO2 and C8H15NO2 with 4.69 Å. When Alnp was added to epoxy/hardener system, reaction mechanism changed leading to formation of new compounds/phase particles such as C4H9NO4, C4H9NO3; C5H4N4 and residual/unreacted Al at different angles and inter-planar spacing as shown in Fig. 2. Presence of new phases within the epoxy matrix in addition to epoxy molecules reduces the spacing of an epoxy molecule from one to another. This is established from smaller inter-planar spacing range (1.22–2.34 Å) of the phases occupying the matrix of epoxy/aluminum particulate Nano-composite than 1.11–4.69 Å of epoxy molecule. Since a reduction in inter-planar spacing relates to packing density of a material, lower inter-planar spacing affirms higher degree of straining of the epoxy/aluminum particulate Nano-composites due to presence of the second phase particles. Consequence of the straining is an increase in the strength of a material, as found in literatures (Peters, 1998; William, 2007; Lucas et al., 2011; Mittemeijer, 2011). This implies that the XRD results predict higher strength for epoxy/aluminum particulate Nano-composite than epoxy polymer when both materials are subjected to mechanical tests under the same conditions. Broadness of the peaks in Fig. 1 revealing amorphous structure is affirmed by SEM microstructure in Fig. 9 having an irregular arrangement of molecules which have been firmly bonded together to form a rigid rock appearance. This indicates a good interaction between epoxy and the hardener. Appearance of dull and white colors are attributed to epoxy molecules detected by the XRD. The epoxy molecules have different chemical formulae; their physical appearances are expected to be varied. When aluminum particles were added, new structures were developed as shown in Figs. 10–11. A matrix saturation is observed in Fig. 10 showing Almp which are incompletely bonded together by epoxy molecules at the top layer.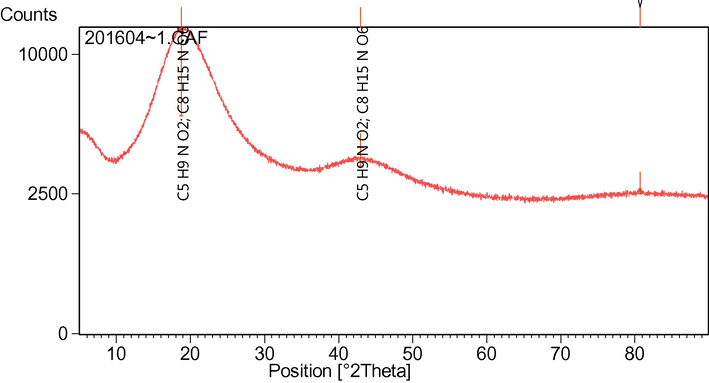
XRD profile of epoxy polymer.
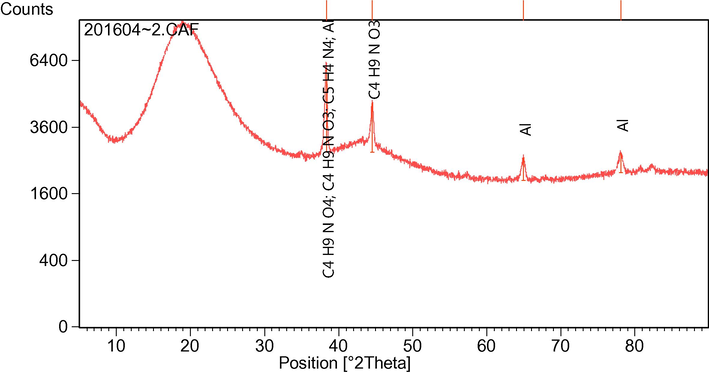
XRD profile of epoxy/aluminum particulate nanocomposite.
Networks of disjointed particles within a matrix usually disturb the mobility of the composite under mechanical (such as tensile) test and impair the mechanical properties of the composites at a stress level below the expectation. Homogenous structure in Fig. 11 is an index to good mechanical performance. It is established from Figs. 10–11 that fineness of aluminum particle causes a better interaction of the particle with epoxy. At 10 wt% Almp and Alnp addition, Alnp distributes evenly within epoxy matrix without any agglomeration or saturation as shown in Fig. 11 while Fig. 10 reveals disjointed Almp due to saturation of the matrix.
3.2 Mechanical properties of epoxy/aluminum particulate composites
3.2.1 Tensile properties
Behavior of E/Almp and E/Alnp composites under tensile loading is shown in Fig. 3. It is observed that the maximum increment (14.96 Nmm−2) in the tensile strength of E/Almp composite occurred at 6 wt% of Almp addition. Above this reinforcing level, there was a degradation in the tensile properties. This behavior is linked to saturation of Almp or ceramic compounds with epoxy matrix. That is, there are domains of freely existing Almp particles that are not bonded together by the matrix. The freely existing particles interfered with E/Almp mobility under uniaxial loading. Because of their free movement during composite pulling, regions of discontinuity/empty spaces were created within the composite. This acted as stress raisers, leading to shear yielding of the E/Almp composites under lower loadings than expected. However, increment in the tensile strength is connected to high reinforcing tendency of the second phase compounds and their good interfacial bonding with the matrix before matrix saturation was reached. In the case of E/Alnp composites, increase in tensile strength is high up to 4 wt% Alnp additions. Steepness of the E/Alnp curve within this range affirmed this fact. Above 4 wt% up to 10 wt%, the gentle slope of the E/Alnp curve shows a little improvement in the tensile strength. Fall in the tensile strength above 10 wt% was noticed and could be linked to saturation of the epoxy matrix. Comparing both E/Almp and E/Alnp tensile strengths, greater steepness of the E/Alnp curve implies that addition of Alnp to epoxy causes higher increase in the tensile strength than does the Almp addition. Fineness of Alnp led to better interfacial adhesion with epoxy matrix than Almp. Percentage elongation of E/Almp at all levels of reinforcement are lower than those of the epoxy matrix. Furthermore, there is an increment in the elongation as the Almp wt% addition increased until 10 wt% of Almp addition. E/Alnp composite has peak percentage elongation at 2 wt% Alnp addition. Above this level of reinforcement, there is a gradual reduction in the elongation. This fairly agrees with conventional strength/elongation relationship that is, the higher the strength, the lower the elongation.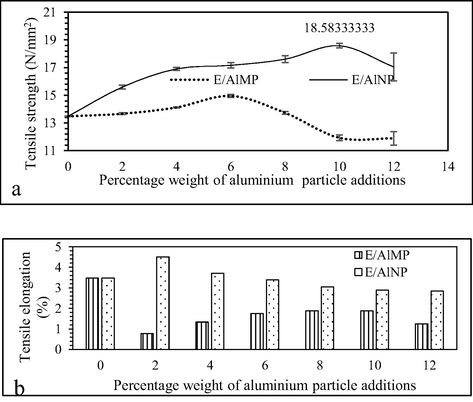
Tensile (a) strength, (b) elongation of E/Almp and E/Alnp composites.
Results of this study show better tensile properties than poor tensile strength acclaimed to epoxy/80 μm aluminum composite above 1 wt% found in (Srivastava and Verma, 2015). The tensile strength increase found in this study may be attributed to compatibility and strong interfacial bonding between epoxy matrix and the reinforcements. Better tensile properties of aluminum epoxy composite in this study than 80 μm aluminum particle reinforced epoxy reported in (Srivastava and Verma, 2015) can be linked to dispersion of Almp/Alnp in alcohol prior to addition to epoxy and higher fineness (56 μm/59 nm) of Almp/Alnp than the 80 μm aluminum particles by Srivastava and Verma (2015). Moreover, enhancement in mechanical properties of composites due to fineness of particulate reinforcement has been proposed in literature (Pokropivny et al., 2007; William, 2007; Lucas et al., 2011). Also, addition of reinforcement to epoxy has been reported to have caused improvement in mechanical properties of the epoxy composites. For instance 57.8%, 60.1% and 63.2% increase in flexural strengths of epoxy/copper partictle composites due to 40 vol% of respective coarse, fine and mixed copper particles addition to epoxy was revealed in (Pargi et al., 2015). Baghat and his co-researchers disclosed 4.06% enhancement in tensile modulus due to 8% graphite addition to epoxy (Baghat and Verma, 2013). Similarly, incorporation of 2 wt% glass fibers (grafted by amino terminated hyperbranched polymer) into epoxy enhanced tensile strength of the epoxy/glass fiber composite by 31.1% but degradation in tensile strength was reported at 5 wt% (Li and Cui, 2016). Furthermore, 11% and 38% increases in tensile strengths of epoxy/aluminum composites obtained in this study due to 6 wt% Almp and 10 wt% Alnp incorporated into epoxy are in line with findings from previous studies (Baghat and Verma, 2013; Pargi et al., 2015; Li and Cui, 2016). However, E/Alnp composites show a better elongation than E/Almp composites at all reinforcement levels. From the results obtained, epoxy/Alnp composites possessing moderate ductility and strength have been achieved.
3.3 Modelling of tensile strength of epoxy/aluminum composites
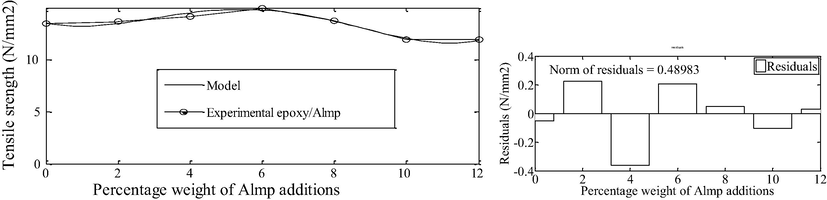
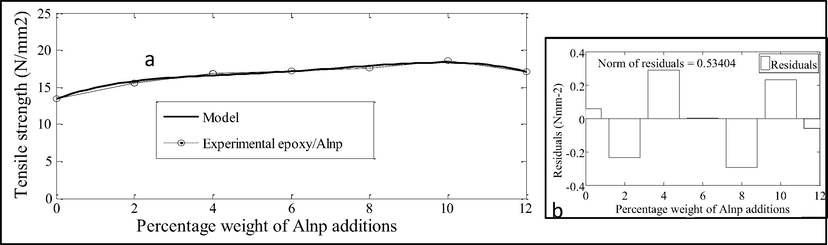
Fig. 4 and Tables 1–3 present prediction of E/Almp composite tensile strength using wt% of Almp (Am) as the predictor variable. It is understood from Fig. 4 that the model fairly fits the experimental data. The goodness of the fit to the experimental data is observed in Table 1. Regression coefficient of determination (R2) for the model is 0.9684 and mean of residuals is 0.003. It can be infered that this model has 96.84% predictability with R2 = 1 and the model is free from systematic errors in response generation. The implication is that the model predicts and validates the relationship between the predictor variable (Am) and response (tensile strength). The significance (0.032) of the model being less than 0.05 implies that the model is statistically relevant/significant to the prediction of tensile strength using Am as the predictor variable. The regression coefficients in Table 2 characterise the coefficients (a) in Eq. (1) which is the model function for predicting the tensile strength and their corresponding residuals, which are presented in Table 3.
Fitting of tensile strength data of E/Almp composites.
Sum of squares
Model
Mean
Significance
Residuals
Regression
R square
Residuals
0.2399
7.5823
0.9684
0.003
0.032
a1
a2
a3
a4
a5
+0.0034445
- 0.080754
+0.052852
−0.8047
+13.531
Tensile strength (Nmm−2)
Order
Am
Actual
Predicted
Residuals
1
0
13.47944
13.5
0.02056
2
2
13.67056
13.4
-0.27056
3
4
14.12167
14.5
0.37833
4
6
14.95667
14.8
-0.15667
5
8
13.73111
13.7
-0.03111
6
10
11.92389
12
0.07611
7
12
11.89333
11.9
0.00667
Results of regression analysis on E/Alnp tensile strength are shown in Fig. 5 and Tables 4–6. It is discernible from Fig. 5 that both the model and experimental curves are superimposed, revealing that the experimental data were well fitted by the model. Regression coefficient of determination, R2 in Table 4 is 0.9808 (98.08%). Essence of this value is that about 98.1% of the experimental data (responses) can be explained by the model and in every 1000 data, only 19 cannot be accounted for. This shows goodness of fit and the model is relevant in explaining the relationship between the predictor variable (An) and the response (tensile strength). Table 6 shows the predicted values obtained from Eq. (2) using regression coefficients in Table 5 and An.
Fitting of tensile strength data of E/Alnp composites.
Sum of squares
Model
Mean
Residuals
Regression
R square
Residuals
Actual Ts
0.313561
16.31665
0.980783
−0.012
16.62649
a1
a2
a3
a4
a5
−0.0023977
+0.057118
−0.47668
1.9455
+13.421
Order
Predictor
Tensile strength (Nmm−2)
An
Actual
Predicted
Residuals
1
0
13.47944
13.4
−0.07944
2
2
15.59167
15.8
0.208333
3
4
16.90778
16.6
−0.30778
4
6
17.16611
17.2
0.033889
5
8
17.60833
17.9
0.291667
6
10
18.58333
18.3
−0.28333
7
12
17.04878
17.1
0.051222
To appraise the effects of particle size (Ps) and particle wt% (Pwt) of aluminum particles (Almp, Alnp) on the tensile strength of E/Almp and E/Alnp composites, two factor interaction (2FI) model was developed for predicting the tensile strength (response) using both Ps and Pwt as predictors. Function derived for the model is revealed in Eq. (3). The third column of Table 7 presents values of beta (β) in Eq. (3). It was observed from the 4th column of Table 7 that Ps, Pwt% and their products influence the response (tensile strength). Moreover, Pwt is the most influencing factor, followed by the product of Ps and Pwt. Finding from the model agrees with rules of mixtures that establish an increment in the strength/modulus with increasing wt% or vol% of reinforcement (William, 2007; Mittemeijer, 2011). Furthermore, negative beta values of Ps and Ps × Pwt are a prediction of a decrease in the tensile strength with aluminum particle coarsening, that is particle refinement enhances the tensile strength of epoxy aluminum composites. This observation is analogous to Hall-Perch relation that affirms an increase in the strength with grain refinement (Perez, 2004; Lucas et al., 2011). Findings from this model show a good agreement with those of experimental studies (see Fig. 3). Analysis of variance (ANOVA) in Table 8 depicts that this model is significant at 0.000 level in the null hypothesis. This implies that all predictors are significant factors that influence the tensile strength, though constant, Pw and PwtxPs significantly influence the tensile strength more than Ps (see 6th column of Table 7). Results of model diagnosis disclose absence of an outlier in the response matrix (see Fig. 6), freedom of the model from systematic error and any critical case that may demand further attention to the model (see Table 9). Hence, this model is appropriate to explain the relationship between the response (tensile strength) and the predictor variables (Ps, Pwt) and shows good prediction of the tensile strength (R2 = 0.835 [83.5%]). This is commensurate with observations in (Atuanya et al., 2014; Agunsoye et al., 2017). The model can be used to predict the tensile strength of particulate reinforced epoxy composite at any particle size and wt% within or outside the scope of the experiment.
Standard order
Predictors
β
Std. Error
Standardised β
Sig.
95% confidence interval for β
Tolerance
VIF
Lower Bound
Upper Bound
1
(Constant)
14.924
0.336
0.000
14.247
15.601
2
Pwt
0.292
0.045
0.558
0.000
0.202
0.383
0.499
2.003
3
Ps
−0.013
0.008
−0.176
0.115
−0.030
0.003
0.307
3.254
4
PwtxPs
−0.008
0.001
−0.810
0.000
−0.010
−0.005
0.254
3.931
Standard order
Model
Sum of Squares
Df
Mean Square
F
Sig.
R square
1
Regression
179.862
3
59.954
75.774
0.000
2
Residual
35.605
45
0.791
3
Total
215.467
48
4
Summary
0.835
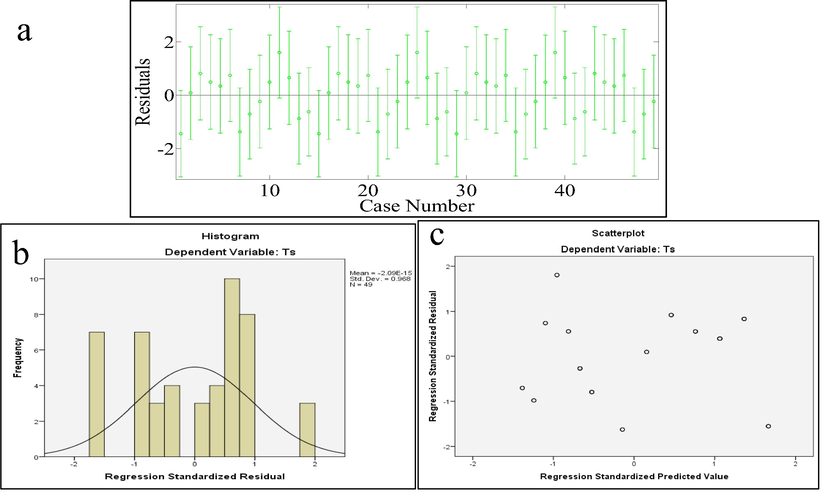
Residual plots indicating absence of outlier in the response matrix.
Minimum
Maximum
Mean
Std. Deviation
Mahalalabonis Distance
0.885
6.288
2.939
1.758
Cook's Distance
0.000
0.128
0.027
0.036
Std. Residual
−1.623
1.804
0.000
0.968
4 Correlation between properties of the developed epoxy/aluminum particulate composite with those of existing bumper materials
The peak increase in tensile strength (18.58 Nmm−2) of aluminum particle reinforced epoxy and moderate percentage elongation (2.89%) was found at 10% Alnp addition to epoxy corresponding to E/10%Alnp Nano-composite. To probe suitability of E/10%Alnp for automobile bumper applications, impact, flexural and micro hardness tests were carried out on E/10%Alnp as explained earlier in this write-up. Correlation of properties of E/10%Alnp Nano-composite with those of existing bumper materials is displayed in Fig. 7a–e. Fig. 7a reveals greatest tensile strength of the developed E/10%Alnp than those of Toyota (Sienna) and Nissan (Almera) bumper materials. Flexural strength of the developed E/10%Alnp is slightly lower than that of Toyota (Sienna) and greater than that of Nissan (Almera) as revealed in Fig. 7b while Fig. 7c depicts lowest impact toughness in respect of the developed E/10%Alnp. Density of the developed E/10%Alnp is slightly greater than each of Toyota (Sienna) and Nissan (Almera) bumper materials. It can be affirmed from Fig. 7 that tensile strength, flexural strength and density of the developed E/10%Alnp are within property value ranges for targeted applications but its slightly lower impact toughness than those of the Toyota and Nissan bumper materials reduces its integrity. Moreover, the impact toughness of the developed E/10%Alnp Nano-composite falls within 10–18 J for glass reinforced thermoplastic (GMT) bumper material found in (MatWeb Material Property Data, 2010). This implies that impact toughness (16.3 J) of E/10%Alnp Nano-composite is still satisfactory for the bumper application. Micro hardness value of E/10%Alnp Nano-composite, 12.03 HV is higher than each of Toyota Sienna (11.5 HV) and Nissan Almera (10.5 HV) as displayed in Fig. 7e but it is less than maximum hardness for bumper materials specified by ECE/324 regulation No 42 found in (Balamurugan, 2009). Moreover, E/10%Alnp composite containing evenly dispersed Alnp within its structure as established by SEM micrograph in Fig. 11 is isotropic and free from directional property exhibited by existing fibre reinforced composite bumpers. Anisotropy usually causes failure of fibre reinforced composite in service due to sudden change in loading level especially in a direction which is not parallel to the fibre reinforcement (Davoodi et al., 2010; Bello et al., 2017b).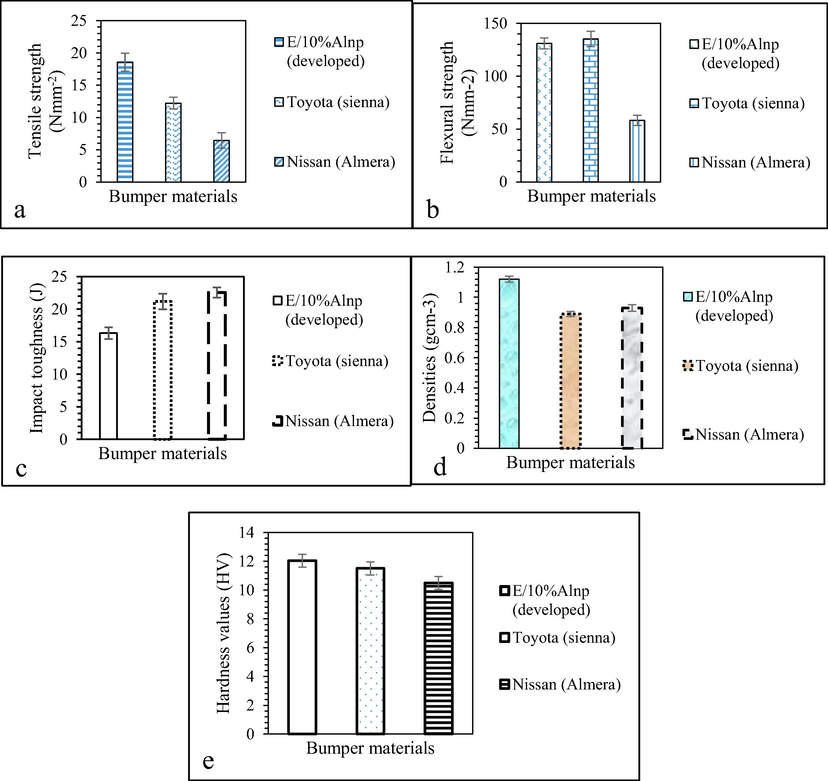
Correlation between properties of the developed epoxy Aluminum particulate Nano-composite and those of existing bumper materials.
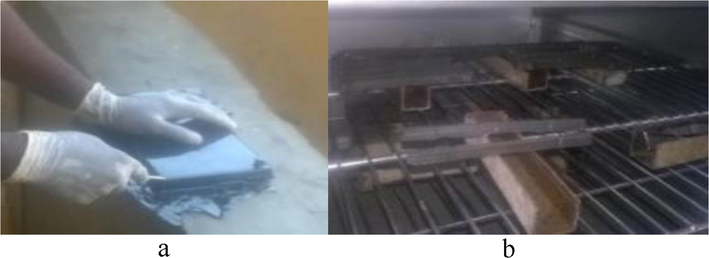
Images showing removal of E/Almp composite from the mould (a) and E/Almp composite samples ready for post curing (b).
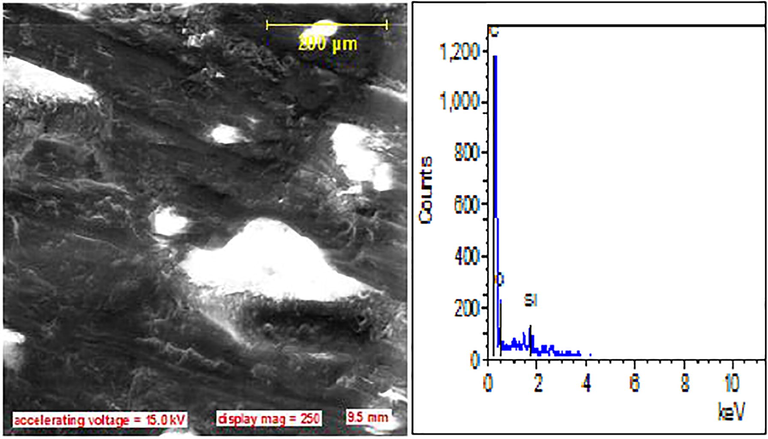
SEM/EDX of epoxy polymer.
SEM/EDX of epoxy/aluminum particulate micro-composite.
SEM/EDX of epoxy/aluminum particulate nanocomposite.
5 Conclusions
Based on the observations from the results of the experimentation of this study, the following conclusions are inferred:
-
An optimal tensile strength (18.58 N/mm2) was obtained at 10 wt% of aluminium nanoparticles addition to epoxy.
-
Smaller size of aluminum nanoparticles is attributable to better tensile properties of epoxy aluminum Nano-composite than those of its micro composite counterpart.
-
Multiple regression model reveals aluminum particle weight percent (Pwt) being the predictor variable having higher significant influence on tensile strength of epoxy aluminum composite when compared with aluminum particle size (Ps).
-
Regression coefficients of determination 96.84% (for nonlinear model, Am), 98.01% (for nonlinear model, An) and 83.5% (for 2FI model, Pwt/Ps) confirm good predictions of experiments by the models.
-
The developed epoxy aluminum particulate Nano-composite (E/10%Alnp) is suitable for automobile bumper application.
Acknowledgement
Authors show their gratitude to Department of: Metallurgical and Materials Engineering, University of Lagos; Materials Science and Engineering, Kwara State University, Malete; Ceramics, Federal Industrial Institute of Research Oshodi (FIIRO); Materials Science and Engineering, Obafemi Awolowo University; Chemical, Metallurgical and Materials Engineering, Tshwane University, Pretoria, South Africa and Engineering Materials Development Institute (EMDI), Akure for using their laboratories in the experimentation of this work. This work was supported by the Nigeria-TETFUND-IBR grant (KWASUNGR/CSP/251116/VOL3/TETF/0037) accessed through Centre for Sponsored Project, Kwara State University, Malete, Nigeria.
References
- Experimental Investigation of Micro-sized Aluminium Oxide Reinforced Epoxy Composites for Microelectronic Applications. Procedia Mater. Sci.. 2014;5:517-526.
- [CrossRef] [Google Scholar]
- Experimental Investigation and Theoretical Prediction on Tensile Properties of Particulate Reinforced Polymeric Composites. J. King Saud Univ. – Eng. Sci. 2017
- [CrossRef] [Google Scholar]
- Assessment of mechanical and wear properties of epoxy based hybrid composites. Adv. Prod. Eng. Manage.. 2016;11(1):5-14.
- [CrossRef] [Google Scholar]
- The Development and Characterisation of Aluminium Dross-Epoxy Resin Composite Materials. J. Mater. Sci. Res.. 2014;3(2)
- [CrossRef] [Google Scholar]
- America's Plastic Maker, 2016. Plastic Car and Bumper Systems. America: America's Plastic Maker, pp. 1–2.
- Experimental study of the thermal and wear properties of recycled polyethylene/breadfruit seed hull ash particulate composites. Mater. Des.. 2014;53:65-73.
- [CrossRef] [Google Scholar]
- Effects of graphite fillers on mechanical behaviour of epoxy composites. Int. J. Emerging Technol. Adv. Eng.. 2013;3(2):427-430.
- [Google Scholar]
- Balamurugan, A.G., 2009. Automotive Bumper and Energy Absorber.
- Potential of Carbonised Coconut Shell as a Ball-Milling Interface for Synthesis of Aluminium (1xxx) Nanoparticles. Ann. Faculty Eng.. 2017;15(2):149-157.
- [Google Scholar]
- Bello, S.A., Agunsoye, J.O., Adebisi, J.A., Kolawole, F.O., Raji, N.K., Hassan, S.B., 2018. Quasi Crystal Al (1xxx)/Carbonised Coconut Shell Nanoparticles: Synthesis and Characterisation. MRS Advances, Published by Cambridge Core, Firstview, pp. 1–13. doi:10.1557/adv.2018.369.
- Effects of Aluminium Particles on Mechanical and Morphological Properties of Epoxy Nanocomposites. Acta Periodica Technological. 2017;48:25-38.
- [Google Scholar]
- Epoxy Resin Based Composites, Mechanical and Tribological Properties: A Review. Tribol. Ind.. 2015;37(4):500-524.
- [Google Scholar]
- Berger, D.E., 2008. Introduction to Multiple Regression Claremont Graduate University, pp. 1–13.
- TTIP-Car Safety Analysis in the EU and US in Relation to US and EU Regulatory Standrads Crash Testing Indutrial Transformation and Advanced Value Chains, Automotive and Mobility Industries. European Commision; 2016. p. :1-538.
- Carroll, J.A., Barrow, A.H., B, J., Robinson, B., 2014. Client Project Report CPR1825 Pedestrian Legform Test Area Assessment Final Report. Europe: Transport Research Laboratory, European Commission, DG Enterprise 121/PP/2011/FC, pp. 1–106.
- Development of the composite bumper beam for passenger cars. Compos. Struct.. 1995;32(1):491-499.
- [CrossRef] [Google Scholar]
- Mechanical properties of hybrid kenaf/glass reinforced epoxy composite for passenger car bumper beam. Mater. Des.. 2010;31(10):4927-4932.
- [CrossRef] [Google Scholar]
- Priorities of pedestrian protection– A real-life study of severe injuries and car sources. Accid. Anal. Prev.. 2010;42(6):1672-1681.
- [Google Scholar]
- Gerard, K., 2014. High Performance Plastics Used in the Automotive Industry: CRAFTECH BLOG, pp. 1-6.
- Study of AC Electrical Properties of Aluminium-Epoxy Composites. J. Al-Nahrain Univ.. 2011;14(3):77-82.
- [Google Scholar]
- Performance and Thermal Analysis of Aluminium Oxide Filled Epoxy Composite as TIM for LEDs. Mater. Sci. Res. India. 2014;11(1):35-41.
- [CrossRef] [Google Scholar]
- VOGEL's Textbook of Quantitative Chemical Analysis (5 ed.). New York: Longman Scientific and Technical; 1989.
- A Novel Aluminum-Filled Composite Dielectric for Embedded Passive Applications. IEEE Tarans. Adv. Packaging. 2006;29(2):295-306.
- [Google Scholar]
- Enhancement of mechanical properties of aluminium/epoxy composites with silane functionalization of aluminium powder. Compos. B Eng.. 2012;43(4):1743-1748.
- [CrossRef] [Google Scholar]
- Enhancing the mechanical properties of epoxy resin by addition of an amino-terminated hyperbranched polymer grown on glass fiber. J. Mater. Sci.. 2016;51(4):1829-1837.
- [CrossRef] [Google Scholar]
- Lucas, F.M.d.S., Andreas, Ö., Robert, A., 2011. Handbook of Adhesion Technology. Springer-Verlag Berlin Heidelberg.
- MatWeb Material Property Data, 2010. Azdel Plus C401-B01 40% Chopped Fiber Mat/PP Resin Matrix. 2010, from http://www.matweb.com/search/datasheet.aspx?MatGUID=c9cea89b3274415d892ea6af98f39647
- Searching for the superior solution to the population-based optimization problem: Processing of the wear resistant commercial AA6061 AMCs. Int. J. Damage Mech.. 2014;23(7):899-916.
- [CrossRef] [Google Scholar]
- Fundamentals of Materials Science_ The Microstructure-Property Relationship Using Metals as Model Systems (1 ed.). Berlin Heidelberg: Springer-Verlag; 2011.
- SPSS Survival Manual (2nd ed.). Australian: Allen & Unwin; 2005.
- Recycled-copper-filled epoxy composites: the effect of mixed particle size. Int. J. Mech. Mater. Eng.. 2015;10(1):3.
- [CrossRef] [Google Scholar]
- Fracture Mechanics (1 ed.). US: Springer; 2004.
- Peters, S.T., 1998. Handbook of Composites (S. T. Peter Ed. 2nd ed.). England: Springer Science+Business Media Donlrecht.
- Introduction to Nanomaterials and Nanotechnology. Tartu University Press; 2007.
- Refined microstructure of compo cast nanocomposites: the performance of combined neuro-computing, fuzzy logic and particle swarm techniques. Neural Comput. Appl.. 2014;26(4):899-909.
- [CrossRef] [Google Scholar]
- Optimization of the EMS process parameters in compocasting of high-wear-resistant Al-nano-TiC composites. Appl. Phys. A. 2016;122(4)
- [CrossRef] [Google Scholar]
- Mechanical Behaviour of Copper and Aluminium Particles Reinforced Epoxy Resin Composites. Am. J. Mater. Sci.. 2015;5(4):84-89.
- [CrossRef] [Google Scholar]
- Technology and Innovation, n,d. Challenges in composites. Aircraft Technol. 116, 52–56.
- Application of the combined neuro-computing, fuzzy logic and swarm intelligence for optimization of compocast nanocomposites. J. Compos. Mater.. 2014;49(13):1653-1663.
- [CrossRef] [Google Scholar]
- Impact fracture study of epoxy-based composites with aluminium particles and milled fibres. J. Mater. Process. Technol.. 2005;170(1–2):277-283.
- [CrossRef] [Google Scholar]
- Wiel, J.W.V.d., 2012. Future of Automotive Design & Materials Trends and Developments in Design and Materials. Automatic Technology Centre, acemr.eu
- Materials Science and Engineering An Introduction (7th edition). United State of American: John Wiley & Sons Inc.; 2007.


