

Translate this page into:
Optimization of glutamic acid production by Corynebacterium glutamicum using response surface methodology
⁎Corresponding author. kingshyam2003@gmail.com (Shyam Kumar Rajaram)
-
Received: ,
Accepted: ,
This article was originally published by Elsevier and was migrated to Scientific Scholar after the change of Publisher.
Peer review under responsibility of King Saud University.
Abstract
The body to build proteins can use l-Glutamic acid (l-GA). Earlier it was obtained from plant sources, later on microbes have been explored for the production. Corynebacterium glutamicum is a prominent organism used to harvest the glutamic acid. Submerged fermentation was adopted for l-GA production. Various nitrogen/carbon substrates used to find out the best nitrogen and carbon source. Statistical methods especially RSM (response surface method) stayed employed for the effect of various factors such as inoculum size, urea, glucose and salt on the l-GA production. As per the preliminary studies, urea and glucose were chosen as carbon and nitrogen sources. Further, the optimum values have been maximally documented in the glucose (50 g/L), then urea (10 g/L), 19.24% of salt solution and 5% of inoculum size. Maximum Yield of l-GA is produced through RSM-16.49 g/L. The experimental l-Glutamic acid production was 16.36 g/L at an optimum condition that compared well to the maximum predicted values by RSM (16.499 g/L). Non-linear regression quadratic model was developed for the l-GA synthesis; the methodology was validated statistically and the determination coefficient (R2) was found to be 0.991. Thus the study identified the potential carbon and nitrogen source for a higher yield for l-GA using C. glutamicum under submerged fermentation and also this method minimizes the time for optimizing the medium components statistically.
Keywords
l-Glutamic acid
RSM
Corynebacterium
Optimization

1 Introduction
The preparation of amino acids by microbiological ways is highly beneficial because the product would be purely optically active. Glutamic acid is a non-essential and multifunctional amino acid that plays a vital role in neurotransmitter signaling, a precursor for other amino acids like proline and arginine, gastric function, taste discernment and also intermediatory metabolism. Similarly, l-GA is the first kind of amino acid that was produced commercially. Nowadays the l-GA is largely produced using microbial fermentation. However, chemical synthesis of l-GA is not entertained due to the formation of a racemic mixture of glutamate (i.e. both D and l-GA) and sometimes that to not of food grade. In the beginning, l-GA was isolated from gliadin through acid hydrolysis by the German chemist (Ritthausen, 1866). Later, A Japanese chemist (Ikeda, 1908) found, GA was used for enhancing, “konbu”, alternatively known as Laminaria Japonica, which is used for centuries in Japan for the formulation of soup stocks. In the year 1909, GA with salted form was finalized commercially in trade popularly know as “Ajinomoto” (Ault, 2004), used in the form of monosodium-glutamate (MSG) for improving the flavor and taste in processed foods, vegetables, meat, etc (Hirasawa and Shimizu, 2017). Nowadays the utilization of l-GA increased in multiple industries such as food industries, biochemical processing, cosmetic and pharmaceutical industries (Hermann, 2003). l-GA is mainly imported amino-acid (aa) in India. During the past decade(s), l-GA synthesis directly from micro-organisms by fermentation process was becoming popular. By using the microorganisms, the overall global production of l-GA is increased to fifteen lakhs tons/annum (Shimizu and Hirasawa, 2006). Several strains belong to Corynebacterium and Brevibacterium are broadly used for the conversion process, which was utilized for the bioprocessing industry to yield various amino acids involving GA (Kumar et al., 2013). Microbial excretion of l-GA increased when the fermentation media fed with ammonia-rich substrate becoming the standard method for the production of commercial MSG. Whereas, the major challenges and the limitation faced by the industries are overall cost of amino acid production and manual process optimization are time-consuming and require more experimental runs. Over a period of years, l-GA producing microorganisms were isolated and subsequent research resulted in fermentative process for the production of l-GA (Kinoshita et al., 2004; Shyamkumar et al., 2014; Zareian et al., 2012). Almost the l-glutamic acid available commercially is being produced by fermentation process. Thus there is a need for advanced statistical approaches to explore and identify the potential substrates available for the efficient production of l-GA within an appropriate time and production cost.
The literature survey reported that there were a number of substrates used for the synthesis of glutamic acid. Glutamic acid was synthesized from palm waste hydrolyzate supplemented with glucose using Brevibacterium lactofermentum (Das et al., 1995). Cassava starch (Jyothi et al., 2005) and sugar-cane bagasse (Amin and Al-Talhi, 2007) are considered as one of the agriculture waste materials, which are all utilized as a cheap source for the synthesis of l-GA using Corynebacterium glutamicum under submerged fermentation conditions (Tavakkoli et al., 2012). As a possible approach to improve the economic production of glutamic acid it is necessary to exploit the economic production methodologies. Most of the earlier studies on the production of GA are used for the conventional method known “as one factor at a time” for the design of the multifactorial experiment in the production of GA (Jyothi et al., 2005). Usually, the single-dimensional study is lengthy, prolonged, and incompetent for attaining an accurate optimal due to overlooking an interrelation amongst the variables. For solving this specific kind of problems RSM was implemented to study the consequence of individual factors and their interactive effect on glutamic acid production (Hirasawa and Shimizu, 2017; Sunitha et al., 1998; Tavakkoli et al., 2012). Hence, the present study describes the influence of independent variables and their interactive influences in GA production in sub-merged fermentation process.
2 Materials and methods
2.1 Microorganism
The stock culture of C. glutamicum NCIM2168 was obtained from NCIM Institute, Pune, India. The culture was stored in nutrient-agar slants with a regular subculture. 100-mL of sterile medium (nutrient broth) in 250 mL flask transferred from the agar slant aseptically.
2.2 Selection of carbon/nitrogen source
Appropriate carbon and nitrogen source for GA synthesis selected with various carbon sources (glucose, fructose, lactose, sucrose and wheat bran) and various nitrogen sources (ammonium sulfate, ammonium chloride, soybean meal, potassium nitrate and urea) supplemented individually in the basal medium (K2HPO4-1 g/L, MgSO47H2O-2.5 g/L, MnSO4·7H2O-0.1 g/L, CaCO3-1.6 g/L). The production medium was prepared with the basal medium which was supplemented with various carbon and nitrogen sources. The fermentation medium was inoculated and incubated in a shaking incubator at 200 rpm at 30 °C for two days. After the incubation period, centrifugation (10,000g for 15 min) was performed to remove cells and the supernatant was used for assessment of GA.
2.3 Estimation of GA
GA in culture medium was detected by using thin layer chromatography using the solvent ratio of 4:1:1 (n-butanol: acetic acid: water). The pray solution is known as 0.02% ninhydrin solution, used to apply in the spots and further the colorimetric estimation method was employed to estimate the GA in the suspension (Spies, 1957).
2.4 Response surface methodology
Initially, the various carbon and nitrogen sources are evaluated by one at a time approach and the input variable which has a significant effect on l-GA production by C. glutamicum was identified. Similarly, the significant variables are taken into consideration and the response surface methodology was employed to study the individual and interactive effects of the chosen parameters on l-GA production. A set of 31 experiment was designed using face-centered central composite design (FCCCD) to determine the optimum concentration of input variables for the maximum l-GA production. This statistical approach is applied to evaluate the key, interaction and quadratic effects of the factors. Each parameter were studied at 2 different levels i.e., minus/plus one to low and high values. These converted variables for −/+ is confirmed as coded variables without the unit of measurement (Vining, 1999). Based on the below formula the transformation will be used
From this equation, we defined X-natural variable; Z-coded variable; x-min/max; min and max values for natural variables. Design expert (6.0.10) software was used for the experimental design and the analysis of variance (ANOVA) was generated. The regression coefficient for the non-linear quadratic effect of individual variables and their interactive effects on l-GA synthesis were determined. The significance of the model developed was judged statistically by computing the coefficient of determination (R2) and associate probability p-value (i.e. <0.05).
3 Results and discussion
Recently, the study suggests that C. glutamicum an excellent producer of GA in the fermentative process could be a possible approach to improve the economic production for the growing demand. Similarly, different kinds of substrates and raw materials were used to enhance the production GA. However the efficient fermentation conditions dependent on the statistical optimization studies. To further enhance the GA production we applied media optimization study statistically to determine the significant carbon, nitrogen, inoculum size and salt requirement at the optimized condition for the maximum yield. Thus, among all carbon sources studied, the C. glutamicum produced maximum yield of GA in glucose (10.3 g/L), followed by sucrose (8.7 g/L) and fructose (6.8 g/L) (Table 1). Wheat bran has the influence of decreased GA production. Among the various nitrogen sources, urea (8.5 g/L) favored maximum GA production, followed by potassium nitrate (4.2 g/L), ammonium sulfate (3.8 g/L). Therefore, glucose and urea were chosen on the basis of carbon cum nitrogen, for the design and optimization of medium components. It was reported that glucose and urea used as carbon cum nitrogen foundations directly influencing GA synthesis and increased the consumption of glucose after 48 h fermentation about 90% glucose (Nampoothiri and Pandey, 1996) with Brevibacterium spp. Another report revealed that the production of GA is increased due to glucose consumption with urea as a nitrogen source (Joseph and Rao, 1973). Nitrogen source is opted through micro-organisms and carbon source through the observed yields. The GA production from hydrolyzed waste of cassava shows higher yield because of the high concentration of glucose content and availability of different nitrogen source especially urea which enhances the productivity of organisms (Jyothi et al., 2005). As mentioned earlier, the glutamic acid is one of the amino acid largely produced worldwide about fifteen lakhs tons/annum in the form of MSG (Seasoning salt). The MSG is used variably in all food industry for the enhancement of food flavour and taste. Similarly, Polyglutamic acid (PGA) is an another commercial product produced from the polymerization of glutamic acid. In recent years, the PGA and its derivatives have been great interest of study due to its wide range of commercial applications in the field of food, water purification, cosmetics, healthcare etc (Shih et al., 2002).
Nutrient source
Glutamic acid (g/L)
Carbon source (1%)
Glucose
10.3
Fructose
6.8
Lactose
5.9
Sucrose
8.7
Wheat bran
3.1
Nitrogen source (1%)
Ammonium sulfate
3.8
Ammonium chloride
3.6
Soybean meal
3.3
Potassium nitrate
4.2
Urea
8.5
3.1 Optimization by response surface methodology
The submerged fermentation process used for the synthesis of glutamic acid from C. glutamicum. Preliminary experiments on GA synthesis by C. glutamicum indicated that the most significant parameters were carbon source and nitrogen source, along with this salt solution (minerals) and inoculum volume were also included for optimization studies. These four factors considered as the independent variables and their influences on GA synthesis reviewed using an RSM. The optimized results for FCCCD experiment in this study are influenced by (i) glucose, (ii) urea, (iii) salt solution and (iv) inoculum size on production GA, tabulated in Tables 3 and 4 clubbed with both the predicted cum observed values. The attained regression equation after ANOVA analysis confirmed as R2-99.61%, which confirmed an acceptable alteration for the quadratic model, experimental data indicates as 98.56% of the variability in the response model.
Using the design expert software, co-efficient of the regression equation was obtained. The production of l-GA value for R-0.98 and it shows a perfect correlation among the predicted values by statistical model and experimental of GA synthesis (Table 2), and ANOVA confirmation analysis is shown in Table 3.
Note: X1 – Glucose g/L; X2 – Urea g/L; X3 – Salt solution v/v; X4 – Inoculum size v/v.
Run Order
Coded variables
Glutamic acid yield (g/L)
Residual value
X1
X2
X3
X4
Experimental value
Predicted value
1
1
1
1
−1
15.11
14.79
0.32
2
1
1
−1
−1
12.98
13.37
−0.39
3
1
−1
1
1
12.80
13.00
−0.2
4
−1
1
1
−1
5.23
5.53
−0.3
5
−1
1
−1
−1
6.12
5.80
0.32
6
−1
−1
−1
1
5.22
5.43
−0.21
7
−1
−1
−1
−1
6.11
6.23
−0.12
8
1
−1
−1
1
13.33
13.28
0.05
9
1
1
1
1
16.36
16.50
−0.14
10
1
−1
1
−1
12.45
12.61
−0.16
11
−1
1
1
1
6.77
6.76
0.01
12
−1
1
−1
1
6.24
6.33
−0.09
13
−1
−1
1
−1
3.67
3.56
0.11
14
−1
−1
1
1
3.60
3.46
0.14
15
1
−1
−1
−1
13.70
13.59
0.11
16
1
1
−1
1
14.44
14.37
0.07
17
1
0
0
0
14.79
14.46
0.33
18
−1
0
0
0
6.11
5.90
0.21
19
0
1
0
0
9.71
9.52
0.19
20
0
−1
0
0
8.34
7.99
0.35
21
0
0
−1
0
8.23
7.98
0.25
22
0
0
1
0
7.99
7.70
0.29
23
0
0
0
1
8.76
8.39
0.37
24
0
0
0
−1
8.11
7.94
0.17
25
0
0
0
0
8.27
8.43
−0.16
26
0
0
0
0
8.32
8.43
−0.11
27
0
0
0
0
8.24
8.43
−0.19
28
0
0
0
0
7.09
8.43
−1.34
29
0
0
0
0
8.24
8.43
−0.19
30
0
0
0
0
8.89
8.43
0.46
31
0
0
0
0
8.30
8.43
−0.13
Term
Coeff
SE Coeff
T
P-Value
Constant
8.42488
0.1364
61.783
0.000
X1
4.27556
0.1083
39.462
0.000
X2
0.76722
0.1083
7.081
0.000
X3
−0.13667
0.1083
−1.261
0.225
X4
0.22833
0.1083
2.107
0.051
X12
1.75443
0.2853
6.148
0.000
X22
0.32943
0.2853
1.154
0.265
X32
−0.58557
0.2853
−2.052
0.057
X42
−0.26057
0.2853
−0.913
0.375
X1 X2
0.04875
0.1149
0.424
0.677
X1 X3
0.42250
0.1149
3.676
0.002
X1 X4
0.12000
0.1149
1.044
0.312
X2 X3
0.60000
0.1149
5.221
0.000
X2 X4
0.33000
0.1149
2.872
0.011
X3 X4
0.17625
0.1149
1.534
0.145
Source
DF
Seq SS
Adj SS
Adj MS
F
P
Regression
14
367.735
367.735
26.2668
124.31
0.000
Linear
4
340.917
340.917
85.2292
403.35
0.000
Square
4
15.694
15.694
3.9236
18.57
0.000
Interaction
6
11.124
11.124
1.8540
8.77
0.000
Residual Error
16
3.381
3.381
0.2113
Lack-of-Fit
10
1.641
1.641
0.1641
0.57
0.797
Pure Error
6
1.740
1.740
0.2901
Total
30
371.116
As shown in Table 3 & 4 the prediction model was statistically significant, F = 124.31, p < 0.001, (R2 = 0.99, Adjusted R2 = 0.98), confirming the adequacy of the model fits (Nampoothiri and Pandey, 1996; Vining, 1999). The significance of each term was determined by p-value, as seen in this table the terms X1, X2, X12, X1 X3, X2 X3, and X2X4 were significant with p-values (p < 0.05). The other term coefficients were not significant (p > 0.05).
Term
Coeff
Se Coef
T
P
Constant
8.42488
0.1364
61.783
0.000
X1
4.27556
0.1083
39.462
0.000
X2
0.76722
0.1083
7.081
0.000
X3
−0.13667
0.1083
−1.261
0.225
X4
0.22833
0.1083
2.107
0.051
R2 = 99.61%
R2(adj) = 98.56%
The surface plot representing the interaction of glucose and urea shown in Fig. 1a. The 3D response plot clearly indicates that the l-GA productivity and growth of culture were increased with a higher concentration of glucose and urea in the fermentation medium. The yield of l-GA is observed to be higher at the glucose concentration 45–50 g/L. Likewise, the study reported the l-GA production using Micrococcus glutamicus and Pseudomonas reptilivora is highly influenced by the ratio of glucose and urea concentration in the fermentation medium and the optimal levels of medium components were: 61.5575 kg/m3 glucose, 7.3272 kg/m3 urea and 1.783 lg/dm3 biotin (Sunitha et al., 1998). Similar, findings documented the importance of glucose and urea in the media constituents for the maximum production of l-GA are reported elsewhere (Joseph and Rao, 1973; Kumar et al., 2013; Nampoothiri and Pandey, 1998; Shyamkumar et al., 2014). Similarly, the inoculum size also found to be a significant factor for glutamic acid synthesis. The inoculum size increases simultaneously growth and production also increased. As shown in Fig. 1c, the productivity is increased initially but the ratio of salt and urea increased, the production is gradually decreased. Fig. 1d demonstrates effect of glucose and salt concentration on GA production. From this figure, it is reveled that the concentration of glucose and salt increased with an appreciable growth and production of GA. Urea and salt concentration also facilitated the productivity up to some level and evenly the productivity decreased in later stages (Fig. 1e). Fig. 1f showed no considerable variation in GA synthesis noted with higher concentrations of inoculum. Thus, the interaction among inoculum size and substrate concentration as well as salt urea influence the production of GA. Inoculum is a significant factor for the fermentation process (Perego et al., 2003). Reportedly the physiology of microorganisms in the various inoculum sizes can affect the production (Parton and Willis, 1990). This revealed that inoculum size does not give a limitless influence on the fermentation. Depending on the different microorganisms and fermentation units being used the optimum values being appeared (Reddy et al., 2008).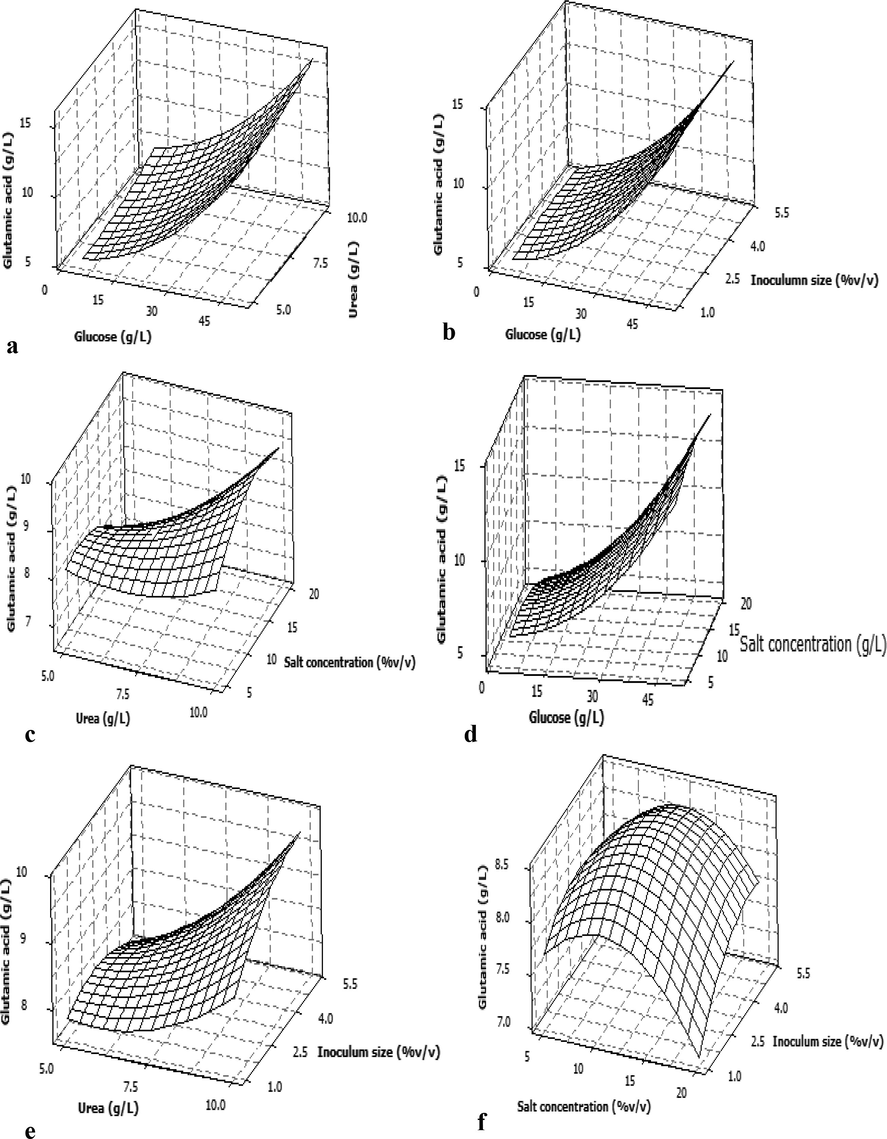
Three-dimensional response surface plot showing interaction effects of the selected fermentation factors on GA production by C. glutamicum (a) glucose vs urea, (b) glucose vs inoculum size, (c) urea vs salt solution, (d) glucose vs salt solution, (e) urea vs inoculum size and (f) salt solution vs inoculum size. In the all above figures, only two factors mentioned on x and y axes were varied and other two factors were kept at its center level.
3.2 Validation of the model
As per the statistical and regression model equation, it has been confirmed as glucose 50 g/L, urea 20 g/L, salt solution 19.24% (v/v) and inoculum size, 5% (v/v). In these optimized states, the predicted response for glutamic acid synthesis was observed as 16.4996 g/L, and the detected experimental value (based on the repeated experiments conducted at the optimum levels of each variables) was found to be 16.36 g/L. These results corroborated that the validity of the predicted values by the statistical model and the experimental values were quite close.
4 Conclusion
In this study, one factor at a time approach was used to choose the significant carbon and nitrogen sources for the maximum production of l-GA using C. glutamicum. Further, the statistical approach as RSM was used to study the effect of process parameters and their optimised conditions for the maximum l-GA production. The optimised condition that yield maximum l-GA production was observed as 16.36 g/L. Thus the statistical tools (FCCCD) provides the maximum information needed with short number of experimental runs in less time could economically support the production industry in fermentation processes. However, this approach gains to produce a maximum yield of GA in the production of large-scale industries.
Acknowledgment
The authors extend their sincere appreciations to the Researchers Supporting Project number (RSP-2019/70), King Saud University, Riyadh, Saudi Arabia.
Declaration of Competing Interest
The authors declare that they have no known competing financial interests or personal relationships that could have appeared to influence the work reported in this paper.
References
- Production of l-glutamic acid by immobilized cell reactor of the bacterium Corynebacterium glutamicum entrapped into carrageenan gel beads. World Appl. Sci. J.. 2007;2:62-67.
- [Google Scholar]
- The monosodium glutamate story: the commercial production of MSG and other amino acids. J. Chem. Educ.. 2004;81:347.
- [Google Scholar]
- Fermentation and recovery of glutamic acid from palm waste hydrolysate by ion-exchange resin column. Biotechnol. Bioeng.. 1995;48:551-555.
- [Google Scholar]
- Industrial production of amino acids by coryneform bacteria. J. Biotechnol.. 2003;104:155-172.
- [Google Scholar]
- Glutamic acid fermentation: discovery of glutamic acid-producing microorganisms, analysis of the production mechanism, metabolic engineering, and industrial production process. Ind. Biotechnol. Prod. Process. 2017:339-360.
- [Google Scholar]
- Ikeda, K., 1908. Inventor and assignee. A Prod. method Seas. Mainly consists salt L-glutamic acid. Japanese Pat. 14805.
- Glutamic acid fermentation employing starchy tubers as raw material. J. Food Sci. Technol.. 1973;10:160-164.
- [Google Scholar]
- Optimisation of glutamic acid production from cassava starch factory residues using Brevibacterium divaricatum. Process Biochem.. 2005;40:3576-3579.
- [Google Scholar]
- Studies on the amino acid fermentation. Part 1. Production of l-glutamic acid by various microorganisms. J. Gen. Appl. Microbiol.. 2004;50:331-343.
- [Google Scholar]
- Modeling and optimization of glutamic acid production using mixed culture of Corynebacterium glutamicum NCIM2168 and Pseudomonas reptilivora NCIM2598. Prep. Biochem. Biotech.. 2013;43:668-681.
- [Google Scholar]
- Solid state fermentation for l-glutamic acid production using Brevibacterium sp. Biotechnol. Lett.. 1996;18:199-204.
- [Google Scholar]
- Immobilization of Brevibacterium cells for the production of l-glutamic acid. Bioresour. Technol.. 1998;63:101-106.
- [Google Scholar]
- Parton, C., Willis, P., 1990. Strain preservation, inoculum preparation and development. McNeil, B.; Harvey, LM Ferment. a Prat. Approach. IRL Press. Oxford, UK, pp. 39–64.
- Effects of temperature, inoculum size and starch hydrolyzate concentration on butanediol production by Bacillus licheniformis. Bioresour. Technol.. 2003;89:125-131.
- [Google Scholar]
- Optimization of alkaline protease production by batch culture of Bacillus sp. RKY3 through Plackett-Burman and response surface methodological approaches. Bioresour. Technol.. 2008;99:2242-2249.
- [CrossRef] [Google Scholar]
- Application of statistical experimental methods to optimize production of poly (γ-glutamic acid) by Bacillus licheniformis CCRC 12826. Enzyme Microb. Technol.. 2002;31:213-220.
- [Google Scholar]
- Production of glutamate and glutamate-related amino acids: molecular mechanism analysis and metabolic engineering. In: Amino Acid Biosynthesis∼ Pathways, Regulation and Metabolic Engineering. Springer; 2006. p. :1-38.
- [Google Scholar]
- Production of l-glutamic acid with Corynebacterium glutamicum (NCIM 2168) and Pseudomonas reptilivora (NCIM 2598): a study on immobilization and reusability. Avicenna J. Med. Biotechnol.. 2014;6:163.
- [Google Scholar]
- Spies, J.R., 1957. [76] Colorimetric procedures for amino acids.
- Optimization of medium constituents and fermentation conditions for the production of l-glutamic acid by the coimmobilized whole cells of Micrococcus glutamicus and Pseudomonas reptilivora. Bioprocess. Eng.. 1998;18:353-359.
- [Google Scholar]
- Optimization of Corynebacterium glutamicum glutamic acid production by response surface methodology. Food Bioprocess Technol.. 2012;5:92-99.
- [Google Scholar]
- Statistical Process Monitoring and Optimization. CRC Press; 1999.
- A glutamic acid-producing lactic acid bacteria isolated from Malaysian fermented foods. Int. J. Mol. Sci.. 2012;13:5482-5497.
- [Google Scholar]


