

Translate this page into:
Optimization of carbofuran insecticide degradation by Enterobacter sp. using response surface methodology (RSM)
⁎Coresponding author. mala_upm@upm.edu.my (Normala Halimoon)
-
Received: ,
Accepted: ,
This article was originally published by Elsevier and was migrated to Scientific Scholar after the change of Publisher.
Peer review under responsibility of King Saud University.
Abstract
Response surface methodology and Plackett-Burman experiments were applied to optimize the biodegradation of carbofuran by using Enterobacter sp. stain BRC05 isolated from selected agricultural areas in peninsular Malaysia. The significant factors influencing the degradation of carbofuran were assessed using two-level Plackett–Burman Design (PBD) with five variables. Plakett Burman experiment showed that the following four variables were significant for carbofuran degradation including, carbofuran concentration, temperature, pH and nitrogen sources. Significant variables obtained in Plackett-Burman Design were further optimize using Central Composite Design (CCD). The outcome of the design for carbofuran degradation for each runs of the PBD experiment base on the design matrix, showed that the minimum and the maximum carbofuran degradation percentage were found to be 6.7% and 79.77% as presented in runs 4 and 1, respectively. Results obtained using Central Composite Design showed that the relations between the factors affect carbofuran degradation with significant response. The predicted results in CCD indicated that highest carbofuran degradation of 95.40% could be realized with carbofuran concentration of 92.50 mg/L, pH of 6.0, temperature 27.50 °C, nitrogen sources of 0.45 g/L and reaction period of 6 days. The predicted values were in agreement with the actual values with coefficient of determination with R2 0.9719. Partial 16S rRNA sequence analysis showed that the carbofuran degrading isolate was closely related to members of the genera Enterobacter sp. The morphological and biochemical characteristics of the isolate also confirmed the phylogenetic signature. This study would provide an effective approach that could be beneficial for the bioremediation of carbofuran insecticide in polluted environment.
Keywords
Biodegradation
Carbofuran
Response surface methodology
Enterobacter sp.

1 Introduction
Carbofuran (2,3-dihydro-2,2-dimethylbenzofuran-7-yl-methylcarbamate), a broad-spectrum carbamate insecticide (Mansano et al., 2018). The insecticide has been used widely by farmers to regulate many of insect pests of crops such as, tomatoes, corn, cabbages, potatoes and straw berries (Clasen et al., 2014). Carbofuran insecticide is harmful to the environment as well as human health (Begum and Vijayaraghavan, 2001; Fu et al., 2019). The carbofuran mechanism of action is mostly via reversible inhibition of acetyl cholinesterase enzyme (AChE) and subsequent endocrine disruption (Jemutai-Kimosop et al., 2014; Sakunthala Tennakoon et al., 2013).
The toxicity of the insecticide extends from human beings to both aquatic and terrestrial organisms with high sensitivity in fish and earthworms (WHO, 2010). Recently, more consciousness has been created on the negative effects of pesticides residues as well as the possibility of ground and surface waters pollution (Chin-Pampillo et al., 2015b). The high occurrence of carbofuran pollution, along with growing concern about the toxic effect of the compound, has prompted scientists to search for degradation alternatives for carbofuran contamination (Arraez-Roman et al., 2004; Devi and Iyer, 2017; Seo et al., 2007).
It has been known for several years that microbes are able to degrade pesticides and use them as source of energy for growth and metabolic activity (Chin-Pampillo et al., 2015a; Mohanta et al., 2012). Biodegradation of carbofuran by microorganisms is of particular interest since the conventional approaches used for mitigating the environment from this toxic compound are less effective, more cumbersome and costly (Yan et al., 2007). Several carbofuran degrading microorganisms have been isolated and characterized. Including strain of Pseudomonas, Achromobacter, Sphingomonas, Novosphingobium and Rhodococcus (Goncalves et al., 2006; Bano and Musarrat, 2004, Devi and Iyer, 2017; Karpouzas et al., 2000; Yan et al., 2007).
However, the literature on biodegradation efficiency of these bacteria in terms of complete removal of the compound are not enough in most cases (Xu et al., 2006; Yan et al., 2007). It is critical to isolate new bacterium which has much higher carbofuran degradation efficiency (Gongora-Echeverria et al., 2018). The toxic compounds degradation capacity of microbes is strongly affected by different factors such as nutrients and physicochemical conditions (Dzantor and Felsot, 1990; Park et al., 2006). Biodegradation using microorganisms depends not only on the availability of degradative microbes with suitable degradative enzymes, but also on a varied degree of environmental factors (Felsot et al., 1981; Tien et al., 2017). Optimizing those factors may increase the degradation capacity of the microbes. statistical models such as RSM, Plackett-Burman designs (PBD) and Central Composite design (CCD) can be used to optimize these parameters (Xia et al., 2012). In this study, a new carbofuran degrading bacteria was isolated from the agricultural soil polluted with the pesticide. The significant parameters influencing carbofuran biodegradation were identified, while the optimum levels of those variables for enhancing the carbofuran degradation by the bacteria was evaluated using Statistical models (Haddad et al., 2014; Popa Ungureanu et al., 2015).
2 Methodology
2.1 Chemicals and reagents
analytical standard Carbofuran PESTANAL@ 99% was purchased from Sigma Aldrich USA. High-performance liquid chromatography (HPLC) grade acetonitrile was purchased from Merch (Germany). All other chemicals and media ingredients used were of highest analytical grade are either from Merch (Germany), Sigma (India) or Fisher Scientific (Singapore).
2.2 Characterization of carbofuran degrading isolate
The bacteria were isolated in soil samples collected from different agricultural farms in peninsular Malaysia and used as initial inoculants for enrichment. Extraction of bacteria from the soil samples was done using serial dilution method as described by Collins and Lyne with little changes. One gram of each soil sample was suspended in 10 mL sterile medium (MSM). The MSM contained in g/L (Na2HPO4·12H2O 6.5, KH2PO4 0.9, FeSO4·7H2O 0.01, MgSO4·7H2O 0.15 and 2 mL of trace element solution) supplemented with initial 5 mg/L of carbofuran as source of carbon (Collins et al., 1989). Other dilutions were prepared until a dilution of 10−10 was achieved. To ensure maximum extraction of the bacteria, the dilutions were agitated carefully. While for liquid culture experiments, 0.2 mL aliquots of appropriate dilutions of the soil samples were inoculated into MSM flask supplemented with 50 mg/L carbofuran and incubated at 32 °C agitated for 14 days in a shaker incubator at 150 rpm. The experiment was done in aseptic conditions in triplicate. Flask having the same inoculum without addition of carbofuran insecticide serves as control experiment. Using the spread plate as well as pour plates techniques, 0.2 mL aliquot of the incubated culture was pour in agar plates containing 50 mg/l carbofuran insecticide (Chaudhry and Ali, 1988). Using a sterile wire loop the bacterial colonies in the plates were then streaked into nutrient agar plates supplemented with 50 mg/l of carbofuran and incubated at 32 °C for two days. Sub-culturing was done every two weeks on carbofuran containing agar plates until pure colonies were obtained. Isolated single colonies differing in morphological features were then re-suspended in MSM and used for further studies.
2.3 Growth analysis of bacterial culture
Fresh grown culture of Enterobacter sp. was aseptically inoculated into ten ml of nutrient broth (NB) and incubated using shaker incubator at 140 rpm at 37 °C until the growth of 0.8–09 OD600nm reached. The bacterial cell was then incubated for 24 h at 37 °C using shaker incubator at 150 rpm. The liquid culture was centrifuged at 10,000x g rpm for 10 min. (Chin-Pampillo et al., 2015a). The supernatant was carefully filtered and used for further studies (Ibrahim et al., 2015).
2.4 Optimization using response surface methodology (RSM)
Response surface methodology (RSM), which comprises regression analysis and factorial design, aids in measuring the significant parameters, in order to study the relations among the factors as well as choosing the optimal conditions of factors or appropriate responses (Ibrahim et al., 2015). In this study, two steps of optimization of carbofuran degrading strain were conducted by response surface methodology RSM (Ramasamy et al., 2017). Initial stage of the optimization was performed using Plackett–Burman Design (PBD) while, significant variables obtain were optimized further using central composite design (CCD) (Li et al., 2011). All tests were conducted in triplicate. (Chen et al., 2011). The percentage of carbofuran degradation was taken as the response (Rajendran et al., 2014). The correlation of the independent variables and that of the response were outline using the second order polynomial model that suits the response factors (El-Naggar Nel and Abdelwahed, 2014). The general formula for the second degree model applied is as follows:
In which the factor Y represent the response predicted while β0, β1, β2, β3, β4, β11, β22, β33, β44, β12, β13, β23, β24, β14 and β34 are the regression coefficients of the model and is constant while β0 represent the intercept, β1, β2, β3, β4 and β11, β22, β33 and β44 represent the linear as well as squared coefficients. While, X1, X2, X3 and X4 represent the independent factors. Factors combination (X1, X2) display the interface between the variables (Xia et al., 2012).
The factors that shows significant in Plackett Burman were further optimized by applying the CDD model (Yadav et al., 2015). The response design and the analysis of data was carried out with Design Expert software version 6.0.8 (See Table 1).
Parameters
Designation
Units
−1 (Low Actual)
+1(High Actual)
A
Carbofuran
Mg/L
5
200
B
Carbon S.
g/L
1
9
C
Nitrogen S.
g/L
0.1
0.8
D
Temperature
°C
15
40
E
pH
–
4
8
2.5 Statistical analysis
All the experiments were conducted in triplicate. Degradation studies were conducted using HPLC. All the data were statistically analyzed using Graph Pad v3.5. One-way ANOVA analysis of variance using the Tukey’s test was carried out and p < 0.05 was considered statistically significant.
3 Results and discussions
Samples from different carbofuran polluted sites were collected and the enrichment technique using Mineral salts medium (MSM). In g/L (KH2PO4 0.9, Na2HPO4·12H2O 6.5, MgSO4·7H2O 0.15, FeSO4·7H2O 0.02 and 2 mL of trace element solution). Morphologically distinct bacterial isolate was isolated. Growth of isolates was also monitored against variation in carbofuran concentration through change in cell biomass (OD600). The bacterial strain has the capacity to grow on carbofuran media as carbon/nitrogen source and the strain was designated as BRC05. The bacterium was gram-negative motile, aerobic and was positive for oxidase, catalase and citrate. Its colony was milky-white. and can oxidize glucose with the production and maintenance of high concentration of acids as end products. The 16S rRNA gene sequence and phylogenetic analysis of the carbofuran degrader show resemblance to members of Enterobacter sp Figures 1 and 2). The strain morphological and biochemical characteristics also confirmed the phylogenetic signature. The ability of the isolates to utilize carbofuran as source of carbon was evaluated using HPLC and the reduction in the concentration of carbofuran was estimated against carbofuran standard curve (Tien et al., 2017). Pesticide biodegradation by bacteria has been reported by many researchers in various environments (Chin-Pampillo et al., 2015c; Khatun et al., 2018). Including soils, sediments, water bodies and sewage sludge and the capability of local carbofuran degrading bacteria were also reported (Devi and Iyer, 2017; Mohanta et al., 2012). These includes strains, such as Achromobacter sp., Sphingomonas sp., Flavobacterium, Paracoccus sp., Novosphingobium sp. and Alcaligenes faecalis, among other (Bano and Musarrat, 2004; Devi and Iyer, 2017; Park et al., 2006; Yan et al., 2007). Bacteria use carbofuran through the hydrolysis of labile methylcarbamine linkage and producing carbofuran-7-phenol and methylamine as metabolites (Yan et al., 2007). Sphingomonas sp. strain SB5 was capable of degrading carbofuran to a number of metabolites including 2-hydroxy-3-(3-methylpropan-2-ol) phenol and some red intermediates (Park et al., 2006).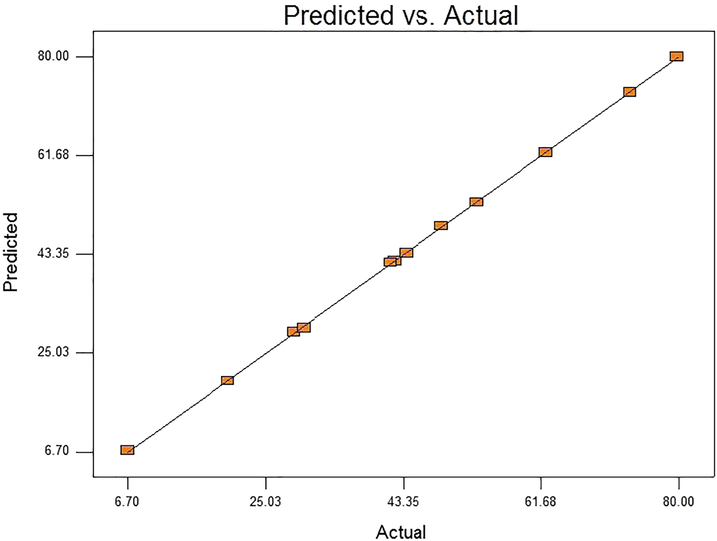
Relationship plot showing interaction between predicted and the actual values of carbofuran content in Plackett–Burman.
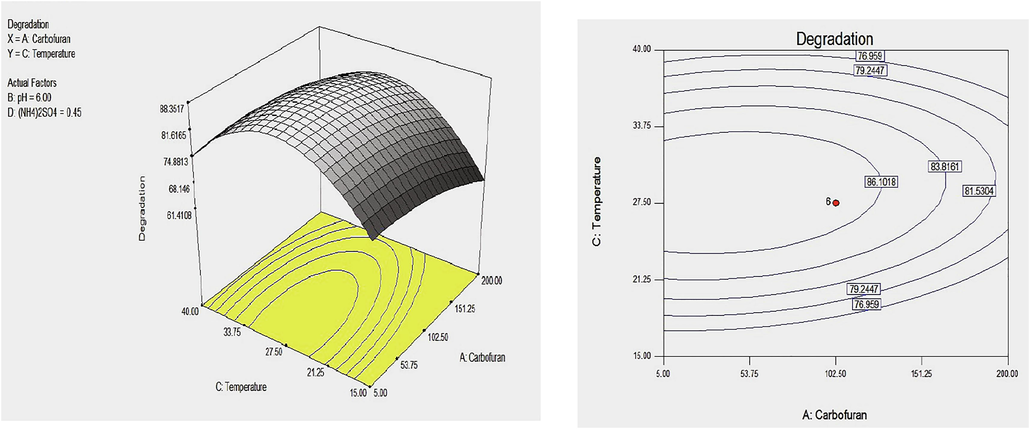
Model plot displaying 3D and 2D contour plotting for the effect of carbofuran and temperature on the degradation of carbofuran. by Enterobacter sp. Strain BRC05.
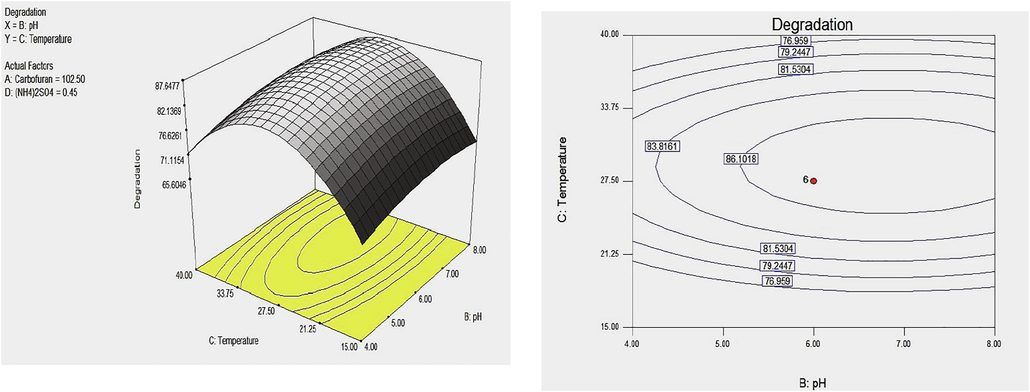
Represent the model plot displaying 3D and 2D contour plotting for the effect of pH and temperature on carbofuran degradation by Enterobacter sp. Strain BRC05. Value of factor carbofuran concentration as well as nitrogen source (NH4Cl) was fixed at central point.
3.1 Plackett–Burman experiment
Enterobacter strain BRC05 is being optimized by applying response surface model to examine the best state for its capacity to degrade carbofuran. A total of 12 experimental designs were prepared by applying Placket-Burman design (PBD), comprising five independent parameters namely (A) carbofuran concentration, (B) pH, (C) temperature, (D) carbon source (glucose) and (E) nitrogen source (NH4CI). The higher and lower values of independent factors were selected according to previous literature. As shown in Table 2.
Factor 1
Factor 2
Factor 3
Factor 4
Factor 5
Run
A
B
C
D
E
1
200.00
8.00
15.00
9.00
0.80
2
5.00
4.00
40.00
9.00
0.80
3
200.00
4.00
40.00
9.00
0.10
4
5.00
4.00
15.00
1.00
0.10
5
5.00
4.00
15.00
9.00
0.80
6
5.00
8.00
15.00
1.00
0.10
7
5.00
8.00
40.00
1.00
0.80
8
200.00
8.00
40.00
1.00
0.80
9
200.00
4.00
15.00
1.00
0.80
11
5.00
8.00
40.00
9.00
0.10
12
200.00
4.00
40.00
1.00
0.10
The PBD use the minimum number of runs to rapidly detect the variables with a significant effect on the response. Plackett-Burman design (PBD) deliver fast and efficient approach in identifying significant variables among greater amount of factors, thus, saves time and sustain extensive facts on each parameter. In Placket-Burman experiment, the main effects contain a complicated interaction with two factors associations (Yang et al., 2016). Therefore, the PBD is applied when studying major effects if the two way interactions are insignificant (Mirizadeh et al., 2014). Practically, PBD and fractional factorial designs were frequently applied to select significant variables that affect the process output measures or product quality (Sharma et al., 2009; Ibrahim et al., 2015; Ravanipour et al., 2015).
Experimental variables that affect carbofuran degradation are the temperature, pH, carbofuran concentration, carbon and nitrogen sources. The minimum and maximum values of the independent factors were chosen based on previous research (Khazaei et al., 2016; Kundu et al., 2016).
Placket-Burman experiment confirms the result of the significant factors runs, which shows that among the variables used, carbon source concentration was insignificant factor for carbofuran degradation using isolate BRC05 an Enterobacter specie with p-value remained greater than 0.05. This might be due to the fact that the bacteria already using carbofuran as source of carbon instead of the additional source (glucose). While the remaining four factors, i.e. Nitrogen source (Ammonium sulphate), pH, initial carbofuran concentration and Temperature were found to be significant with p-values < 0.05. The model coefficient of determination (R2) was 0.999 which may perhaps explain up to 99.9 percent of the response randomness. The Adjusted and the Predicted R-squared values were found to be 0.9987 and 0.9651 respectively, showing the existence of higher correlation between the actual and predicted values (See Tables 3 and 4).
Run
Factor 1 A
Factor 2B
Factor 3C
Factor 4 D
Factor 5 E
Response (%)
1
200.00
8.00
15.00
9.00
0.80
79.77
2
5.00
4.00
40.00
9.00
0.80
73.46
3
200.00
4.00
40.00
9.00
0.10
20
4
5.00
4.00
15.00
1.00
0.10
6.7
5
5.00
4.00
15.00
9.00
0.80
41.6
6
5.00
8.00
15.00
1.00
0.10
43.7
7
5.00
8.00
40.00
1.00
0.80
62.32
8
200.00
8.00
40.00
1.00
0.80
28.7
9
200.00
4.00
15.00
1.00
0.80
30.1
10
200.00
8.00
15.00
9.00
0.10
42.2
11
5.00
8.00
40.00
9.00
0.10
53.1
12
200.00
4.00
40.00
1.00
0.10
48.38
Source
Sum of squares
DF
Mean square
F value
Prob > F
Model
4987.77
10
498.78
879.66
0.0262
Significant
A
1378.94
1
1378.94
2431.95
0.0129
6
961.57
1
961.57
1695.86
0.0155
C
167.07
1
167.07
294.65
0.0370
D
23.69
1
23.69
41.78
0.0977
E
2053.37
1
2053.37
3621.41
0.0106
AD
22.78
1
22.78
40.18
0.0996
AE
126.78
1
126.78
223.60
0.0425
BC
1844.30
1
1844.30
3252.68
0.0112
BD
700.59
1
700.59
1235.59
0.0181
CE
250.59
1
250.59
441.94
0.0303
Residual
0.57
1
0.57
Cor Total
4988.34
11
3.2 Analysis using Central Composite design (CCD)
The optimum levels of the significant variables and the relations of these factors on the degradation of carbofuran were examined. Four significant variables achieved using Plackett–Burman design, were all experimented by central composite design. The levels selected for the variables were fixed according to previous studies (Ibrahim et al., 2015). The matrix for the Central Composite Design showing actual and predicted values results is displayed in Table 5. CCD response were utilized to generate response surfaces as well as 2D and 3D contours so as to show the effects of these variables on cabofuran degradation. Response Surface Methodology-CCD assists in understanding how individual factors interact with each other (Roriz et al., 2009).
Experimental values
Predicted values
Run
A: Carbofuran
B: pH
C: Temp.
D:(NH4)2SO4
1
5.00
4.00
15.00
0.80
75.00
76.27
2
102.50
2.00
27.50
0.45
68.00
62.48
3
102.50
6.00
27.50
1.15
72.00
70.74
4
102.50
6.00
52.50
0.45
63.00
63.36
5
200.00
8.00
40.00
0.10
75.00
76.87
6
5.00
8.00
40.00
0.80
68.00
69.92
7
102.50
6.00
27.50
−0.25
71.00
71.68
8
200.00
8.00
15.00
0.80
71.00
71.15
9
200.00
8.00
15.00
0.10
68.50
66.16
10
102.50
6.00
27.50
0.45
50.00
51.78
11
200.00
4.00
15.00
0.10
72.00
72.54
12
102.50
10.00
27.50
0.45
68.64
64.56
13
200.00
4.00
40.00
0.80
68.50
70.60
14
102.50
6.00
27.50
0.45
64.00
63.06
15
5.00
8.00
15.00
0.80
74.00
77.32
16
5.00
8.00
40.00
0.10
75.00
76.20
17
102.50
6.00
27.50
0.45
86.00
83.04
18
5.00
4.00
40.00
0.10
65.43
68.12
19
102.50
6.00
27.50
0.45
74.00
74.06
20
297.50
6.00
27.50
0.45
82.00
81.67
21
102.50
6.00
27.50
0.45
19.00
23.75
22
5.00
8.00
15.00
0.10
41.00
35.98
23
92.50
6.00
27.50
0.45
95.00
95.40
24
5.00
4.00
40.00
0.80
91.00
90.34
25
102.50
6.00
27.50
0.45
87.00
87.09
26
5.00
4.00
15.00
0.10
82.00
87.09
27
102.50
6.00
2.50
0.45
88.54
87.09
28
200.00
8.00
40.00
0.80
91.00
87.09
29
200.00
4.00
40.00
0.10
85.00
87.09
30
200.00
4.00
15.00
0.80
89.00
87.09
The outcomes of the analysis acquired from the CCD analysis were fitted in second order polynomial equation so as to define the carbofuran degradation dependence. The effects and interaction of independent variables were presented and also their response were predicted. 30 run experiments performed base on response surface methodology while the response (%) were shown as predicted and actual values. The lowest and highest carbofuran degradation percent were (95.00%) and (19%) respectively Table 5.
Analysis such as F-value, R-squared value and lack of fit were calculated so as to estimate the model. Analysis of variance (ANOVA) of the model shows that the model is highly significant, as it is evident from the F test with quite low probability value (<0.0001). Non significance of the lack of fit with a probability value greater than 0.1 is essential. The lack of fit test assesses the model failure to represent data in the experimental domain at points, which are not included in the regression. Therefore, the test is expected to be non-significant to signify the model (Ahmad et al., 2018). In this study, the non-significant value of lack of fit (F value 0.35) shows that the quadratic model is statistically significant for the response, and hence, it can be used for further analysis. (Mohajeri et al., 2010) reported that when the lack of fit is insignificant then the model is a good fit. Also, (Ibrahim et al., 2015) stated that if lack of fit is significant in a model, the model is weak to be used to predict the response. The lack of fit test indicates whether the chosen statistical model is adequate to define the observed data. The outcome of the response surface model indicates that A, B, C, A2, B2, C2, BD were found to be the significant model terms (See Table 6).
Source
Sum of Squares
DF
Square
Mean Value
F Prob > F
Model
6937.11
14
495.51
37.05
<0.0001
significant
A
333.76
1
333.76
24.96
0.0002
B
86.79
1
86.79
6.49
0.0223
C
224.24
1
224.24
16.77
0.0010
D
38.41
1
38.41
2.87
0.1108
A2
227.08
1
227.08
16.98
0.0009
B2
145.86
1
145.86
10.91
0.0048
C2
5613.61
1
5613.61
419.77
<0.0001
D2
57.19
1
57.19
4.28
0.0563
AB
41.09
1
41.09
3.07
0.1000
AC
46.79
1
46.79
3.50
0.0811
AD
0.35
1
0.35
0.026
0.8740
BC
0.12
1
0.12
8.644E-003 0.9272
BD
141.85
1
141.85
10.61
0.0053
CD
14.75
1
14.75
1.10
0.3103
Residual
200.60
15
13.37
Lack of Fit
149.27
10
14.93
1.45
0.3561
Not significant
Pure Error
51.32
5
10.26
Cor Total
7137.71
29
Std. Dev.
3.66
R-Squared
0.9719
Mean
72.65
Adj R-Squared
0.9457
C.V.
5.03
Pred R-Squared
0.9262
PRESS
933.72
Adeq Precision
27.706
The determination coefficients, R-squared and the adjusted R-squared value of the response model were 0.9719 and 0.9457 respectively, which signify that the correlation that exist between the predicted and actual values are very high. Also, the predicted R-squared was 0.9292 which is in agreement with the actual adjusted R-squared. Thus, this shows that the regression model offers an outstanding justification of the bond between the independent variables as well as the response. Adeq Precision calculate the signal to noise ratio in which a ratio of greater than 4 is desirable. In this study the ratio of 27.706 indicates an adequate signal. Indicating that the model can be used to navigate the design space. The coefficient of variation (CV) at minimum value is 5.03% showing that the model was accurate and reliable. The model’s coefficient and their significances assessed using multiples linear regression for carbofuran degradation period. Analysis using multiple regression analysis by ignoring the values that are non-significant, shows the equation below as the basic quadratic model.
in which Y represent response value (%), while (A, B C, and D) represent the coded levels of carbofuran concentration, nitrogen source, pH and temperature respectively (See Fig. 3).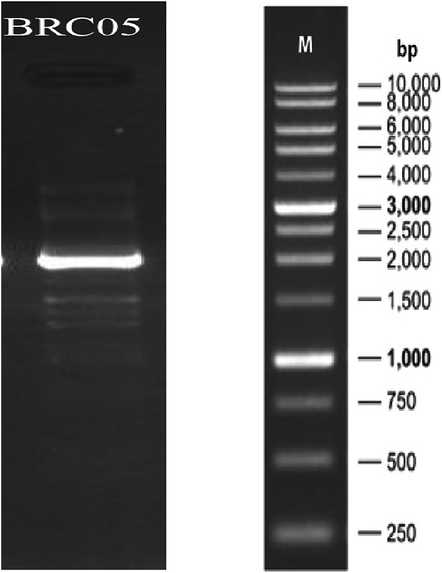
Agarose gel electrophoresis of PCR product of 16S rRNA gene of strain BRC05.
The 2D and 3D contour plot signify graphical illustration of regression equation. It is aimed to know the interaction of parameters and trace the best level of each factor for maximum response (Li et al., 2011). Each plotted contour graph for carbofuran degradation indicates different collections of two test variables at a particular time, and retaining the other parameters at constant level (Ibrahim et al., 2015). The curved response surfaces indicate that there are distinct optimal parameters. If the surfaces are rather flat and symmetrical near the optimum, the optimized values may not vary widely from single parameter conditions (Kundu et al., 2016).
3.3 Interaction among factors
The model contour plots were presented to provide information on the response surface variables according to the second-order model through keeping two parameters to remain constant at zero and changing the last two parameters over the experimental range (Fig. 4). The interfaces between any of the two factors revealed that the values near the center point were best interacted. The shape of the contour plots revealed the interactive effects among the factors (See Figures 2A and 2B).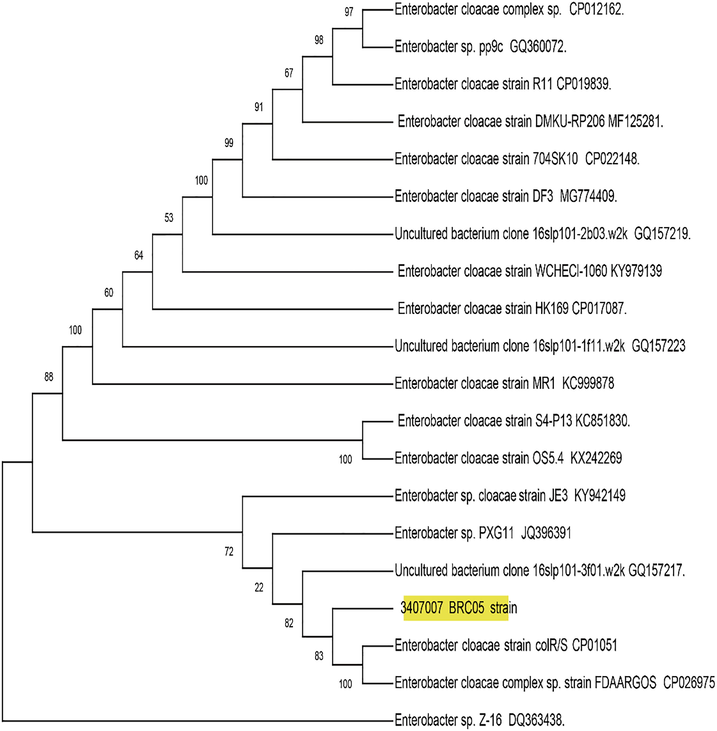
Phylogenetic relationship using Neigbour-joining method cladogram showing relation between Enterobacter cloacae strain BRC05 and other related strains based on the 16S rRNA gene sequence analysis.
Circular pattern specified an insignificant interaction while an elongated response surface plot designated that the relationship between the subsequent variables were significant (Arasu et al., 2019; Xia et al., 2012). The nature of a contour plot specified weather the common interaction among the independent variables were significant or not (Ahsan et al., 2017). The response surface for the degradation of carbofuran by enterobacter sp. showed a clear peak, meaning the optimal point was inside the design boundary level as Illustrated in Figs. 2A and 2B.
Interactive effect of temperature and initial carbofuran concentration on the degradation of carbofuran by Enterobacter sp. was shown in Fig. 2A. It was observed that carbofuran removal ability increased at optimum conditions of temperature or initial carbofuran concentration and degradation rate reduced with a further increase with the temperature or initial carbofuran concentration. Also, the interaction between temperature and pH value was presented in Fig. 2B. The elliptical plot showed that the degradation ability of carbofuran was greatly affected by the change in pH or temperature. The decline in carbofuran was increased with increasing temperature. After the optimum temperature, the biodegradation ability decrease as the temperature was further increased (See Fig. 5).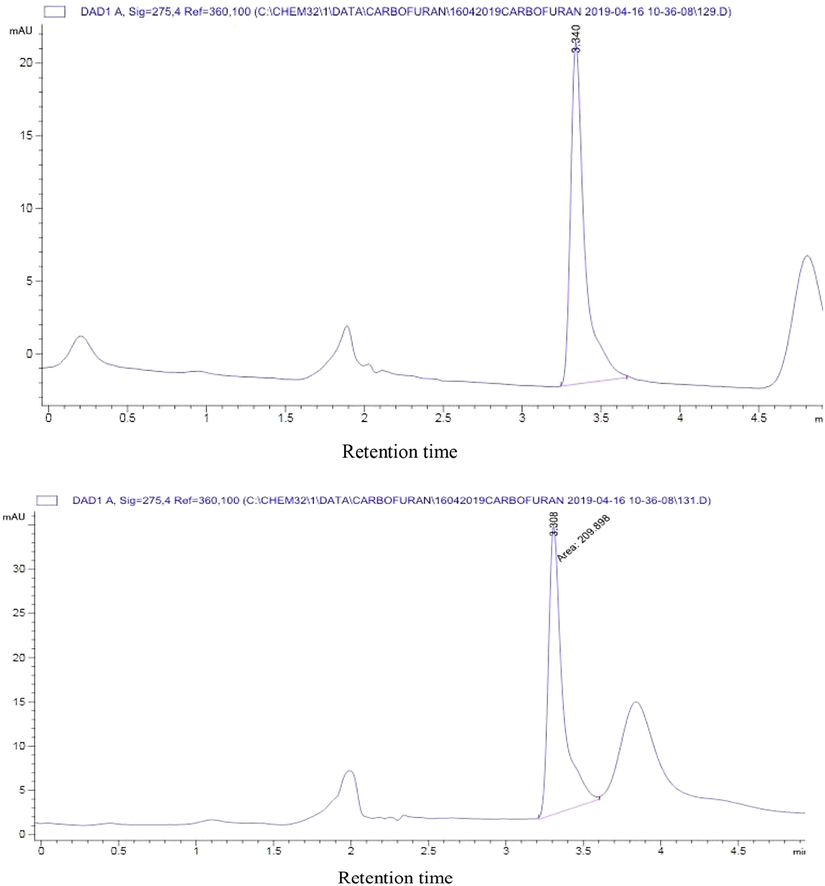
Some Chromatographic profiles for biodegradation of carbofuran showing the carbofuran peak and its metabolites at various days of incubation.
4 Conclusion
Highly effective carbofuran-degrading Enterobacter sp. strain BRC05, was isolated from agricultural soil using enrichment method. A powerful method of optimization using response surface methodology was applied to define the effects of four variable factors. (pH, nitrogen source, temperature and initial carbofuran concentration) as well as their interaction on carbofuran degradation. Carbofuran degradation efficiency could be maximized up to 95% degradation under the following conditions: carbofuran concentration 92.50 mg/L, temperature of 27.50 °C, pH of 6 and nitrogen source 0.45. The similarity between the predicted and the experiential results has confirmed the validity and applicability of RSM-CCD model in the optimization processes. The results obtained recommend that statistical optimization approach is an efficient means to predict the biodegrading activity of pesticides. The newly isolated Enterobacter sp. BRC05 will be potentially beneficial in substantial application for carbofuran bioremediation and remediation of other pesticide polluted soils.
Acknowledgements
The research was supported by Putra-IPS fund with grant number UPM/800/3/3/1/GP-IPS/2018/9636200. The authors also thank Faculti of Environmental Studies Universiti Putra Malaysia for providing valuable support to undertake the research work.
Declaration of Competing Interest
The authors declare that they have no known competing financial interests or personal relationships that could have appeared to influence the work reported in this paper.
References
- Biodegradation of bispyribac sodium by a novel bacterial consortium BDAM: Optimization of degradation conditions using response surface methodology. J. Hazard. Mater.. 2018;349:272-281.
- [Google Scholar]
- Application of response surface methodology for optimization of medium components for the production of secondary metabolites by Streptomyces diastatochromogenes KX852460. AMB Express.. 2017;7:96.
- [Google Scholar]
- One step green synthesis of larvicidal, and azo dye degrading antibacterial nanoparticles by response surface methodology. J. Photochem. Photobiol. B. 2019;190:154-162.
- [Google Scholar]
- Determination of aldicarb, carbofuran and some of their main metabolites in groundwater by application of micellar electrokinetic capillary chromatography with diode-array detection and solid-phase extraction. Pest Manage. Sci.. 2004;60:675-679.
- [Google Scholar]
- Characterization of a novel carbofuran degrading Pseudomonas sp. with collateral biocontrol and plant growth promoting potential. FEMS Microbiol. Lett.. 2004;231:13-17.
- [Google Scholar]
- Carbofuran toxicity on total lipids and free fatty acids in air breathing fish during exposure and cessation of exposure–in vivo. Environ. Monit. Assess.. 2001;70:233-239.
- [Google Scholar]
- Optimization of culture conditions to produce high yields of active Acetobacter sp. CCTCC M209061 cells for anti-Prelog reduction of prochiral ketones. BMC Biotechnol.. 2011;11:110.
- [Google Scholar]
- Accelerated biodegradation of selected nematicides in tropical crop soils from Costa Rica. Environ. Sci. Pollut. Res. Int.. 2015;22:1240-1249.
- [Google Scholar]
- Adaptation of biomixtures for carbofuran degradation in on-farm biopurification systems in tropical regions. Environ. Sci. Pollut. Res. Int.. 2015;22:9839-9848.
- [Google Scholar]
- Design of an optimized biomixture for the degradation of carbofuran based on pesticide removal and toxicity reduction of the matrix. Environ. Sci. Pollut. Res. Int.. 2015;22:19184-19193.
- [Google Scholar]
- Carbofuran promotes biochemical changes in carp exposed to rice field and laboratory conditions. Ecotoxicol. Environ. Saf.. 2014;101:77-82.
- [Google Scholar]
- Collins C, Lyne PM, Grange J. Collins and lyne's microbiological methods. 1989.
- Devi KY, Iyer P. Isolation & Characterization OF Carbofuran pesticide degrading microorganisms from various field areas in TAMIL NADU. 2017.
- Soil differences in the biodegradation of carbofuran and trimethacarb following pretreatment with these insecticides. Bull. Environ. Contam. Toxicol.. 1990;45:531-537.
- [Google Scholar]
- Application of statistical experimental design for optimization of silver nanoparticles biosynthesis by a nanofactory Streptomyces viridochromogenes. J. Microbiol.. 2014;52:53-63.
- [Google Scholar]
- Enhanced microbial degradation of carbofuran in soils with histories of Furadan use. Bull. Environ. Contam. Toxicol.. 1981;26:781-788.
- [Google Scholar]
- Mechanisms of synergistic neurotoxicity induced by two high risk pesticide residues - Chlorpyrifos and Carbofuran via oxidative stress. Toxicol. In Vitro. 2019;54:338-344.
- [Google Scholar]
- Optimization of supercritical fluid extraction of pesticide residues in soil by means of central composite design and analysis by gas chromatography-tandem mass spectrometry. J. Chromatogr. A. 2006;1110:6-14.
- [Google Scholar]
- Identification of microbial species present in a pesticide dissipation process in biobed systems using typical substrates from southeastern Mexico as a biomixture at a laboratory scale. Sci. Total Environ.. 2018;628–629:528-538.
- [Google Scholar]
- Optimization of surfactin production by Bacillus subtilis HSO121 through Plackett-Burman and response surface method. Protein Pept. Lett.. 2014;21:885-893.
- [Google Scholar]
- Application of response surface methodology for optimising caffeine-degrading parameters by Leifsonia sp. strain SIU. J. Environ. Biol.. 2015;36:1215-1221.
- [Google Scholar]
- The dissipation of carbofuran in two soils with different pesticide application histories within Nzoia River Drainage Basin, Kenya. Bull. Environ. Contam. Toxicol.. 2014;92:616-620.
- [Google Scholar]
- Isolation and characterization of 23 carbofuran-degrading bacteria from soils from distant geographical areas. Lett. Appl. Microbiol.. 2000;31:353-358.
- [Google Scholar]
- Bacterial consortium-based sensing system for detecting organophosphorus pesticides. Anal. Chem.. 2018;90:10577-10584.
- [Google Scholar]
- Response surface modeling of lead removal by graphene oxide-Fe3O4 nanocomposite using central composite design. J. Environ. Health Sci. Eng.. 2016;14:2.
- [Google Scholar]
- Kundu D, Hazra C, Chaudhari A. Statistical modeling and optimization of culture conditions by response surface methodology for 2,4- and 2,6-dinitrotoluene biodegradation using Rhodococcus pyridinivorans NT2. 3 Biotech. 2016;6:155.
- Statistical optimization of the medium composition by response surface methodology to enhance schizophyllan production by Schizophyllum commune. Z. Naturforsch C. 2011;66:173-181.
- [Google Scholar]
- Acute and chronic toxicity of diuron and carbofuran to the neotropical cladoceran Ceriodaphnia silvestrii. Environ. Sci. Pollut. Res. Int.. 2018;25:13335-13346.
- [Google Scholar]
- Biodegradation of cyanide by a new isolated strain under alkaline conditions and optimization by response surface methodology (RSM) J. Environ. Health Sci. Eng.. 2014;12:85.
- [Google Scholar]
- A statistical experiment design approach for optimizing biodegradation of weathered crude oil in coastal sediments. Bioresour. Technol.. 2010;101:893-900.
- [Google Scholar]
- Isolation and characterization of carbofuran degrading bacteria from cultivated soil. Biochem. Cell Arch.. 2012;12:313-320.
- [Google Scholar]
- Park MR, Lee S, Han T, Oh B, Shim JH, Kim IS. A new intermediate in the degradation of carbofuran by Sphingomonas sp. strain SB5. Journal of microbiology and biotechnology. 2006;16:1306.
- Response surface optimization of experimental conditions for carbamazepine biodegradation by Streptomyces MIUG 4.89. N. Biotechnol.. 2015;32:347-357.
- [Google Scholar]
- Response surface methodology: optimisation of antifungal bioemulsifier from novel Bacillus thuringiensis. ScientificWorldJournal. 2014;2014:423289
- [Google Scholar]
- Optimization of enterobacter cloacae (KU923381) for diesel oil degradation using response surface methodology (RSM) J. Microbiol.. 2017;55:104-111.
- [Google Scholar]
- Experimental design approach to the optimization of PAHs bioremediation from artificially contaminated soil: application of variables screening development. J. Environ. Health Sci. Eng.. 2015;13:22.
- [Google Scholar]
- Application of response surface methodological approach to optimise Reactive Black 5 decolouration by crude laccase from Trametes pubescens. J. Hazard. Mater.. 2009;169:691-696.
- [Google Scholar]
- Carbofuran concentrations in blood, bile and tissues in fatal cases of homicide and suicide. Forensic Sci. Int.. 2013;227:106-110.
- [Google Scholar]
- Fungal biodegradation of carbofuran and carbofuran phenol by the fungus Mucor ramannianus: identification of metabolites. Water Sci. Technol.. 2007;55:163-167.
- [Google Scholar]
- Application of response surface methodology (RSM) for optimization of nutrient supplementation for Cr (VI) removal by Aspergillus lentulus AML05. J. Hazard. Mater.. 2009;164:1198-1204.
- [Google Scholar]
- Tien CJ, Huang HJ, Chen CS. Accessing the Carbofuran Degradation Ability of Cultures From Natural River Biofilms in Different Environments. CLEAN–Soil, Air, Water. 2017;45.
- W.H.O. The WHO recommended classification of pesticides by hazard and guidelines to classification 2009. 2010.
- Optimization of diesel oil biodegradation in seawater using statistical experimental methodology. Water Sci. Technol.. 2012;66:1301-1309.
- [Google Scholar]
- Li SP Construction of double-labelled carbofuran-degrading bacterium Sphingomonas sp. CDS-1. Wei Sheng Wu Xue Bao. 2006;46:613-617.
- [Google Scholar]
- Application of response surface methodology for optimization of polygalacturonase production by Aspergillus niger. J. Environ. Biol.. 2015;36:255-259.
- [Google Scholar]
- Isolation and characterization of a carbofuran-degrading strain Novosphingobium sp. FND-3. FEMS Microbiol. Lett.. 2007;271:207-213.
- [Google Scholar]
- Investigation of equilibrium and kinetics of Cr(VI) adsorption by dried Bacillus cereus using response surface methodology. Water Sci. Technol.. 2016;73:617-627.
- [Google Scholar]


