Translate this page into:
Optimal control of a production-maintenance system with deteriorating items
*Corresponding author. Tel.: +966 552280077; fax: +966 14676274. fbukhari@ksu.edu.sa (Fawzy A. Bukhari),
-
Received: ,
Accepted: ,
This article was originally published by Elsevier and was migrated to Scientific Scholar after the change of Publisher.
Abstract
A production process whose performance deteriorates over time is studied in this paper. It is assumed that the process performance can be measured in terms of the proportion of good units of end items produced. Using the pontryagin principle, the optimal scheduled production rate and preventive maintenance rate will be derived as a function of both production rate and proportion of good units. The controlled system can be modeled by a system of non-linear differential equations and its solution will be discussed numerically. The sensitivity analysis for varying system parameters will be discussed for different cases of demand rate.
Keywords
Production-maintenance system
Optimal control
Pontryagin minimum principle
Optimal production rate
1 Introduction
Optimal control theory is found to be very useful in solving many problems in different fields, such as management science and in particular, maintenance of a production inventory system; see Sethi and Thompson (2000). Application of optimal control techniques were used in many problems such as:
-
The problem of optimal control of a two-items inventory model with different types of deterioration was studied by Alshamrani and El-Gohary (in press). In such study, the optimal inventory levels and rate of continuous supply are derived.
-
The problem of optimal control of a multi-items inventory model was studied by El-Gohary and El-syed (2008).
-
The problem of optimal control of a stochastic production planning model with different demand rates was studied by El-Gohary et al. (2007). The optimal expected inventory level was derived from the condition of the stochastic optimal control principle.
-
The problem for controlling a production inventory model for both ameliorating and deteriorating items was studied by Tadj et al. (2008). The necessary optimality conditions were derived using the pontryagin maximum principle.
-
The problem of optimal stabilization of steady-states of the genital herpes epidemic for finite and infinite time horizons was studied by El-Gohary and Bukhari (2003a). The optimal feedback controllers were derived from the condition of asymptotic stabilization of the genial herpes about its steady-states.
-
The problem of optimal control of the Lorenz system for finite and infinite time horizons was studied by El-Gohary and Bukhari (2003b). The optimal controllers were derived as non-linear function of the state variables.
-
The problem of optimal control of a stochastic prey-predator model were discussed by El-Gohary and Bukhari (2003c). The steady-states of this model was derived. Also, the optimal feedback obtained from the conditions ensure asymptotic stabilization of the system.
Other studies can be found in the problems of inventory systems with divergent multi-echelon, one product recovery system with lead times and the production inventory system (Diks and de Kok, 1998; Kiesmüller, 2003; Porter and Taylor, 1972).
This paper focus on a production-maintenance system with deteriorating items. The optimal scheduled production rate and proportion of good units are derived. The total cost includes the sum of the holding costs of inventory levels and the scheduled production costs will be minimized. The optimal solution is derived based on the pontryagin minimum principle. The system is modeled by a system of non-linear differential equations and its solution will be discussed numerically and is also used for illustrating the system performance as function of the system parameters.
The rest of the paper is organized as follows: following this introduction, the mathematical formulation of the production and maintenance model with deterioration is introduced in Section 2. Also, the optimal scheduled production rate and proportion of good units for finite planning horizon are derived. In Section 3 we present some illustrative examples for different demand rates and obsolescence rate of process performance in the absence of maintenance. In Section 4 a conclusion is presented.
2 Mathematical model formulation
Consider a manufacturing system that produces a single item, selling some units and storing the other units. The following variables and parameters are used through this paper to formulate our model:
I(t)
the inventory level at time t
p(t)
proportion of good units of end items produced at time t, where 0 ⩽ p(t) ⩽ 1
u(t)
scheduled production rate at time t
α(t)
obsolescence rate of process performance in the absence of maintenance, where α(t) is a non-decreasing function of time
m(t)
preventive maintenance rate applied at time t to reduce the proportion of defective units
S(t)
the demand rate at time t
θ
the natural deterioration rate
the inventory goal level
proportion goal level of good units
ū
scheduled production goal rate
preventive maintenance goal rate
In this paper, the following assumtions are adopted:
-
There is a non-negative initial inventory level I(0) = I0 > 0, and initial proportion of good units.
-
All demand units should be satisfied such that: I(t) > 0.
-
Negative production rate is not allowed.
-
The preventive maintenance rate is bounded by a lower limit of zero and an upper limit of M, that is (0 ⩽ m(t) ⩽ M).
-
All functions are assumed to be non-negative, continuous and differentiable.
The model of differential equations which describes the time evolution of the inventory level I(t) and the proportion of good units p(t) is found to be as follows:
This paper will generalize the above equations which were used by Danny et al. (1993) to contain deterioration rate θ for inventory items.
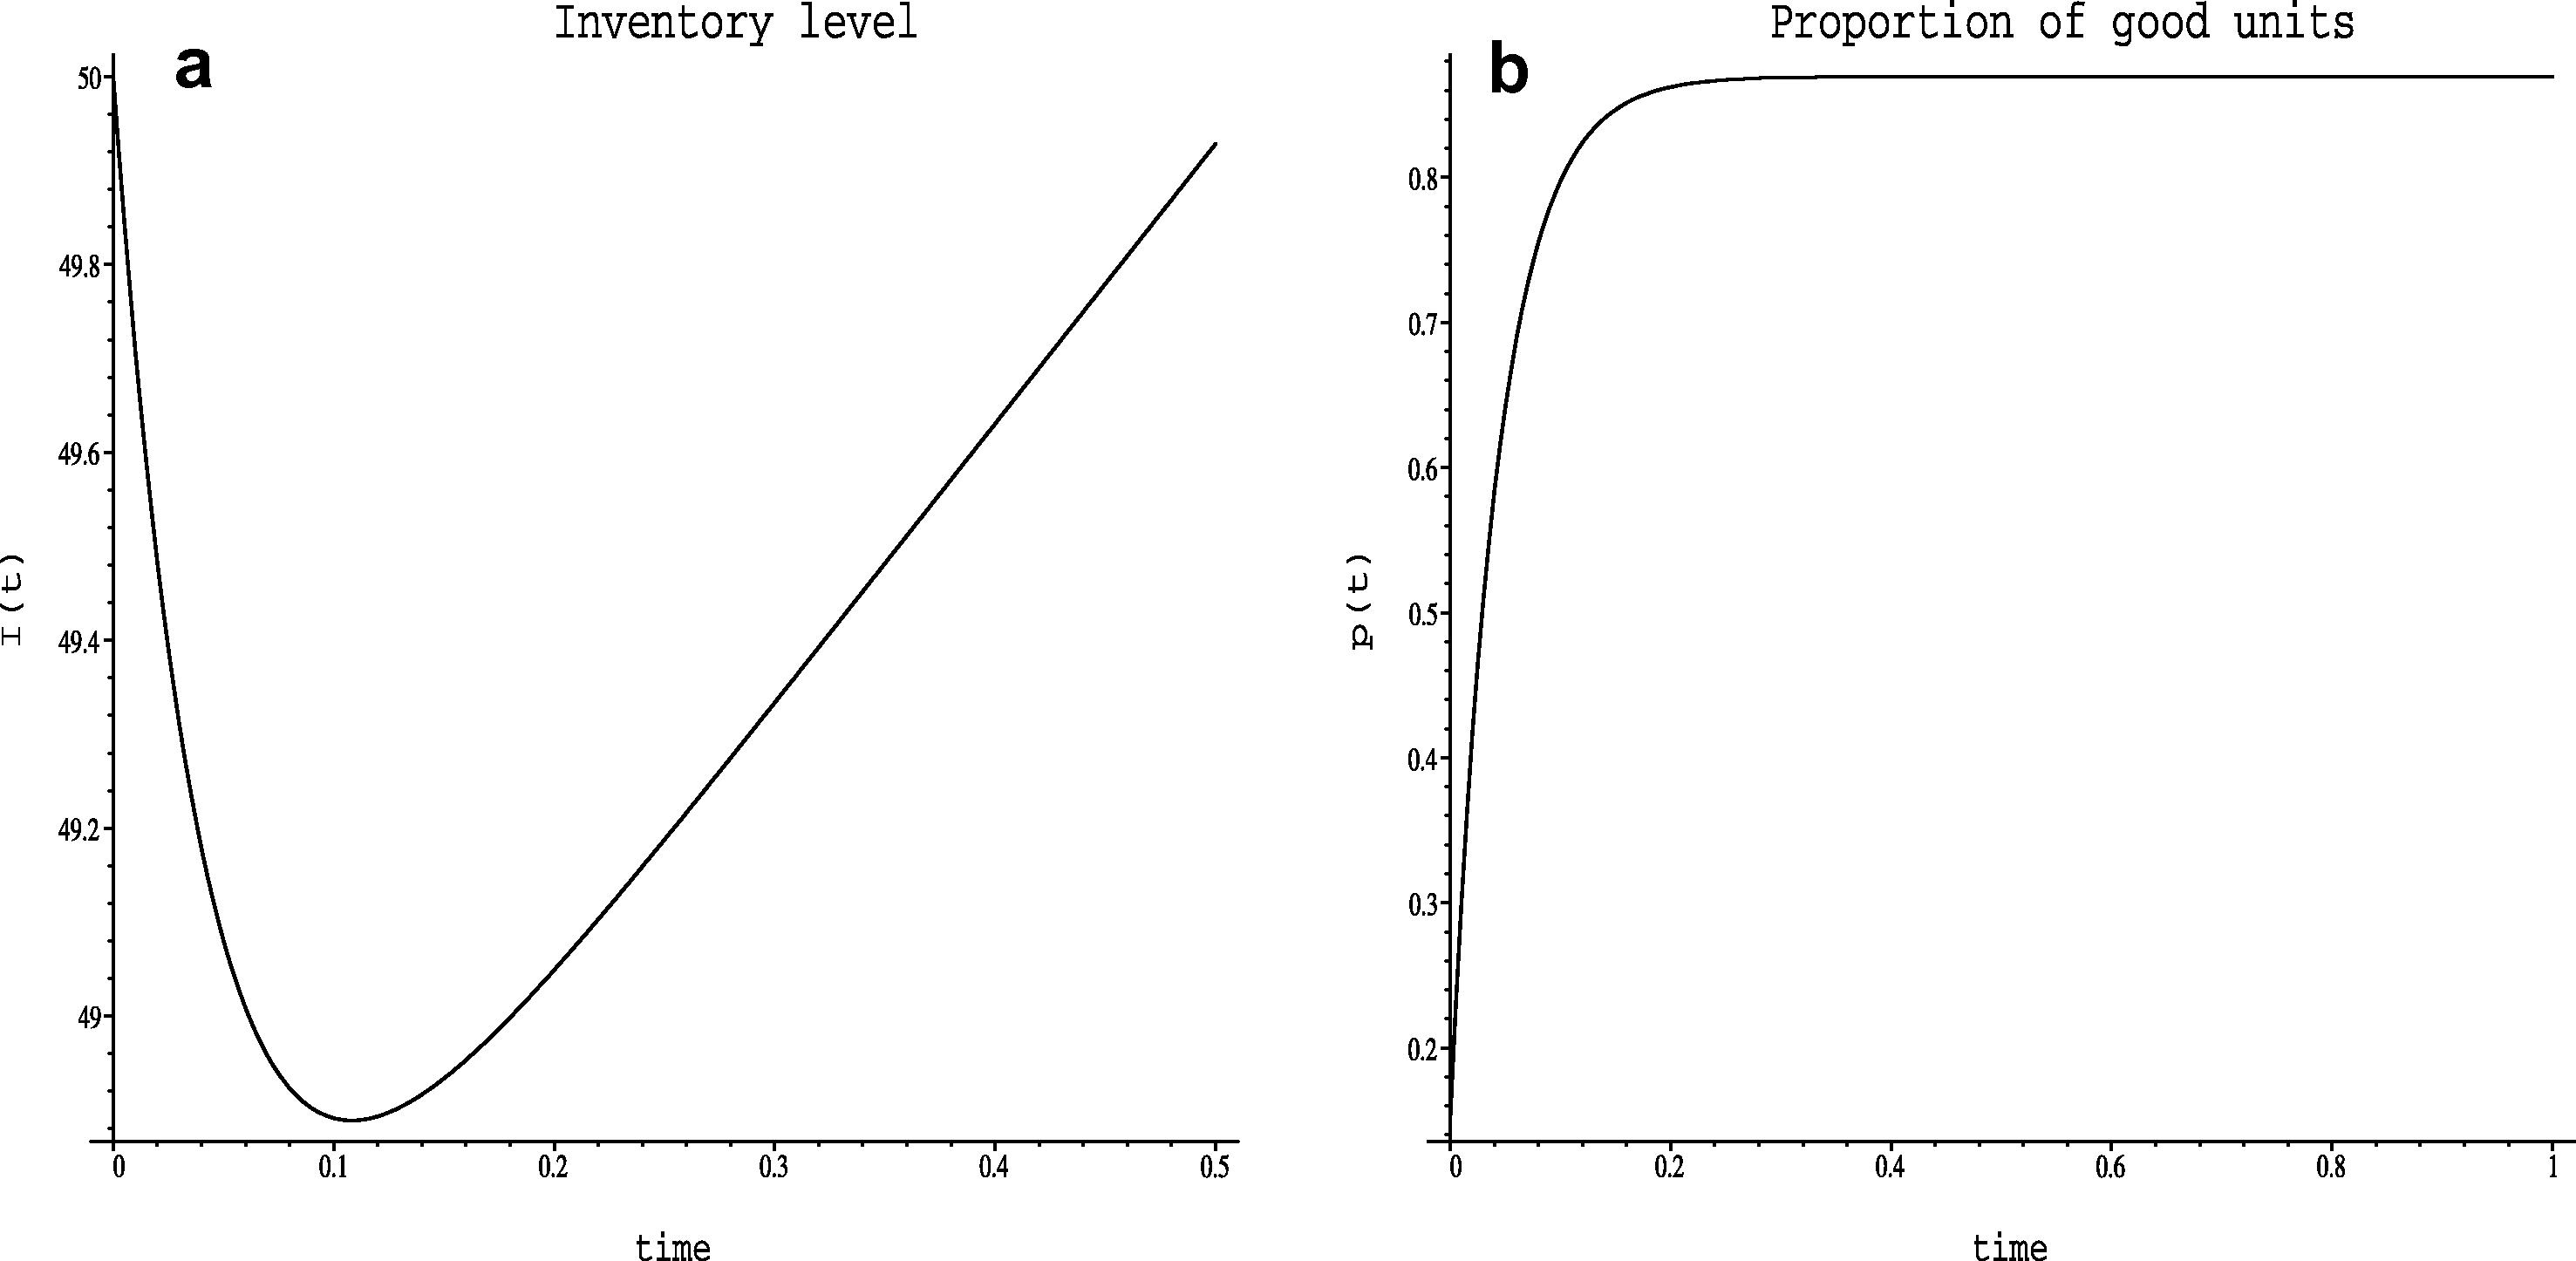
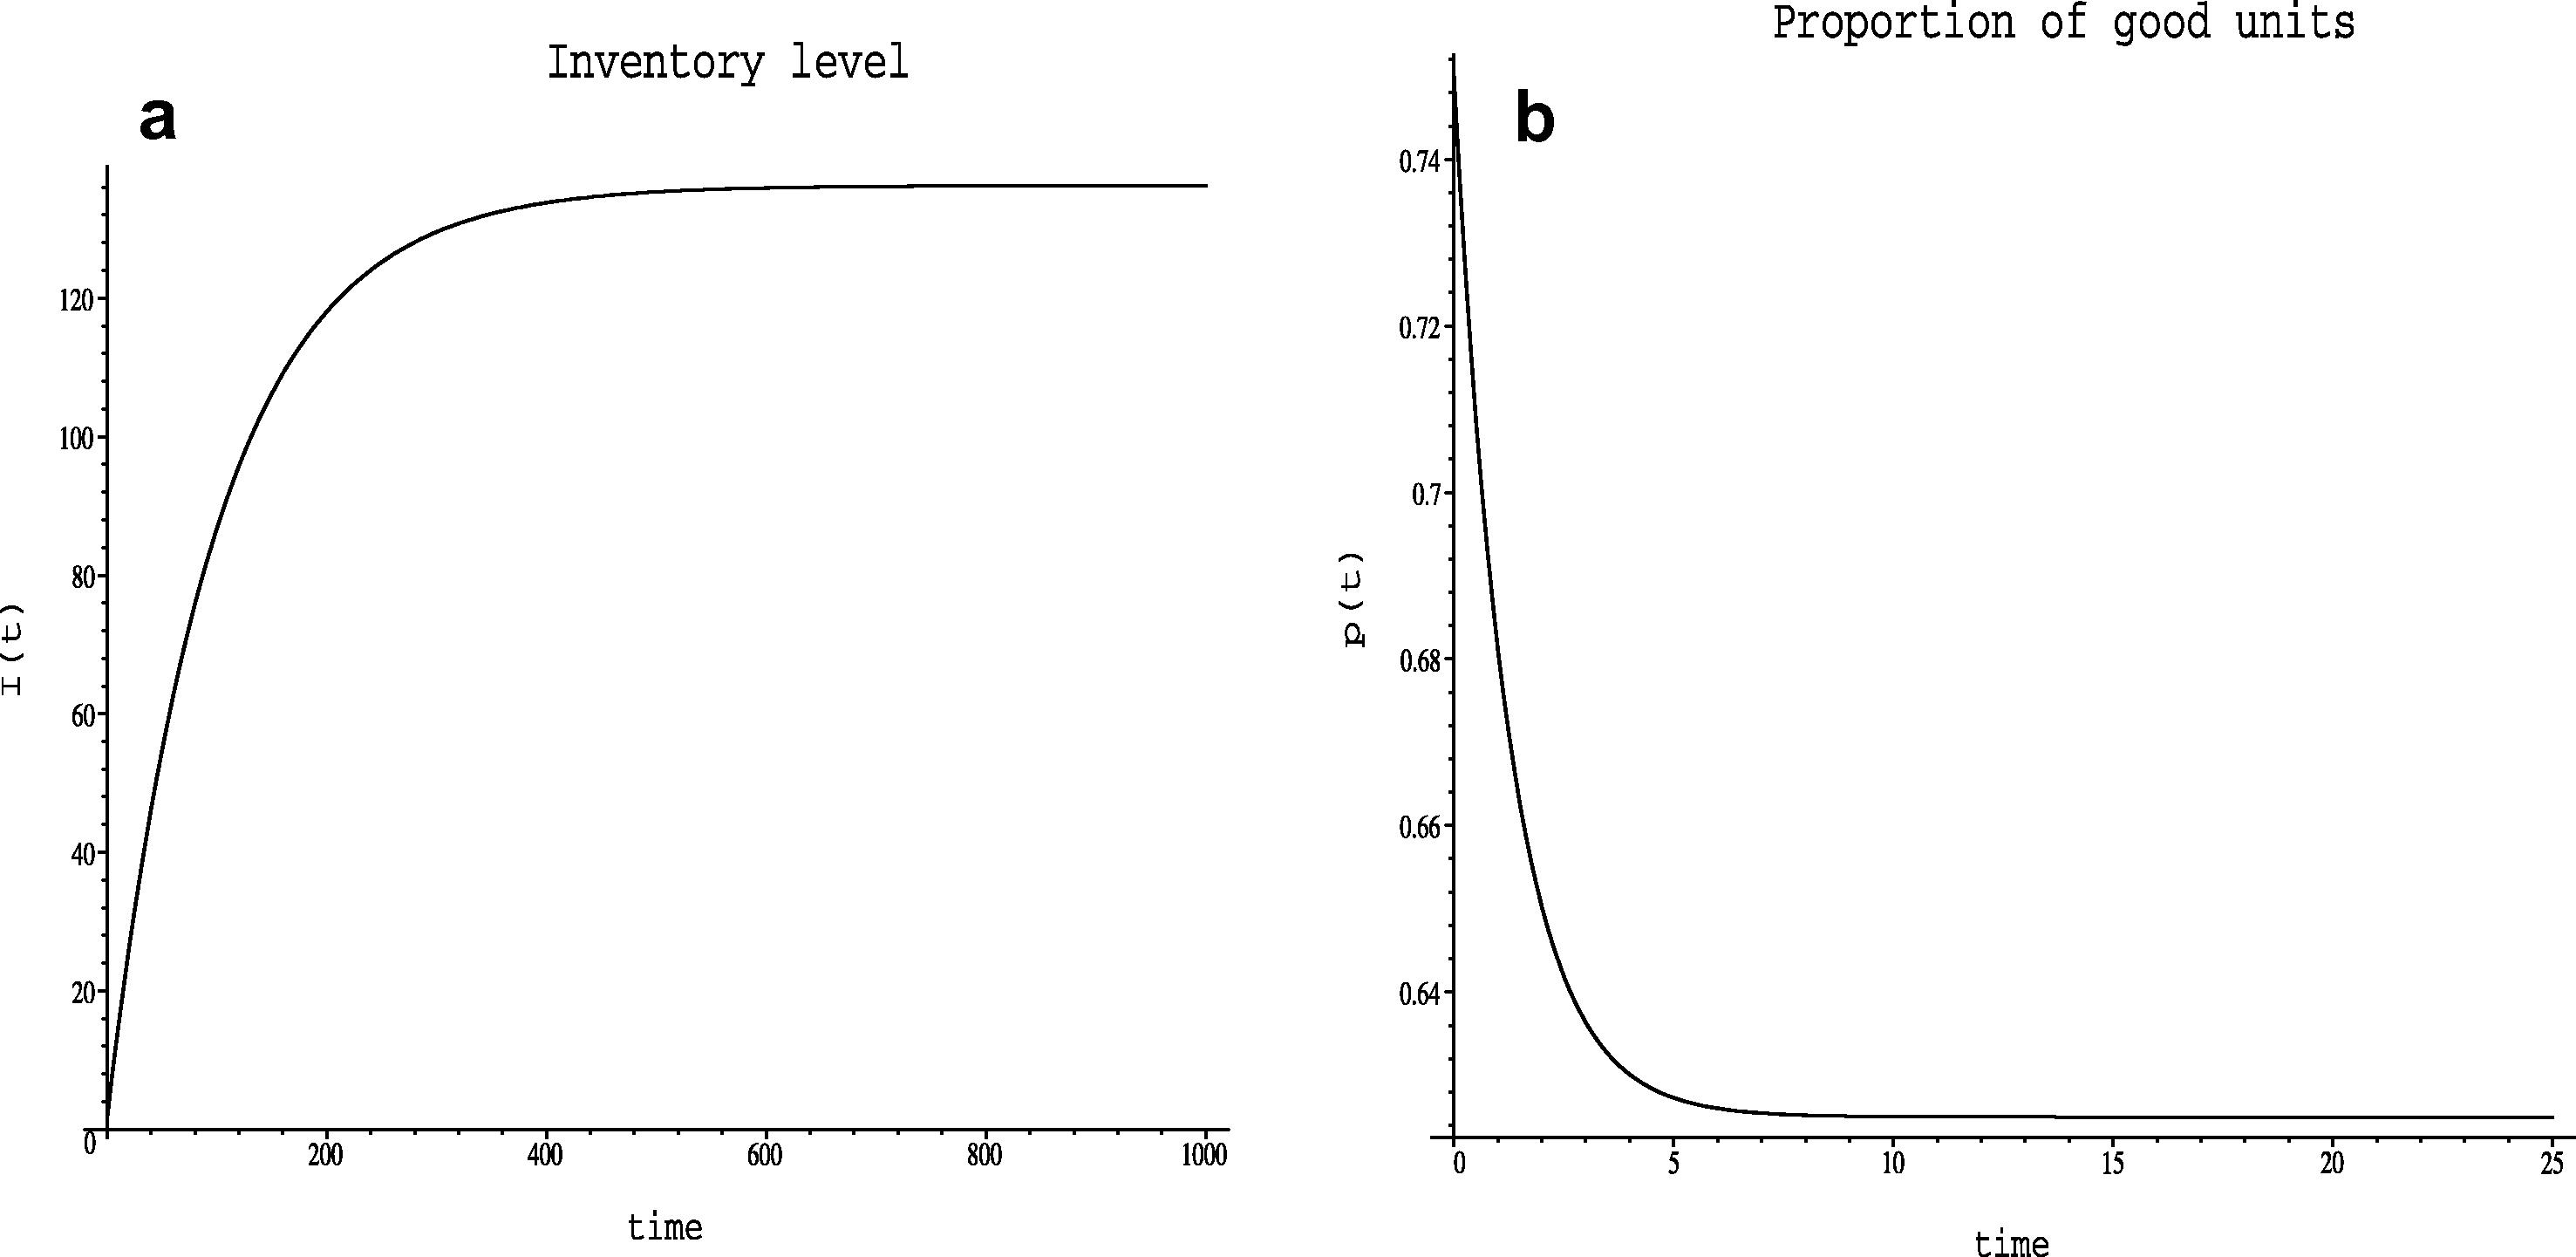
The numerical solution of the production and preventive maintenance system with deterioration is displayed below for specified values of obsolescence rate of process performance in the absence of maintenance and scheduled production rate (Figs. 1 and 2).
Numerical solution of the system (1) for the values u(t) = 50, S(t) = 40, α(t) = 3, θ = 0.01, m(t) = 20 and initial values I(0) = 50, p(0) = 0.15.

Numerical solution of the system (1) for the values u(t) = 2.5, S(t) = 0.20, α(t) = 0.30, θ = 0.01, m(t) = 0.50 and initial values I(0) = 1.5, p(0) = 0.75.
2.1 Optimal production and preventive maintenance rates
The main objective of this subsection is to arrive at a suitable mathematical formulation of the optimal control problem for the production and preventive maintenance system with deterioration. The optimal control problem consists of two state variables which are the inventory level and proportion of good unit rate and two control variables which are the schedule production rate and the preventive maintenance. The formulation must be simple to deal with any response of the production and preventive maintenance system to any given input. Optimal control is defined by the admissible production and proportion of good units rates which minimize the total cost given by
It can be shown that the integrand of the objective function (2) is a positive definite form of the variables I(t), p(t), u(t) and m(t) (Ogata, 2010; Hocking, 1991).
The economic and physical interpretations of the objective function (2) are that it aims at keeping the inventory level I(t) as close as possible to the goal level and also keep the proportion of good units p(t) as close as possible to the goal rates (El-Gohary and Bukhari, 2003a). The objective function (2) represents the total cost incurred in a production and maintenance system with deteriorating items. The quadratic terms in (2) represent the imposed penalties for having either I(t) or p(t) not being close to its corresponding goal level or , respectively.
By introducing an additional state variable which satisfies the state Eq. (2), the cost integral is replaced by
Next, we introduce the co-state variables λ0, λ1 and λ2 corresponding to the state variables I0, I1 and I2, respectively. From Eqs. (2)–(4) we obtain the Hamiltonian function H:
We choose:
To obtain the optimal scheduled production rate u(t) and preventive maintenance rate m(t) we will differentiate the Lagrange function (11) with respect to u(t) and m(t) and putting:
Using (15) with the terminal conditions λi(T) = 0 (i = 1, 2) we can get
The optimal scheduled production rate and optimal preventive maintenance rate follow from (4) and (15)
Using Eqs. (3), (15) and (17) we can get the following system of non-linear ordinary differential equations:
3 Numerical solution and sensitivity analysis
The main objective of this section is to study the numerical solution of the problem to determine an optimal control strategy for a production and maintenance model with deterioration. The numerical solution algorithm is based on numerical integration of the system using the Runge–Kutta method. This section displays graphically the numerical integration of the system of differential equations for different values of the parameters. The numerical solution of the system (20) is discussed for different cases of the system parameters and initial states.
3.1 Constant demand and obsolescence rates
We are looking at the numerical solution of the production and maintenance model with both constant demand rate S(t) and constant obsolescence rates of process performance in the absence of maintenance α(t). The numerical solution for the production and maintenance model with deterioration is presented. Different sets of values of the monetary and non-monetary parameters are considered. The solution of the non-linear system of non-linear differential Eq. (20) is obtained numerically and its time evolution is discussed.
The following set of parameter values is assumed:
par.
c1
c2
h1
h2
θ
S(t)
α
val.
40
50
60
30
50
60
0.02
0.75
24
20
20
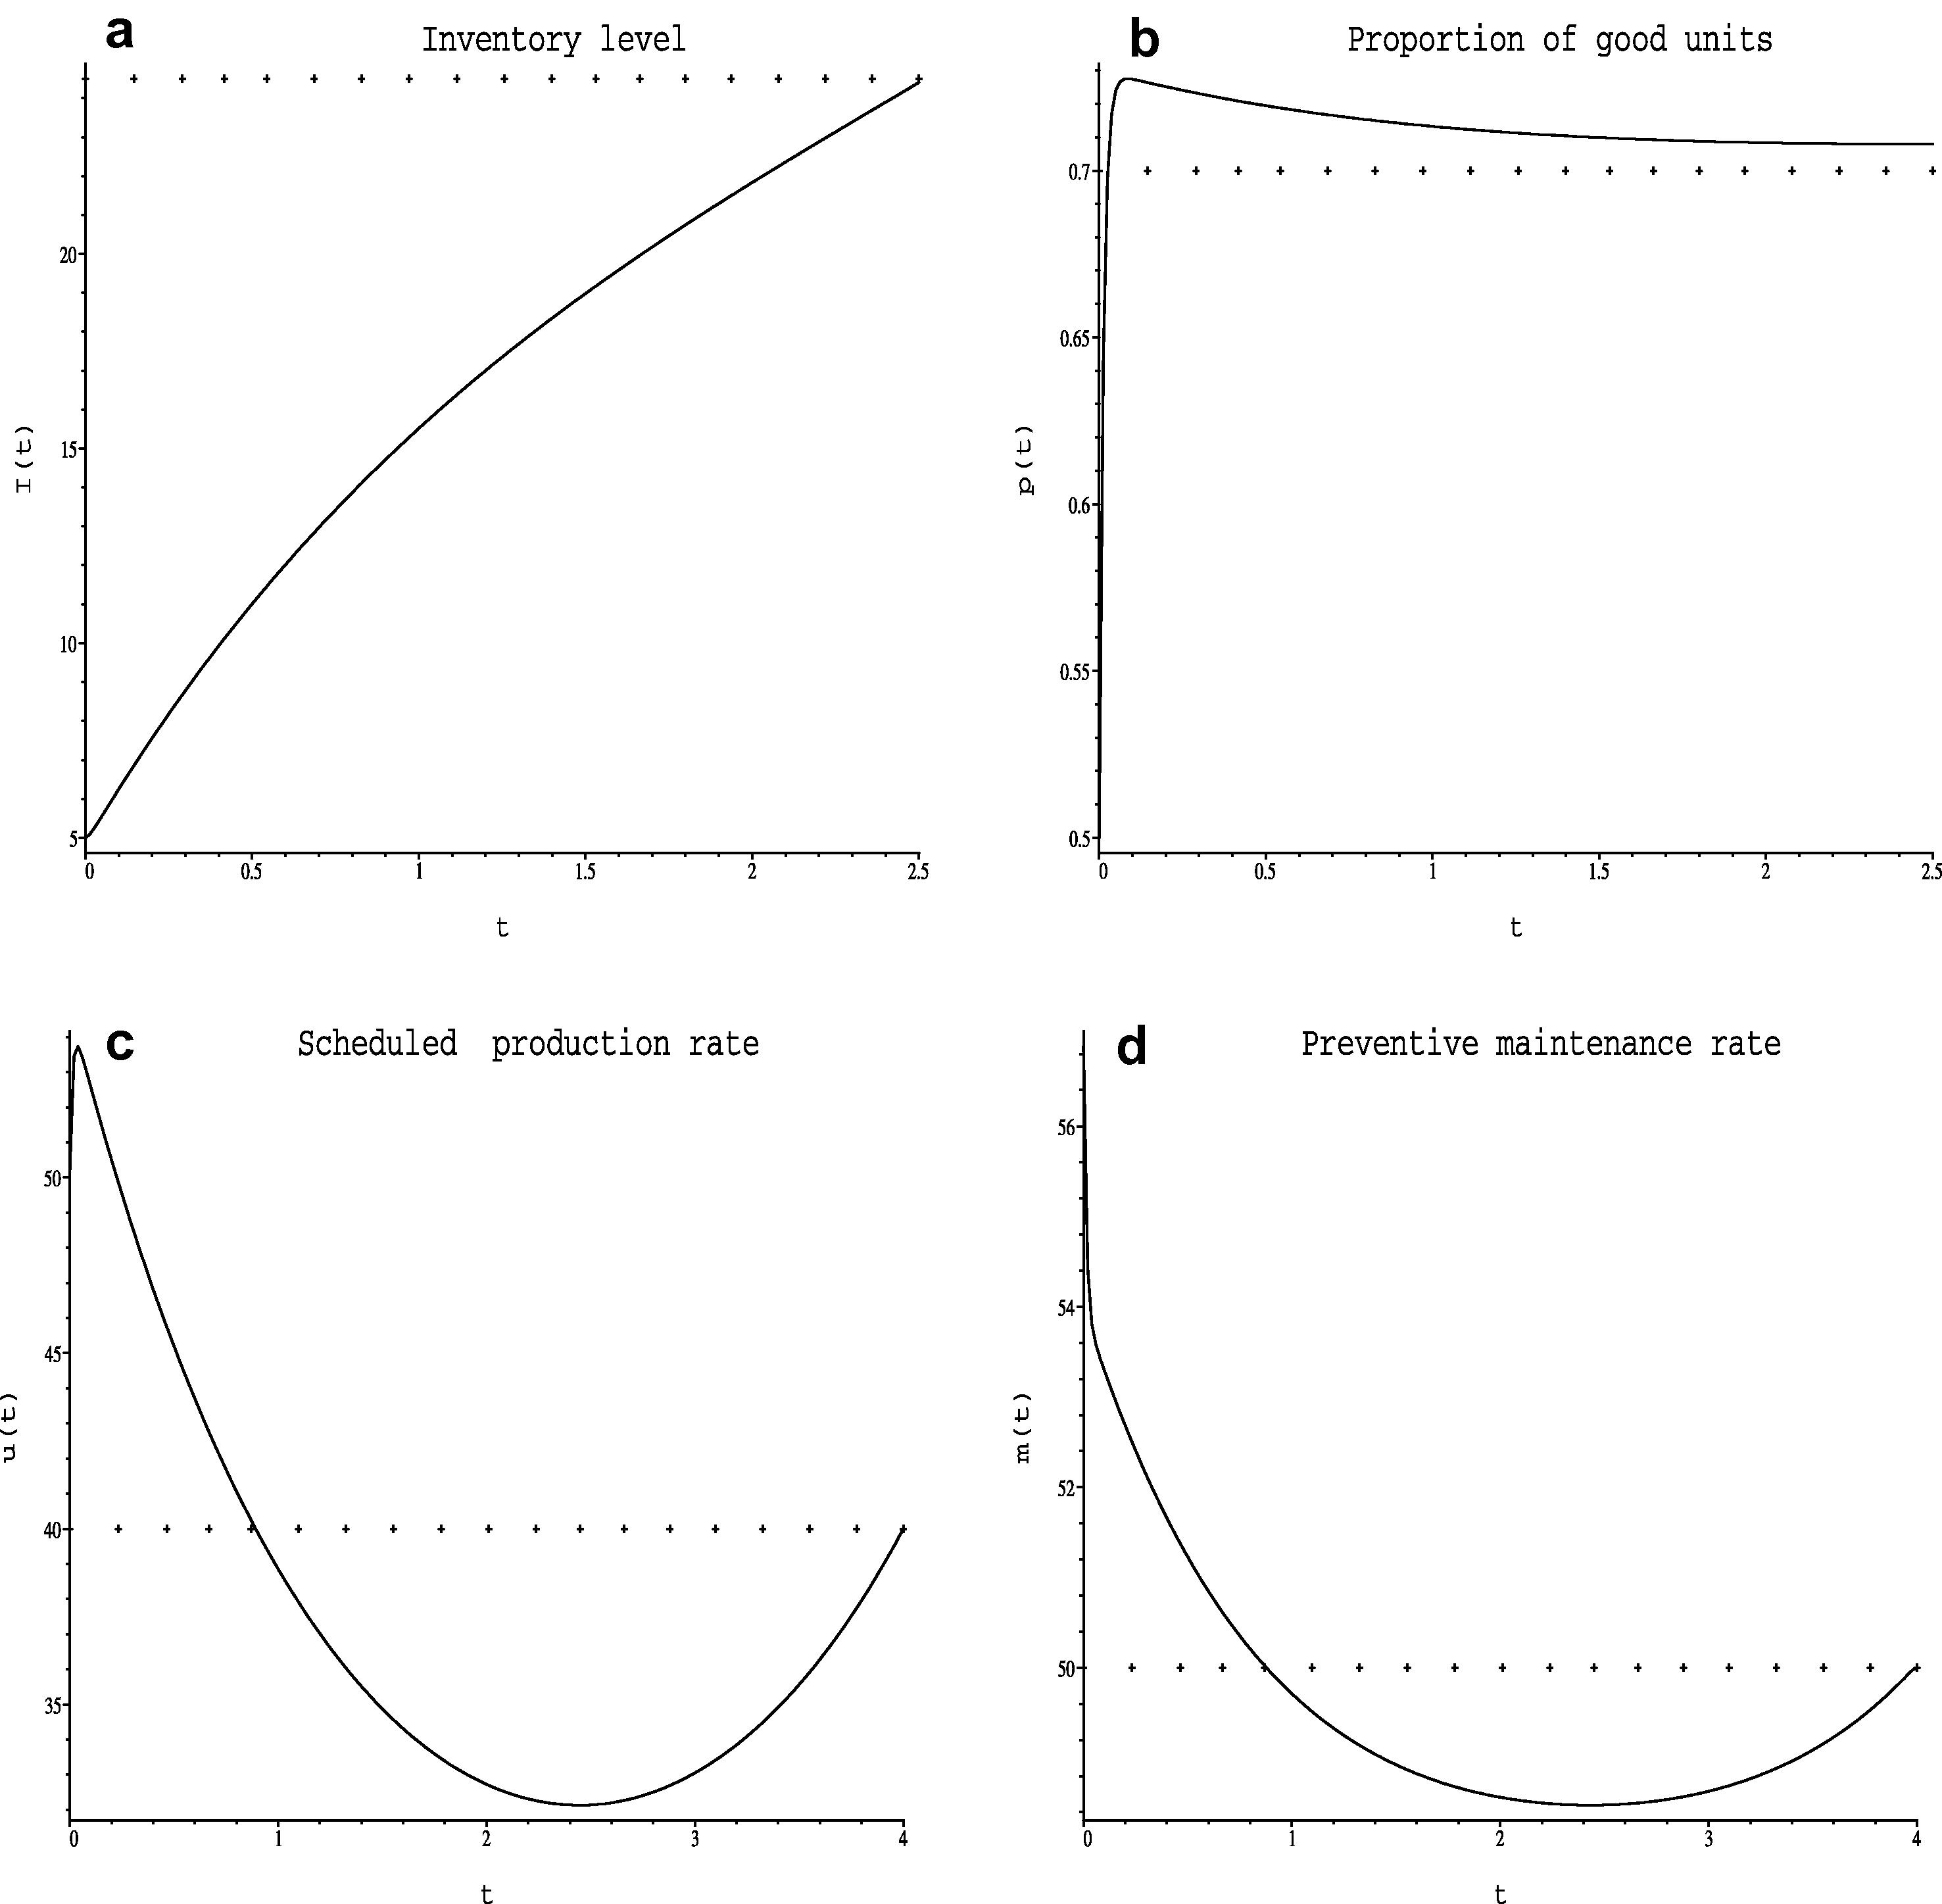
The numerical results are illustrated in Fig. 3a–d.
(a) Inventory level, (b) proportion of good units, (c) scheduled production rate and (d) preventive maintenance rate.
We conclude that both the inventory level and the proportion of good units approximately tend to their goal level and rate, respectively.
3.2 Time dependent demand and obsolescence rates
The numerical solution of the production and maintenance model with constant demand rate S(t) and obsolescence rate of process performance in the absence of maintenance α(t) is studied here. The numerical solution for the production and maintenance model with deterioration is presented. Different sets of values of the monetary and non-monetary parameters are considered. The solution of the non-linear system of non-linear differential Eq. (20) is obtained numerically and its the time evolution is discussed.
The following set of parameter values is assumed:
par.
c1
c2
h1
h2
θ
val.
40
30
40
50
50
40
0.01
0.35
45
The initial inventory level, inventory goal level, proportion of good items, and demand rates are: I(0) = 15,α = 1 + sin(t), p(0) = 0.05, S = 1 + sin(t), respectively, and time horizon interval is T = 5.
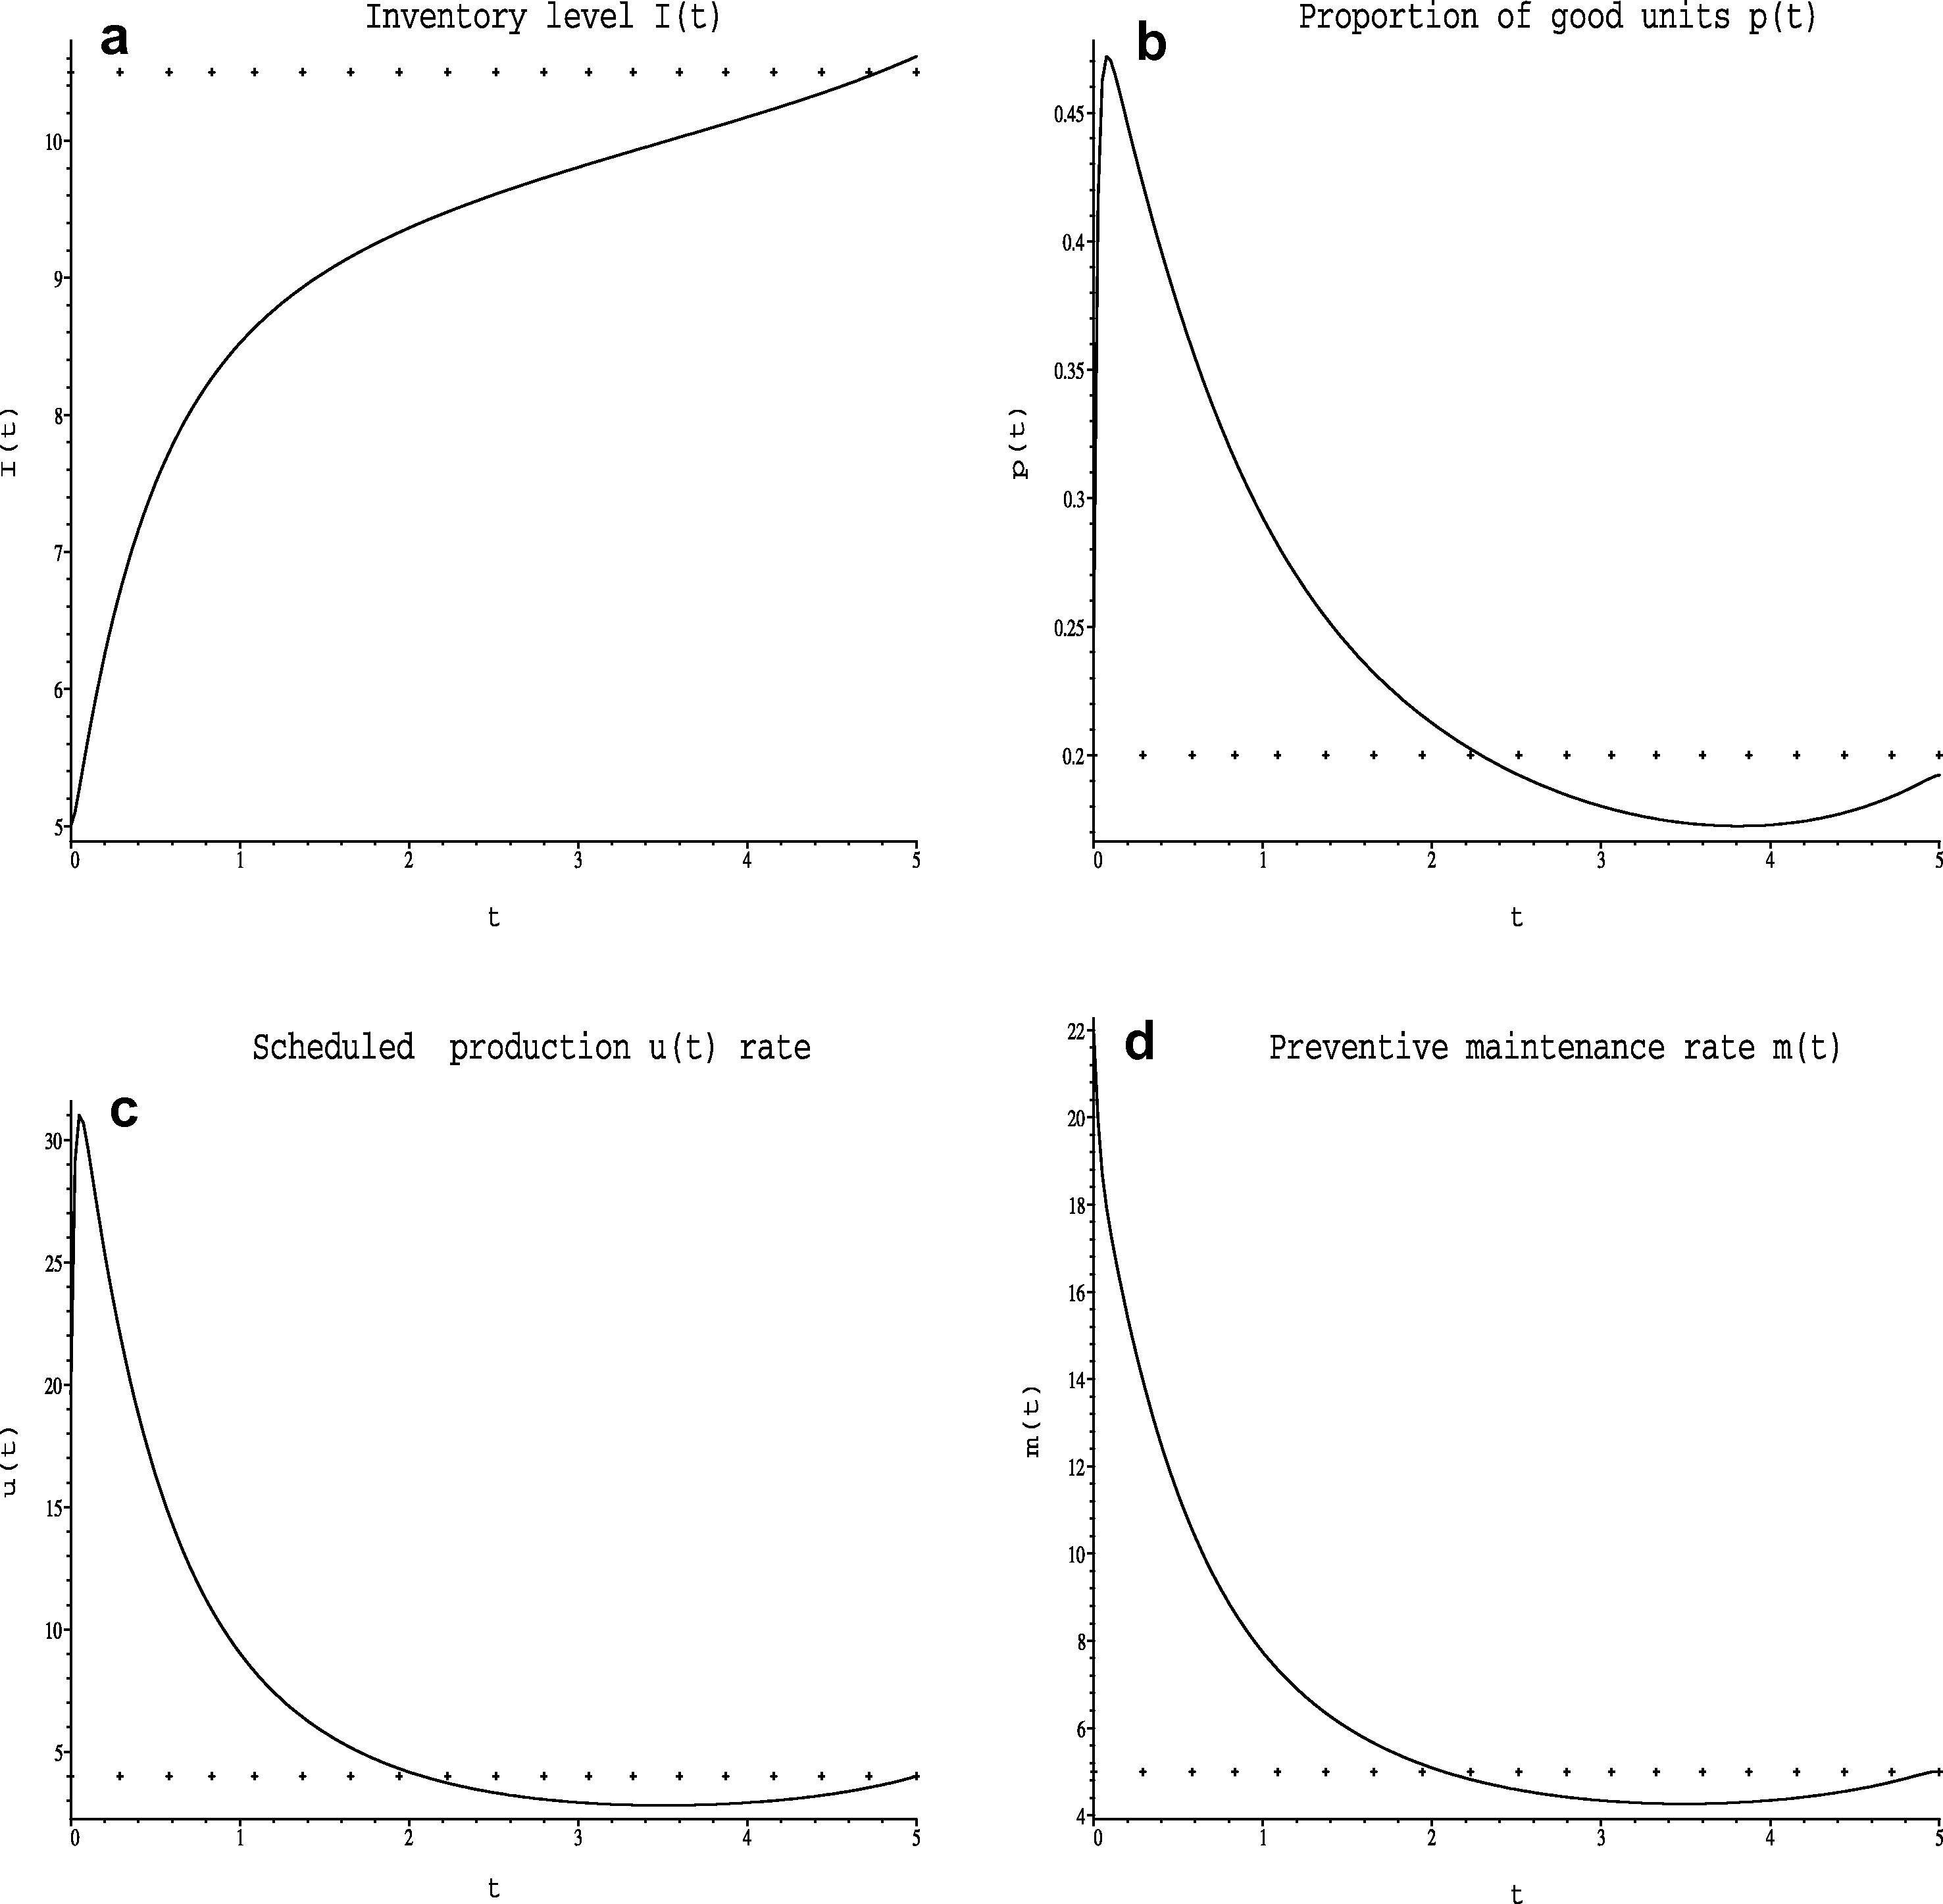
The numerical results are illustrated in Fig. 4a–d.
(a) Inventory level, I(t), (b) proportion of good units, p(t), (c) scheduled production rate, u(t) and (d) preventive maintenance rate, m(t).
We conclude that both the inventory level and proportion of good units tend to its goal level and its rate, respectively.
4 Conclusion
The problem of optimal control of a production and maintenance system with deteriorating items was studied. The optimal inventory level and proportion of good units are derived. Also, optimal scheduled production and maintenance rates are derived from the optimality conditions as function of co-state variables and proportion of good units. Further, the optimal solution of the control system is presented numerically for different cases of both demand and obsolescence rates. The sensitivity analysis of the system against monetary and non-monetary parameters is discussed.
References
- Alshamrani, A., El-Gohary, A. (in press). Optimal control of two-item inventory model with different types of deterioration. Economic Quality Control.
- Optimal production and maintenance decision when a system exaperience age dependent deterioration. Optimal Control Applications and Methods. 1993;14(3):153-167.
- [Google Scholar]
- Optimal control of a divergent multi-echelon inventory system. European Journal of Operational Research. 1998;111:75-97.
- [Google Scholar]
- Optimal stabilization of steady-states of the genital herpes epidemic during infinite and finite time intervals. Applied Mathematics and Computation. 2003;137:33-47.
- [Google Scholar]
- Optimal control of Lorenz system during different time intervals. Applied Mathematics and Computation. 2003;144:337-351.
- [Google Scholar]
- Optimal control of stochastic prey-predator models. Applied Mathematics and Computation. 2003;146:403-415.
- [Google Scholar]
- Optimal control of multi-item inventory models. International Mathematical Forum. 2008;3(27):1295-1312.
- [Google Scholar]
- Optimal control of a stochastic production planning model with different demand rates. International Journal of Applied Mathematics. 2007;20(3):333-349.
- [Google Scholar]
- Optimal Control an Introduction to the Theory with Applications. Clarendon press; 1991.
- Optimal control of a one product recovery system with lead times. International Journal of Production Economics 2003:333-340.
- [Google Scholar]
- Modern Control engineering. Prentice-Hall; 2010.
- Modal control of production-inventory systems. International Journal of Systems Engineering. 1972;3(3):325-331.
- [Google Scholar]
- Optimal Control Theory: Applications to Management Science and Economics (2nd ed.). Dordrecht: Kluwer Academic Publishers; 2000.
- Optimal control of an inventory system with ameliorating and deteriorating items. Journal of Applied Science. 2008;10:243-255.
- [Google Scholar]


