

Translate this page into:
Nitrogen and plant density effects on growth, yield performance of two different cotton cultivars from different origin
⁎Corresponding author. ygzh9999@mail.hzau.edu.cn (Guozheng Yang)
-
Received: ,
Accepted: ,
This article was originally published by Elsevier and was migrated to Scientific Scholar after the change of Publisher.
Peer review under responsibility of King Saud University.
Abstract
Nitrogen application rates and plant density are vital factors that influence cotton production considerably. The aim of the experiment was to study the effect of varied nitrogen (N) rate and planting densities (PD) on growth and yield performance of two cotton cultivars from different origins. The research was laid out in Randomized Complete Block Design (RCBD) with split plot arrangements. There were two nitrogen levels; low N level (F1 with 120 kg ha−1) and high N level (F2 with 180 kg ha−1) with three plant densities; 8 plants m−2 as low plant density (LPD), 10 plants m−2 as medium plant density (MPD) and 12 plants m−2 as high plant density (HPD). During this study we observed the interactive effect of N application levels and PD on cotton growth, yield performance. Results showed that FH-142 took more number of days to reach maturity as compared with Huamian-3109. Cotton plant dry biomass and crop growth rate (CGR) was also considerably influenced by N and PD levels. FH-142 produced maximum dry biomass under F1 with HPD and F2 with MPD respectively while least plant dry biomass production was noted under F1 with LPD. High CGR was noted in FH-142 under F2 with MPD. Another side, Huamian-3109 showed maximum plant dry biomass only under F1 with HPD. Least plant dry biomass production was noted under F1 with LPD. Higher total yield produced by FH-142 under F2 with MPD while Huamian-3109 produced similar and relatively higher seed cotton yield and lint yield in F1 with HPD and F2 with MPD. These combinations were recommended for better production of both cotton cultivars in agro climatic conditions of Pakistan.
Keywords
Cotton cultivars
Plant biomass
SPAD
Nitrogen rate
Planting density

1 Introduction
Cotton is a most important worldwide cash crop that is grown up commercially for agricultural and industrial objectives in the temperate and tropical regions of approximately fifty countries (Smith, 1999). Even though cotton is primarily grown for fiber but it has several valued uses as its seed contains of 25.4% crude oil, 16.5% protein and 30% starch (Cobley, 1976). It plays a significant role in the country’s economy because of its high quality fiber (Rehman et al., 2015; Tausif et al., 2018; Ma et al., 2020). Pakistan is the second major exporter of raw cotton, the fourth leading grower of cotton, and the third biggest user of cotton in the world. Cotton is cultivated on an area of about 2.63 Mha in Pakistan comprising of total seed cotton fabrication of 10.98 million bundles. Cotton represents 40% in employment, 7% of the esteem in agriculture, and 60% in foreign exchange earning, 64% source of edible oil and about 1.4 percent to GDP (Government of Pakistan, 2010). Additionally cotton provides raw materials to the local industries comprising of 396 textile mills, 960 ginning factories, 9.7 million spindles and over 2622 oil expelling units (Anonymous, 2011). Cotton is considerably penetrating to environment circumstances and cultivated in a wide scope of ecological areas. A number of factors such as nature of cultivars, plant density, and nutrients management are involved in getting a profitable yield (Ali et al., 2005; Yang et al., 2014; Hafeez et al., 2019).
Nitrogen is a crucial nutrient for plant growth and development (Shah et al., 2017a). Application of chemical fertilizers has played a pivotal role in increasing crop production all over the world (Iqbal et al., 2021). Consequently, the use of N fertilizers increased many fold since their introduction in the late fifties (Ahmad, 2000). It is extensively renowned that N produces a remarkable effect on vegetative and reproductive growth. The excessive N can reduce harvesting and ginning percentage, promote boll shedding, diseases, insect damage and also delay maturity (Thind et al., 2008; Shah et al., 2021). However, low N is reduces leaves size, increase root shoot ratio, improved earliness and superior shedding percentage (Radin and Manney, 1986; Shah et al., 2017b). Thus, an adequate supply of N is associated with high photosynthetic activities, vigorous vegetative growth and a dark green color (Shah et al., 2017b).
Plant population is another important factor affecting cotton yield and its associated characteristics (Yang et al., 2014). Past studies have looked at the effects of variable cotton populations on yield and fiber quality, and have reported that optimal plant populations may vary from environment to environment. Dense populations include overgrown shades of plants, which lead to fruit decay, fruit absorption, plant height increase and delayed maturation, resulting in a decline in yield and fiber quality (Bednarz et al., 2005; Siebert and Stewart, 2006). While reducing seeding rates may reduce input costs, maturity, fluff yield and fiber quality may be negatively affected when the plant quantity is too low (Siebert and Stewart, 2006). Therefore, optimal plant populations are another key factor in sustainable cotton production (Shah et al., 2021). However, over the past few years, fertilizer prices in most developing countries, including Pakistan, have reached unprecedented lying highs and supply is limited when they are most needed. In most developed countries, N is sufficient as a fertilizer supply.
Beside this, there is no extensive research in Pakistan on high planting density in cotton. Few researchers conducted some experiments about ultra narrow rows in cotton but generally these are not being adopted under field conditions by farmers. But no one has investigated the interactive effect of N and PD research in Pakistan. Furthermore, fertilizer input losses are maximum due to excessive rains in Pakistan during the end of August and whole September. However, the problems could be solved by the new planting system which results in no yield reduction if the fertilizer is applied once at the appropriate time when the plant requires it most with high plant density in late sown cotton. Therefore it is also necessary to test the china’s hypothesis in Pakistan for the betterment of researchers and farmers. The objectives of this study were (i) to determine the response of cotton cultivars to N and PD on plant growth and seed cotton yield, (ii) to find out most appropriate combination of N and PD in Chinese and Pakistani cotton cultivars.
2 Materials and methods
2.1 Experimental site
The research was conducted at the experimental area of Ghazi University, Dera Ghazi Khan (70°38 E, 30°21 N) Punjab, Pakistan, during the growing year 2016. The main features of agro-climatic conditions are very hot, as temperature in summer may shoot up to 48–50 °C and wide range of diurnal temperatures. Weather record is shown in Table 1.
Months
Max °C
Min °C
Mean °C
RH %
May
42.4
25.9
34.2
39.0
June
41.7
28.9
35.3
51.0
July
41.1
29.1
35.1
60.0
August
39.5
29.8
34.6
58.0
September
36.7
25.3
31.0
53.0
October
34.5
18.4
26.5
45.0
November
27.7
14.2
21.0
43.0
Average
37.65
24.5
31.07
49.9
To diagnose the fertility status of experimental site, a number of soil samples were collected from 20 cm depth. Soil samples were dried, ground and passed through 2 mm sieve and mixed thoroughly separately. The experimental soil was clay loam in texture with pH of 7.9. Organic matter and total nitrogen contents were 0.61% and 96.61 mg kg−1 respectively, while P2O5 was 19.82 mg kg−1 and K2O was 80.5 mg kg−1.
2.2 Experimental design
The experiment was carried out by using design RCBD with split plot arrangements having four replications. In addition, a parallel field experiment was conducted by using a local variety, FH-142 (Pakistani cultivar) to compare with Huamian-3109 (Chinese cultivar). All other field operations such as irrigation, herbicide application, and disease and pest control were performed using local standard procedures. No major attack of weeds, disease, pest or inclement weather was recorded during the growing season 2016.
2.3 Sampling and measurement
2.3.1 Cotton phenology, growth, morphological traits and SPAD value
To investigate the overall effects of experimental treatments, five plants were selected after emergence and number of days was recorded at different growth stages to maturity. The number of fruit bearing branches of an individual plant were counted and recorded on 80 DAE (Days after emergence). Regarding morphological traits; leaf area of plants were measured by length width method i.e. taking three leaves (Large, medium and small) from one plant at 40, 80 and 120 DAE. The average leaf area per leaf was calculated and multiplied by a correction factor 0.75. Crop growth rate (CGR), was calculated as given formula (Shah et al., 2017a): Where, W2 and W1 are dry weights of plant at time T1 and T2, respectively.
The chlorophyll contents were measured at 100 DAE by using SPAD (The Soil Plant Analysis Development) meter (Minolta-502) as a hand held device used to record chlorophyll content and absorb light wavelengths of 430–750 nm, as it passes through leaves (Wood et al., 1992).
2.3.2 Cotton biomass and total nitrogen contents
Plants were sampled at 80 and 120 DAE to determine plant dry weight; four plants from each treatment were pulled out from soil and these plant samples were separated into leaves, stem and roots and were enclosed separately. These samples were dried in oven at 70 °C for 48 h and then weighted to measure dry weight with the help of electrical balance (chyo jk −200). For determination of N contents, from each treatment five fully expanded mature leaves were used to measure nitrogen contents. The sample of all plant parts were grounded and pass through a 0.2 mm sieve. Total N concentration was examined by the micro-Kjeldahl (MSGW-MKA) method (Bremner and Mulvaney, 1982).
2.3.3 Cotton fiber quality, yield and yield attributes
Fiber length (mm) was measured by HVI-900 length/strength Module. Fiber strength (g tex-1) was measured by the strength Module-920 of HVI-900A. Numbers of bolls m−2 were recorded from all plants in each treatment at maturity. Average weight per boll was obtained by the yield of seed cotton dividing the total number of bolls picked from that particular plant. Average was calculated as boll weight plant−1. Each mature boll of seed cotton is picked on the fourth day after the opening of the boll, weighed after drying; the total weight is the plant's seed cotton yield. After the seed cotton ginned, the lint yield is obtained of each plant. Bolls (only mature) of each plant was calculated in the last sample.
2.4 Statistical analysis
Data was analyzed with statistically software Statistix 8.1. Graphs were made by Sigma Plot 10.0 software. The comparison of treatment means were compared by least significant difference (LSD) test to quantify the source of variation at 5% (P < 0.05) (Steel et al., 2007).
3 Results
3.1 Cotton phenology
Different PD and N application rate considerably influenced on cotton phenology (Table 2). Among different PD and N application rate, cotton cultivar FH-142 took 43 to 47 days to complete seedling stage. While Huamian-3109 completed seedling stage in range of 47 to 58 days. Among treatments, FH-142 took maximum number of days (47 days) to complete seedling stage under F1 with LPD and F1with MPD while Huamian-3109 took maximum days (58 days) under F2 with HPD to complete seedling stage. In contrast, both cotton cultivars showed varied response for squaring and boll setting stage. FH-142 took more number of days for squaring under F2 with HPD and Huamian-3109 took more number of days for squaring under F2 with MPD and F2 with HPD. For boll setting stage, a non-considerable interaction of PD and N application rate was found in FH-142 while Huamian-3109 was considerably influenced for boll setting stage. Huamian-3109 took maximum number of days for boll setting under F1 with MPD while took least number of days under F2 with high PD (Table 2). In treatment column; F1 is showing low nitrogen application rate 120 kg ha−1, F2 is showing high nitrogen application rate 180 kg ha−1, LPD is showing low planting density (8 plants m−2), MPD is showing medium plant density (10 plants m−2) and HPD is showing high planting density (12 plants m−2). Data in ‘Growth period’ column show the total number of days taken by cotton plants to complete given growth stage. Mean values followed by the same letters are not significantly different using least significance difference test (LSD) at 0.05 probability level.
Treatments
Growing period (d)
Seedling
Squaring
Boll setting
Total duration
FH-142
Huamian-3109
FH-142
Huamian-3109
FH-142
Huamian-3109
FH-142
Huamian-3109
F1LPD
47a
50c
34b
26b
50a
36bc
124a
120abc
F1MPD
47a
47d
30c
26b
49a
43a
124a
120abc
F1HPD
45b
54b
34b
26b
49a
34c
121bc
122a
F2LPD
43c
50c
34b
27ab
51a
33c
122b
117b
F2MPD
44bc
49 cd
33b
28a
51a
39b
120 cd
121a
F2HPD
44bc
58a
36a
28a
49a
24d
119d
118ab
3.2 Cotton growth characteristics
Cotton growth characteristics were responded differently under the influence of different N fertilizer rates and PD. Among cotton cultivars, FH-142 showed better growth as compared to Huamian-3109 but this growth response was varied among different combinations of N fertilizer application and PD (Table 3). Interactive effects of N fertilizer rate and PD showed significant influence on vegetative plant parts. Developments of fruiting branches plant−1 were considerably influenced only in FH-142 by treatments. While Huamian-3109 exhibited non-significant effects of different N levels and planting densities. Pakistani cotton cultivar (FH-142) showed higher but statistically same number of fruiting branches plant−1 under F1 with HPD and F2 with MPD as compared with other treatments. Least number of fruiting branches was observed in FH-142 under F1 with LPD (Table 3). Mean values with in a column followed by the same letters are not significantly different at P < 0.05 according to significance difference test (LSD).
Treatments
Fruiting branches plant−1 Green leaves plant−1
Total leaves plant−1
80 DAE
80 DAE
80 DAE
FH-142
Huamian-3109
FH-142
Huamian-3109
FH-142
Huamian-3109
F1LPD
10.86c
9.23a
20.16c
17.16a
22.86b
19.83a
F1MPD
11.89b
9.70a
24.43abc
19.43a
27.66ab
22.33a
F1HPD
14.10a
9.20a
25.80a
19.6a
28.66a
19.86a
F2LPD
12.36b
9.43a
23.66abc
18.73a
26.16ab
21.23a
F2MPD
14.42a
9.76a
24.73ab
20.46a
27.90a
23.00a
F2HPD
11.96b
9.30a
20.70bc
17.36a
23.83ab
22.16a
Furthermore green leaves plant−1 and total number of leaves were also considerably influenced by different N fertilizer rates and planting densities in both cultivars. Huamian-3109 exhibited higher number of green leaves and total number of leaves plant−1 under F2 as compared with F1(data is not shown). However interaction of N fertilizer application rate and PD showed maximum green leaves and total number of leaves plant−1 under F2 with MPD. On the other hand, FH-142 developed maximum number of green leaves and total number of leaves under F1with HPD. Least number of green leaves and total number of leaves in both cultivars were noted under F1with LPD (Table 3).
3.3 Cotton plant dry biomass, crop growth rate, leaf area and SPAD value
Cotton plant dry biomass and crop growth rate (CGR) was also considerably influenced by PD and N fertilizer levels (Table 4). Cotton cultivar FH-142 produced maximum plant dry biomass in 80 DAE (531.21, 536.54 g m−2) and 120 DAE (1142.1, 1166.16 g m−2) under F1 with HPD and under F2 with MPD respectively while least plant dry biomass production was noted under F1 rate with LPD in both DAE. Nonetheless high CGR (28.54 g m−2 day−1) was noted in FH-142 under F2 with MPD (Table 4). Contrarily, Huamian-3109 showed maximum plant dry biomass at 80 DAE (325.54 g m−2) and 120 DAE (613.43 g m−2) only under F1 with HPD. Least plant dry biomass production was noted under F1 with LPD in 80DAE and in 120 DAE. While in Huamian-3109 higher CGR (14.48 g m−2 day−1) was under F1 with HPD. Least CGR was noted under F1 with LPD in FH-142 and F2 with HPD in Huamian-3109 (Table 4). Mean values with in a column followed by the same letters are not significantly different at P < 0.05 according to significance difference test (LSD).
Treatments
Plant dry biomass (g m−2)
Crop growth rate (g m−2 day−1)
80 DAE
120 DAE
FH-142
Huamian-3109
FH-142
Huamian-3109
FH-142
Huamian-3109
F1LPD
331.76e
228.12f
780.8e
530.09f
14.41e
7.87c
F1MPD
390.32d
248.64d
831.6d
539.42e
22.68c
12.36ab
F1HPD
531.21a
325.54a
1142.1a
613.43a
19.86d
14.48a
F2LPD
407.66b
231.00e
883.2c
577.17d
25.05b
10.12bc
F2MPD
536.54a
307.78b
1166.1a
602.42b
28.54a
12.75ab
F2HPD
395.51c
290.65c
890.5b
595.28c
27.10ab
7.67c
Moreover, leaf area was considerably influenced by PD and N application rate in both cultivars (Table 5). In Pakistani cultivar FH-142 showed that maximum leaf area (217.24 and 231.04 cm2) under F1 with HPD at 80 and 120 DAE respectively. On the other hand Huamian-3109 showed that maximum leaf area (151.88 and 180.70 cm2) under F1 with HPD in 80 and 120 DAE respectively. Among cotton cultivars, Pakistani variety FH-142 developed more leaf area as compared with Chinese variety Huamian-3109. Nonetheless least leaf area in Pakistani cultivar FH-142 was found (152.48 and 161.50 cm2) under F1 with LPD in 80 and 120 DAE respectively. Nevertheless least leaf area in Huamian-3109 was found (95.88 and 130.30 cm2) under F1 with LPD in 80 and 120 DAE respectively (Table 5). Mean values with in a column followed by the same letters are not significantly different at P < 0.05 according to significance difference test (LSD).
Treatments
Leaf area (cm2)
SPAD values
80 DAE
120 DAE
80 DAE
120 DAE
FH-142
Huamian-3109
FH-142
Huamian-3109
FH-142
Huamian-3109
FH-142
Huamian-3109
F1LPD
152.48f
95.88f
161.50e
130.30f
30.51b
32.96b
29.47c
33.67e
F1MPD
179.11d
105.94e
199.52c
138.79d
30.80b
32.53b
28.10c
37.80bc
F1HPD
217.24a
151.88a
231.04a
180.70a
33.10a
34.24a
34.80a
40.71a
F2LPD
173.82e
112.84c
189.15d
154.18c
30.71b
30.55c
29.96c
34.94de
F2MPD
188.86b
124.02b
208.76b
175.95b
33.95a
32.15b
34.50a
38.67b
F2HPD
180.86c
109.81d
199.84c
130.90e
32.47ab
28.67d
32.71b
36.39 cd
In addition, Plant densities and N application rates significantly influenced on SPAD values. Interaction of PD and N showed that FH-142 statistically similar at 80 and 120 DAE under F1 with HPD and under F2 with MPD respectively. Nonetheless, Huamian-3109 exhibited higher SPAD values under F1 with higher PD (Table 5).
3.4 Cotton total nitrogen contents
Different PD and N application rate were considerably influenced on cotton N contents. Interaction of PD and N application rate showed higher contents in FH-142 under F2with medium plant density at different DAE which followed by F1 with high plant density (Fig. 1a). On the other hand, least N contents in FH-142 were observed under F1 with low plant density in all DAE. Nonetheless, Huamian-3109 was affected considerably at different DAE with higher N contents under F1 with high plant density followed by F2 with medium plant density, while least N contents were observed in F1 with low plant density in all DAE (Fig. 1b).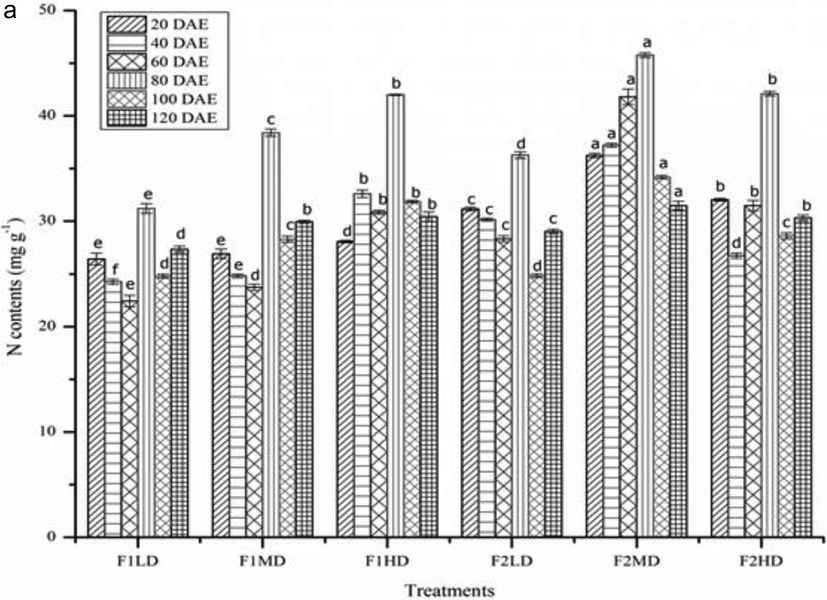
Interactive effects of planting density and nitrogen application rate on total nitrogen contents of FH-142. Mean values with in a column followed by the same letters are not significantly different at P < 0.05 according to significance difference test (LSD).
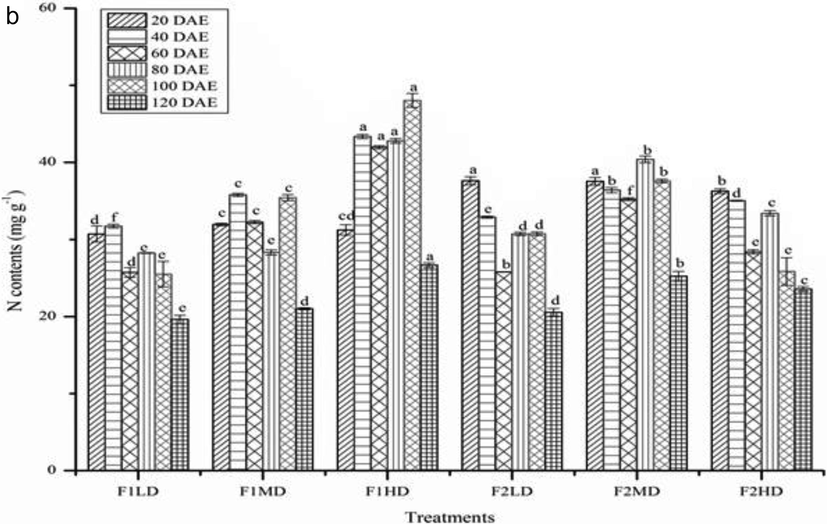
Interactive effects of planting density and nitrogen application rate on total nitrogen contents of Huamian-3109. Mean values with in a column followed by the same letters are not significantly different at P < 0.05 according to significance difference test (LSD).
3.5 Cotton yield and fiber quality traits
Different N application rate and PD significantly influenced on cotton lint and seed cotton yield of both cultivars. Data pertaining to total number of bolls m−2 showed that FH-142 produced highest total number of bolls m−2 (119.81) under F2 with MPD. Furthermore FH-142 produced healthy bolls with highest boll weight (3.4 g and 3.3 g) under F1 with HPD and F2 with MPD respectively. Moreover, FH-142 produced high seed cotton yield (3953 kg ha−1) and lint yield (1820.1 kg ha−1) under F2 with MPD. Nonetheless, least total number of bolls m−2 (60.19), seed cotton yield (1745.6 kg ha−1) and lint yield (611.7 kg ha−1) was observed under F1 with LPD in FH-142 (Table 6). Mean values with in a column followed by the same letters are not significantly different at P < 0.05 according to significance difference test (LSD).
Treatments
Total bolls (m−2)
Boll weight (g)
Seed cotton yield (kg m−2)
Lint yield (kg m−2)
FH-142
Huamian-3109
FH-142
Huamian-3109
FH-142
Huamian-3109
FH-142
Huamian-3109
F1LPD
60.19f
56.04f
2.9bc
2.7b
1745.6e
1513.1f
611.7e
435.6e
F1MPD
79.39d
77.47d
2.8bc
2.9a
2223d
2246.7d
887.7c
651.5c
F1HPD
108.82c
98.83a
3.4a
3.0a
3700b
2965a
1663.5b
978.45a
F2LPD
73.85e
63.24e
3.0b
2.9a
2215d
1834e
686.3d
619d
F2MPD
119.81a
97.56c
3.3a
3.0a
3953a
2926.8b
1820.1a
965.84b
F2HPD
113.83b
97.64b
2.7b
2.7b
3073.4c
2636.4c
887.7c
787.1c
Huamian-3109 showed highest total number of bolls m−2 (98.83 and 97.64) under F1 with HPD and F2 with HPD respectively. Nonetheless, least total no. of bolls m−2 (56.04) was observed under F1 with LPD. While Huamian-3109 produced high seed cotton (2965 kg ha−1) and lint yield (978.45 kg ha−1) under F1 with HPD. Least seed cotton yield (1513.1 kg ha−1) and lint yield (435.6 kg ha−1) was observed under F1 with LPD (Table 6).
Different N fertilizer application and PD significantly influenced on Cotton fiber quality and their related traits. FH-142 showed higher fiber length (31.99 mm) and fiber strength (32.97 g tex-1) under F2 and MPD. Nonetheless, Huamian-3109 showed fiber length of (26.78 mm) and fiber strength (23.16 g tex-1) under F1 with HPD. Moreover, in FH-142 fiber micronaire value was higher (4.89) under F2 with MPD. On the other hand, Huamian-3109, micronaire value was statistically similar under F2 with either PD. Least micronaire values were observed under F1 with LPD in FH-142 and Huamian-3109 (Table 7). Mean values with in a column followed by the same letters are not significantly different at P < 0.05 according to significance difference test (LSD).
Treatments
Fiber length (mm)
Fiber micronaire
Fiber strength (g tex-1)
FH-142
Huamian-3109
FH-142
Huamian-3109
FH-142
Huamian-3109
F1LPD
20.40c
23.87 cd
4.50b
3.43b
19.69b
14.10c
F1MPD
21.87c
24.27bcd
4.51b
3.46b
22.09b
14.12c
F1HPD
24.23bc
26.78a
4.51b
3.49b
26.94bb
23.16a
F2LPD
28.56b
22.50d
4.67b
3.94a
26.54ab
16.60bc
F2MPD
31.99a
25.68abc
4.89a
3.92a
32.97a
16.59bc
F2HPD
27.66b
26.23ab
4.71ab
3.95a
25.66b
19.50b
4 Discussion
From our previous findings we found that F1 (120 kg ha−1) with HPD (12 plants m−2) and/or F2 (180 kg ha−1) with MPD (10 plants m−2) are more productive combination of N and PD in China (Shah et al., 2017a). This study was conducted in the subtropical climatic conditions of Pakistan and a Chinese cultivar (Huamian-3109) was compared with a Pakistani cotton cultivar (FH-142) to further optimize PD and N fertilizer rate and to examine any effect of experiment location on the treatments of different cotton cultivars from different origins.
Cotton phenology in both cultivars was varied under different PD and N application rate. Cotton cultivar FH-142 took 43 to 47 days to complete seedling stage while Huamian-3109 completed seedling stage in range of 47 to 58 days (Table 2) respectively. In contrast, FH-142 took 30–36 days to complete squaring stage after seedling stage while Huamian-3109 took 27–28 days to complete squaring stage. We further noted that though Huamian-3109 took more days and produced more number of squares plant−1 however square shedding rate much higher (data not shown) as compared to FH-142. For boll setting stage, a non-considerable interaction effect of PD and N application rate was found in FH-142 while Huamian-3109 was considerably influenced for boll setting stage. Overall results pertaining to total crop duration showed that, Huamian-3109 took less number of days to reach maturity as compared with FH-142. Although boll setting was unaffected by PD and N application rate in FH-142, however this cotton cultivar took more number of days for boll setting as compared to Huamian-3109, therefore FH-142 produced more number of bolls m−2 and seed cotton yield as compared to Huamian-3109. Our results further supported by the previous study that cotton plant acquired less number days for squaring while took more number of days to complete blooming to boll setting (Shah et al., 2017a, 2021).
Nonetheless, in other studies Bednarz et al. (2006); Dong et al. (2010) demonstrated that high plant population reduced boll weight but enhanced boll numbers per unit area, and therefore increased lint yield in short season cotton. This could be associated with limiting the development of outer bolls and improving boll distribution (Gwathmey and Clement, 2010). However, there was no significant increase in lint yield at higher plant density (Bednarz et al., 2000–, 2003; Dong et al., 2010).
We found varied response of both cotton cultivars to the interaction effects of planting density and N application rate. Considerable interaction effects of different N levels and PD have been observed on number of fruiting branches plant−1. A non-considerable effect of N and PD was noted on fruiting branches in Chinese variety while in Pakistani variety it was influenced considerably. Among cotton cultivars, FH-142 developed more leaf area, and exhibited more green leaves and total number of leaves as compared with Huamian-3109. Our results regarding the differential response of Chinese varieties from different origin are further supported that genetically varieties originated from different climates had quite different response to fertilizer levels for plant growth (Tomar et al., 2000; Walch-Liu et al., 2005).
Furthermore Pakistani variety (FH-142) among treatments showed higher SPAD value, and leaf area in F1with HPD or F2with MPD while plant dry biomass production in F2 with MPD followed by F1with high PD. This may be due to the better translocation and distribution of N in cotton plants, so cotton growth increases compared to other treatments (Dai et al., 2015). Difference among cotton cultivars regarding growth and yield response was due to genetic makeup and could be due to weather conditions. Temperature regimes at this experimental site could also influence the performance of Huamian-3109 as compared to FH-142. Temperature provides the energy for crop plant to adjust the activities of enzymes and trigger corresponding bio-reactions of energy and material conversion such as photosynthesis (Yang et al., 2014). Crop varieties with lower canopy temperature had a higher yield resulted from slower declining tendency in chlorophyll and soluble protein in cotton.
N application rates and PD were significantly influenced on yield and yield traits. Moreover, both cotton cultivars performed variedly under different treatments, FH-142 produced higher seed cotton and lint yield compared to Huamian-3109 under F2with MPD followed by F1 with HPD. Nonetheless, Huamian-3109 produced higher seed cotton and lint yield under F1 with HPD and F2 with MPD as compared to other treatments. Higher seed cotton yield and lint yield was due to development of more number of bolls plant−1 with high boll weight (Aslam et al., 2013; Rochester et al., 2001).
Our results further justified by other studies; both PD and N fertilization rate showed effects on biomass formation of cotton plants and thereby increase cotton yield and nitrogen efficiency (Dai and Dong, 2014). An adequate increase in plant density can also increase seed cotton yield and N efficiency (Dong et al., 2010; Mao et al., 2014). Nonetheless, some studies contradicted that increased in N rate reduce the lint percentage by 0.16%, while increase in boll weight may be due to increase in N rate with current increase in mineral uptake, photosynthetic assimilation and accumulation in sinks (Sawan et al., 2006). Among cotton cultivars FH-142 produced more seed cotton yield and lint yield as compared with Huamian-3109 and the difference was due to variation in the phenology of cotton (Table 2). Cotton fiber quality and related traits were significantly influenced by N application rate and PD (Table 7). Moreover, N application considerably influenced cotton fiber yield and quality, suggesting N as key factor that influence fiber quality considerably (Chen et al., 2016). This is in agreement with others who observed reduced micronaire values with increase in plant density (Bednarz et al., 2005). Bednarz et al., (2003) documented that smaller bolls end to contain smaller seeds with less weight of fibers per seed. Thus, altered within-boll yield components through increased plant density may also affect micronaire.
Different PD and N application rate were considerably influenced on cotton total N contents. Interaction effects of PD and N application rate showed higher N contents in FH-142 under F2 with MPD at different DAE, (Fig. 1a). Total N contents were affected considerably in Huamian-3109 at different DAE showed higher N contents under F1 with HPD at different DAE, (Fig. 1b). Least N contents were observed in F1 with LPD under both cotton cultivars at different DAE. Similar results have been reported that with different planting density, cotton optimizes photosynthetic N use efficiency and photosynthetic capacity by adjusting leaf mass per area, which in turn affected leaf N allocation to the photosynthetic apparatus. However MPD is the optimum PD due to high light utilization efficiency, superior spatial distribution of leaf N allocation to the photosynthetic apparatus and photosynthetic use efficiency of photosynthetic N in leaves within the canopy (Yao et al 2015). Higher yield under MPD could be attributed to an optimal leaf area and increased light interception (Kaggwa-Asiimwe et al., 2013).
5 Conclusions
This study shows that interaction effects of N application rate and PD on growth, yield and N contents in two cotton cultivars. We found that among cotton cultivars, FH-142 (Pakistani variety) performed better as compared with Huamian-3109 (Chinese variety). Among treatments, FH-142 produced high seed cotton and lint yield under MPD (10 plants m−2) with F2 rate (180 kg ha−1) while Huamian-3109 produced higher seed cotton yield and lint yield under HPD (12 plants m−2) with F1 (120 kg ha−1) and under MPD (10 plants m−2) with F2 rate (180 kg ha−1). So this study confirmed and recommended above mentioned N application rate and PD for better growth and yield performance of both Pakistani and Chinese cotton cultivar.
Funding
The National Natural Science Foundation of China was supported and provided funds for this project 31271665.
Acknowledgment
The current work was supported by Taif University Researchers Supporting Project number (TURSP-2020/38), Taif University, Taif, Saudi Arabia.
Declaration of Competing Interest
The authors declare that they have no known competing financial interests or personal relationships that could have appeared to influence the work reported in this paper.
References
- Ahmad, N., 2000. Integrated plant nutrition management in Pakistan: status and opportunities. In: Proc. Symp. Integr plant nutr manag. NFDC, Islamabad, pp. 18–39.
- Seed cotton yield of different cultivars as affected by sowing time under agro-climatic conditions of southern Punjab. Indus. Cotton. 2005;2:186-189.
- [Google Scholar]
- Anonymous. All Pakistan textile mills association. Reports, 2011.
- Effect of different levels of nitrogen and plant population on growth and yield of cotton (Gossypium hirsutum L.) Asian. J. Agri. Biol.. 2013;3:127-132.
- [Google Scholar]
- Bednarz, C.W., May, O.L., Nichols, R.L., 2003. Variability in cotton yield components as related to cultivar and population density. In: Proc. Beltwide Cotton Prod. Res. Conf., Nashville, TN, pp. 6–10.
- Analysis of cotton yield stability across population densities. Agron. J.. 2000;92(1):128-135.
- [CrossRef] [Google Scholar]
- Plant density modifies within-canopy cotton fiber quality. Crop. Sci.. 2006;46(2):950-956.
- [CrossRef] [Google Scholar]
- Yield, quality, and profitability of cotton produced at varying plant densities. Agron. J.. 2005;97:235-240.
- [CrossRef] [Google Scholar]
- Nitrogen total. In: Page A.L., Miller R.H., Keeney D.R., eds. Methods of Soil Analysis, Part 2. Chemical and Microbiological Properties. Madison: ASA; 1982. p. :595-624.
- [Google Scholar]
- Effect of N fertilization rate on soil alkali-hydrolyzable N, subtending leaf N concentration, fiber yield, and quality of cotton. Crop. J.. 2016;4(4):323-330.
- [CrossRef] [Google Scholar]
- Cobley, L.S., 1976. An introduction to the botany of tropical crops. 2nd ed. Longman London, pp. 252–257.
- Manipulation of dry matter accumulation and partitioning with plant density in relation to yield stability of cotton under intensive management. Field Crops Res.. 2015;180:207-215.
- [CrossRef] [Google Scholar]
- Intensive cotton farming technologies in China: Achievements, challenges and countermeasures. Field Crops Res.. 2014;155:99-110.
- [CrossRef] [Google Scholar]
- Effects of plant density and nitrogen and potassium fertilization on cotton yield and uptake of major nutrients in two fields with varying fertility. Field Crop Res.. 2010;119(1):106-113.
- [CrossRef] [Google Scholar]
- Economic Survey of Pakistan, Ministry of Food, Agriculture and Livestock. Economic Advisor Wing: Finance Division; 2010.
- Alteration of cotton source–sink relations with plant population density and mepiquat chloride. Field Crops Res.. 2010;116(1-2):101-107.
- [CrossRef] [Google Scholar]
- Photosynthetic characteristics of boll subtending leaves are substantially influenced by applied K to N ratio under the new planting model for cotton in the Yangtze River Valley. Field Crops Res.. 2019;237:43-52.
- [Google Scholar]
- Chemical Fertilizers, Formulation, and Their Influence on Soil Health. Cham: Springer; 2021. p. :1-15.
- Plant architecture influences growth and yield response of upland cotton to population density. Field Crops Res.. 2013;145:52-59.
- [CrossRef] [Google Scholar]
- Crop growth, light utilization and yield of relay intercropped cotton as affected by plant density and a plant growth regulator. Field Crops Res.. 2014;155:67-76.
- [CrossRef] [Google Scholar]
- Equal K amounts to N achieved optimal biomass and better fiber quality of late sown cotton in Yangtze River Valley. Agronomy. 2020;10(1):112.
- [CrossRef] [Google Scholar]
- The nitrogen stress syndrome. In: Mauney J.R., Stewart J., eds. Cotton Physiology. Memphia Tennessee, USA: The cotton foundation publisher; 1986. p. :91-105.
- [Google Scholar]
- Economic perspectives of major field crops of Pakistan: an empirical study. Pacific Sci. Rev. B: Human. Social Sci.. 2015;1(3):145-158.
- [Google Scholar]
- Estimation of the N fertiliser requirement of cotton grown after legume crops. Field Crops Res.. 2001;70(1):43-53.
- [Google Scholar]
- Response of yield, yield components, and fiber properties of Egyptian cotton (Gossypium barbadense L.) to nitrogen fertilization and foliar-applied potassium and mepiquat chloride. J. Cotton Sci.. 2006;10:224-234.
- [Google Scholar]
- Leaf gas exchange, source sink relationship, and growth response of cotton to the interactive effects of nitrogen rate and planting density. Acta Physiol. Plant.. 2017;39:119.
- [Google Scholar]
- Nitrogen fertilization and Conservation tillage: a review on growth, yield and green- house gas emissions in cotton. Environ. Sci. Pollut. Res.. 2017;24(3):2261-2272.
- [Google Scholar]
- Interactive effect of nitrogen fertilizer and plant density on photosynthetic and agronomical traits of cotton at different growth stages. Saudi J. Biol. Sci.. 2021;28(6):3578-3584.
- [Google Scholar]
- Influence of plant density on cotton response to mepiquat chloride application. Agron. J.. 2006;98(6):1634-1639.
- [Google Scholar]
- Smith, W.C., 1999. Production Statistics. In: Smith, W.C., Cothren, J.T. (Eds.), Cotton, Origin, History, Technology and Production. John Willy and Sons, pp. 435–449.
- Principles and Procedures of Statistics: A Biometrical Approach (3rd ed.). New York: McGraw Hill Book Co; 2007.
- Cotton in the new millennium: Advances, economics, perceptions and problems. Textile Progress.. 2018;50(1):1-66.
- [Google Scholar]
- Response of cotton to various levels of nitrogen and water applied to normal and paired sown cotton under drip irrigation in relation to check- basin. Agric. Water. Manag.. 2008;95(1):25-34.
- [Google Scholar]
- Productivity of upland cotton (Gossypium hirsutum L.) genotypes under different levels of fertility and spacing. Indian J. Agron.. 2000;45:776-781.
- [Google Scholar]
- Signaling mechanisms integrating root and shoot responses to changes in the nitrogen supply. Photosynth. Res.. 2005;83(2):239-250.
- [Google Scholar]
- Defend of cotton nitrogen status with a hand-held chlorophyll meter. J Plant Nutr. 1992;15:1435-1448.
- [Google Scholar]
- Effects of plant density on yield and canopy micro environment in hybrid cotton. J. Integr. Agric.. 2014;13(10):2154-2163.
- [Google Scholar]
- Plant density alters nitrogen partitioning among photosynthetic components, leaf photosynthetic capacity and photosynthetic nitrogen use efficiency in field-grown cotton. Field Crops Res.. 2015;184:39-49.
- [CrossRef] [Google Scholar]


