

Translate this page into:
New Ultra Performance liquid chromatography-mass spectrometric method for the determination of allura red in soft drinks using corncob as solid phase extraction sorbent: Analysis and food waste management approach
⁎Corresponding author. siddiqui124@gmail.com (Masoom Raza Siddiqui)
-
Received: ,
Accepted: ,
This article was originally published by Elsevier and was migrated to Scientific Scholar after the change of Publisher.
Peer review under responsibility of King Saud University.
1 Introduction
Different types of soft drinks are flooded in the stores, some are in powdered form while others are in the liquid form, some carbonated some non-carbonated, some are colorless while others are colorful and imparts a beautiful look. These colorful looks are due to the presence of the synthetic colored compounds that are added to the soft drinks due to different reasons, some time to match the flavor such as yellow colored dyes for lemon drink and red colored dyes for cherry drinks. Conservation of the soft drink products remains another important application and one of the reason for the addition of such dyes (Rovina et al., 2016). Allura red AC (AR), an azo dye, red in color, water soluble with E number E129. Allura red AC has been used in pharmaceuticals, cosmetics, food and several drinks. IUPAC name of the allura red is Disodium 6-hydroxy-5-[(2-methoxy-5-methyl-4-sulfonatophenyl)diazenyl]naphthalene-2-sulfonate. The report by the European food safety agency says that AR consists of two components, first containing disodium 2-hydroxy-1–2-(2-methoxy-5-methyl-4-sulphonato-phenylazo)nephathylene-6-sulphonato along with some subsidiary coloring agent while main noncoloring component comprises of sodium chloride and sodium sulfate (EFSA, 2012). To prevent extreme consumption of AR, regulatory authorities round the globe have proposed guidelines recommending consumption limits of AR. Important regulatory organizations such as US food and drug administration (USFDA), European food safety agencies (EFSA) and Joint, Food and agricultural organization (FAO)/ World health Organization (WHO) Expert Committee on Food Additives (JECFA) recommends acceptable daily intake of 0–7.0 mg kg−1 of the body weight. (http://www.iacmcolor.org/safety-of-color/safety-synthetic-certified-colors/red-40/). Specifically considering non-alcoholic beverages and soft drinks such as ready to drink cordials, instant teas, concentrates of the vending machine, bitter vino, bitter soda etc, EFSA have set a permissible limit of 10–100 mg L−1 of AR (EFSA, 2009).
Allura red AC (AR) in many cases is linked to the toxicity and carcinogenic effect, and is supposed to increase hyperactivity in children (Kobun et al. 2016). Noorafshan et al. concluded that high dose of AR result in impaired memory, loss of the cortex volume and dendritic tree (Noorafshan et al. 2018). Another scientific panel concluded that allergic conditions like asthma and urticarial particularly when mixed with other synthetic coloring agents in foodstuffs (EFSA, 2009). An article reports the studies based on the guidelines of the Organization for Economic Co-operation and Development (OECD), no genotoxicity was observed even at the maximum doses in mice (Honma, 2015). Another report mentioned that although AR was acceptable as additive for human use while in animal feed it is unacceptable. The same report contradicts the previous genotoxic reports related to AR, the authors under the mentioned experimental conditions determined the frequency of micronucleated polychromatic erythrocytes (fMNPCE) and cell proliferation (%PCE). The analyses report suggests that there was no significant difference in micronucleated polychromatic erythrocytes or in % PCE, suggesting non genotoxicity of the AR under the testing conditions (Abramsson-Zetterberg and Ilbäck, 2013).
The content of colorant AR, in the beverages was investigated previously and reported in the literature. Several methods were developed for investigate the amount of the AR in the soft drinks. Spectrophotometry, regarded as an old technique, still prevalent these days owing to its simplicity, fast results and cost effectiveness, the instrument, in the past has been considered for estimation of AR in different matrices including soft drink, (Lopez-de-Alba et al., 1996; Bişgin et al., 2016; Turak and Ozgur, 2013; El-Sheikh and Al-Degs, 2013) food samples (Pourreza et al., 2011, Thani, 2017) and environmental samples (Soylak et al., 2011). Although primitive but still in use, the electrochemical methods too have been applied for the analysis of AR (Yu et al., 2016; Diacu et al. 2015; Alghamdi, 2005; Chanlon et al. 2005; Combeau et al. 2002). In another attempt, electrode modified with multivalued carbon nanotube was employed for the voltammetric determination of AR along with the Brilliant Blue FCF, matrix involving sports drink (Sierra-Rosales et al., 2019).
High performance liquid chromatography is one of the extensively used technique for the estimation of the content of the food dyes, AR has been assayed by HPLC in various matrices (Wu et al., 2013; Ma et al., 2012; Asci et al., 2016, Vlase et al., 2014). Allura red along with some other red dyes such as azorubine, amaranth, erythrosine and ponceau 4R were determined in food samples by HPLC, where extraction of the dyes was based on the vortex assisted deep eutectic solvent dispersive liquid–liquid microextraction (VA-DES-DLLME. The recoveries of the analyses were found in between 94.2 and 100.8% (Faraji, 2019).
With the introduction of modern analytical techniques, analyst have moved toward modern hyphenated techniques for the qualitative and quantitative analysis of food dyes. Allura red has been analyzed in several matrices by the hyphenated systems such as Liquid Chromatography-Mass Spectrometry in chili powder (Tsai et al., 2015), Chinese dishes and urine (Li et al., 2017), Wine (Zhang et al., 2015), Cosmetics (Xian et al., 2013) and soft drinks (Feng et al., 2011). Different techniques involved in the determination of AR have their own advantages and disadvantages. In spectrophotometric determination sometime quick results are obtained while in other cases the reaction may take longer time. HPLC in comparison with other chromatographic techniques is found to be efficient and quick however analysis time can be as long as 10 to 30 min. Sensitivity is also an issue with certain compounds in HPLC determination. Electrochemical methods are although old but they are cheaper as compared to the modern hyphenated techniques and are used in several laboratories. Hyphenated techniques are advantageous in terms of analysis time, sensitivity and selectivity. However, high cost is associated with such instruments.
Considering the significance of the AR and its related health issues it becomes essential to determine the amount of AR in the soft drinks, although few methods are available for its determination, the offered method with give an alternate method to the readers. Current communication reports the development and validation of new UPLC-MS method. The developed method was applied for determination of AR in soft drinks. Simultaneously, for the extract of the dye from the soft drinks, solid phase extraction process was used where, waste corncob was used as the sorbent for the extraction process.
2 Materials and methods
Allura red, used as standard was procured from Sigma Chemicals Co. (St. Louis, MO, USA). Solvents such as methanol, ethanol, acetonitrile, dichloromethane, ammonia used throughout extraction, method development process and finally as mobile phase composition were purchased from British Drug House (BDH, Poole, England). Hydrogen peroxide used as oxidant for the treatment of sorbent was obtained from Merck, Germany
Deionized water used throughout the experiment was obtained from the Milli Q system. Corncob was obtained as waste after consumption of roasted corn of Indian origin. Mobile phases for the analysis of AR is composed of methanol and water. Prior to its use, mobile phase was degassed and filtered.
Supelco vesiprepTM solid phase extraction assembly was used for the AR extraction from the soft drinks. The assembly comprises of extraction columns, coupling pieces, stopcocks, chamber where effluent is collected and vacuum manifold. Stock solution (50 mg l−1) was prepared and was further diluted as per the requirements of preparing the calibration samples and establishing the calibration range.
Analysis of the AR was accomplished on the Aquity® Ultra Performance liquid chromatography (UPLC) system, manufactured by Waters® Manchester, UK. The LC system also equipped with quaternary pump (Waters, Milford, Mass, USA). The liquid chromatographic system includes binary solvent manager, column heater and sample manager, although the column heater was not used during the experiment yet, the sample chamber was maintained at 10 °C. BEH C18 column length (50 × 2.1 (mm), particle size: 1.7 µm) was used during the determination experiments. Other constituent of the hyphenated system includes electrospray ionization source (ESI, Z-spray) and Quattro Premier triple quadrupole mass analyzer. During the optimization of the LC experimental conditions it was ascertained that the best results were achieved when the methanol and water were used as contributors of the mobile phase with mobile phase flowing at the rate of 0.15 mL min−1. The sample volume, after optimization was fixed at 3 µL. Similarly, the mass spectrometric parameters were also varied optimized using negative ionization mode (ESI−) while selected ion recording (SIR) was adopted for data acquisition. The optimized MS parameters include but not limited to, were capillary voltage, cone voltage, source temperature, desolvation temperature.
Stock solution was prepared by taking 25 mg of AR in 500 mL of water resulting in 50 mg L−1 solution. This prepared stock AR solution was further diluted with the same solvent to prepare working solutions of 0.05 mg L−1, 0.1 mg L−1, 0.3 mg L−1, 0.5 mg L−1 0.7 mg L−1, 0.9 mg L−1, 1.1 mg L−1, 1.3 mg L−1, 1.5 mg L−1 and 2.0 mg L−1. The lowest concentration of the working solution was prepared by adding 50 µL of the stock solution in to make a final volume of 50 mL. The working solutions were further used to construct the calibration curve. The AR stock solution and the working solutions were stored in the refrigerator. Prior to the injection into the instrument all the samples were filtered through the syringe filter (0.22 µm).
2.1 Preparation of the sorbent material for solid phase extraction (SPE)
In current communication corncob waste has been utilized as sorbent for solid phase extraction. Published reports reveal that the bio sorbents have been used previously as sorbents in SPE for the determination of dyes in different matrices (Karatepe et al., 2015; Khan et al., 2014). In addition, corncob too has been utilized for the removal of azo dyes (Jiménez et al., 2017). In an attempt to prepare the sorbent, waste corncob was cut into small sections, grounded and sieved to uniformed particle size. The grounded and sieved adsorbent was treated with hydrogen peroxide (H2O2), whole content was heated on water bath shaker at 50 °C along with shaking at 100 rpm for 1 h. Hydrogen peroxide is used as oxidizing agent, required to dissolve amorphous cellulose and lignin (Kucharska et al., 2018) and to decompose organic content (Khan et al., 2017) present in the sorbent biomass. Finally, the H2O2 treated content was subjected to washing so as to get rid of the traces of the hydrogen peroxide. The biomass thus obtained was dried in the oven at 65 °C for 24 h, again sieved to uniform sized sorbent and kept in a sealed plastic container for further use.
2.2 Sample extraction
Four carbonated soft drinks brands taken for determination, all but one drink brands were purchased from the local store/market while one was fetched from Indian store. Prior to the analysis these drinks were emptied in a glass beaker of 500 mL volume, drinks were sonicated and diluted as required. In preparation of the extraction, 0.2 g of the corncob bio sorbent was placed between coupling pieces was taken in empty 6 mL column. The column was then washed with distilled water and was dried under vacuum for fifteen minutes. The soft drink samples after sonication were then passed through the SPE column at the rate of 1 mL per minute. Then the bio sorbent was washed using the deionized water and dried. The adsorbed dye was then eluted using basic methanol solution (Methanol: Ammonia; 95:05, v/v) at the similar flow rate. The eluted content was then evaporated, dried and finally, AR was preconcentrated and evaluated quantitatively using UPLC- MS.
2.3 Method validation
Any newly developed method must be validated with an aim to confirm its authenticity and its capability to serve the intended purpose. In the current study, a method development experiment was performed, so it is essential to validate the procedure before further applying it to the beverage samples so that the accurate results can be achieved. The method developed was validated considering different parameters including specificity, system suitability, linearity, sensitivity, limit of detection/quantitation and finally accuracy and precision.
System suitability remains an essential part of the liquid chromatographic analysis which is significant parameter to check the reproducibility of the chromatographic method is acceptable enough for the analysis being performed. The chromatographic analysis comprises of equipment, software and samples thus this parameter is essential to evaluate the overall working of the whole system involved. This study was accomplished using 0.8 mg L−1 of the AR.
The term linearity refers to the relationship with in a specific range, where the analyte concentration is proportional to its signal either in the calibration sample or in sample that contain the matrix constituent. The stock solution of AR was diluted and calibration samples of 0.05 mg L−1, 0.1 mg L−1, 0.3 mg L−1, 0.5 mg L−1, 0.7 mg L−1, 0.9 mg L−1, 1.1 mg L−1, 1.3 mg L−1, 1.5 mg L−1 and 2.0 mg L−1 samples were prepared and the response, in terms of peak area was recorded.
Precision experiments were used to ascertain the accuracy and the precision of the offered UPLC-MS method. Three different concentrations of pure AR were taken and six replicate analysis of the same were done on same day also called intraday precision while similar analysis with similar number of replicates were performed on three different days (interday precision). Accuracy was ascertained using the recovery studies. Allura red was subjected to accuracy and precision studies at 0.125 mg L−1, 0.8 mg L−1 and 1.0 mg L−1 which represent lower middle and the higher concentration points within the linear range.
Both limit of detection (LOD) and limit of quantitation (LOQ) are important validation parameters. In the current communication, LOD and LOQ were ascertained using the signal to noise (S/N) ratio method.
To validate the consequences of minor but deliberate variation in the experimental conditions, robustness studies were performed by varying mobile phase ratio, column temperature, different column and variation in the flow rates.
3 Result and discussion
3.1 Method development and optimization (LC-MS)
With the advent of the faster analytical technique, such as the UPLC, the sample analysis time has drastically been reduce and simultaneously it has positive influence on the sensitivity and resolution (Khan et al., 2014). Starting with the analytical columns, different conditions such as mobile phase composition, sample injection volume, run time etc. were investigated in a challenge to get the best results. C8 and C18 were employed for trial purpose considering their ability to provide wide pH operating range, good peak shape and excellent MS sensitivity. C18 column provided the finest results. For the mobile phase selection, different organic solvents such as methanol, ethanol, acetonitrile were tried along with water. Allura red peak appeared with all the solvents and water were used as mobile phase but the shapes were not encouraging for quantitative analysis purposes. Formic acid in varied concentrations were also tried but failed to get enthusiastic result. However, among the organic modifiers, best initial results were acquired when methanol and water were selected as mobile phase constituent. This combination was further optimized. Mobile phase composition plays a significant part in getting the best peak out of the preliminary results. In current study, the contribution of the organic modifier in the mobile phase was varied. When methanol and water were taken in equal ratio the peak shape was broader with less peak area with a longer retention time, further increasing the participation of the organic contributor there was a significant decrease in run time with a remarkable peak shape difference however, the sensitivity still remained the concern. However, a mobile phase composition with 95% contribution of methanol and 5% that of water produced best peaks in terms of sensitivity, shape, height and width. Run time was also optimized to check the elution of the interfering compound and carryover. For this the sample was allowed to run for more than three minutes. However, in addition to the peak of the target compound no other peaks were seen, eliminating the possibility of the elution of any sort of the interfering compound. Thus to minimize the wastage of the solvent, run time of one minute was selected which is more than double the retention time of the AR and also no other peaks appeared after 0.47 minute. Injection volume throughout the analysis was fixed at 3 µL.
MS conditions were also optimized using the standard AR solution. Allura red standard solution of 5 mg L−1 was infused into the mass spectrometer and the experiments were tried out both in the positive and negative ionization mode. The target analyte was not detectable at the specified mass to charge ratio in positive ionization mode. However, by changing the polarity, precursor ion at m/z 225 was obtained, the same has been previously used for the analysis of AR (Tsai et al., 2015). After ensuring the stability of the target analyte by suitably tuning the MS parameters, full ion acquisition was performed in mass to charge range of 0–575 to check the fragmentation pattern of AR. The experiments were performed in SIR mode. MS tuning conditions were also optimized and are summarized in Table 1.
S. No
Parameter
Values
01.
Capillary voltage (kV)
3.30
02.
Cone voltage (v)
26
03.
Extractor voltage (v)
0
04.
RF Lens (V)
0.0
05.
Source temperature (°C)
120
06.
Desolvation temperature (°C)
126
07.
Desolvation gas flow (L/h)
500
08.
Cone gas flow (L/h)
50
09.
LM resolution 1
15.0
10.
HM resolution 1
15.0
11.
Ion energy
0.5
12.
Gain
1.0
3.2 Method validation
Once the LC and the MS conditions are optimized, the developed method was validated considering the parameters mentioned in the experimental section. Before starting the full method validation, “confirmation of identity” of the target compound was established using the mass spectrometry. The same was performed by infusing 5 mg L−1 of AR into the mass spectrometer at the optimized MS conditions and subsequently the spectra were obtained which confirmed the identity of the target compound as AR (Fig. 1). The onset of the validation experiments takes place with checking the suitability of the system which is one of the parameters to ensure data quality. The test was performed by analyzing six different samples of AR (0.8 mg L−1) and verifying its signal response, signal stability. Uniform peak height and stable peak area were observed throughout the six replicates and the RSD of peak area was found to be 1.95%. The results confirm the suitability of the system prior to the analysis. Standard chromatogram of the AR along with its corresponding mass spectra is mentioned in Fig. 2. Moving further, the standard stock solution was diluted and ten different working solutions viz 0.05 mg L−1, 0.1 mg L−1, 0.3 mg L−1, 0.5 mg L−1, 0.7 mg L−1, 0.9 mg L−1, 1.1 mg L−1, 1.3 mg L−1 1.5 mg L−1 and 2 mg L−1 were prepared and all the solutions were subjected to linearity studies. The calibration graph was prepared by plotting the peak area versus the concentration of the AR which shows a linear response (R = 0.9987) in the range of 0.05 mg L−1 to 1.3 mg L−1, after which a deviation from linearity was observed therefore while preparing the calibration plot the two data were removed and all further studies were performed within the range of 0.05 mg L−1 to 1.3 mg L−1. The resulting linear regression equation was found to be A = 111550C + 4204.7. Where A is the peak are and C is the concentration of the target analyte. Accuracy and precision were established by analyzing the content of the AR by the developed analytical procedure at three concentration levels (lower, middle and the higher) within the linear range. For this six replicates of the AR were determined at 0.125 mg L−1, 0.8 mg L−1 and 1.0 mg L−1 concentration points for one day as well as for three consecutive days, former being the intra-day precision while the later designated as inter-day precision. The statistical analysis of the data was performed and the results show that relative standard deviation, standard deviation and the mean recovery obtained during the precision studies were acceptable and satisfactory. The results are summarized in Table 2, which show that % RSD at all the three concentration points for both intra-day and inter-day precision was found in the range of 0.72 to 2.84. The recovery for the same study was found in the range of 99.90% to 101.50%. Limit of detection and quantitation study were performed considering the signal to noise ratio. Six replicated of the blank and similar number of the standard samples were subjected to analysis. The results reveal that the LOD and LOQ were found to be 0.0120 mg L−1 and 0.0363 mg L−1, respectively. Robustness studies were also performed which shows that small variation in the mobile phase composition, change in the column, small change in the auto sampler temperature resulted in negligible effect on the analyses of AR.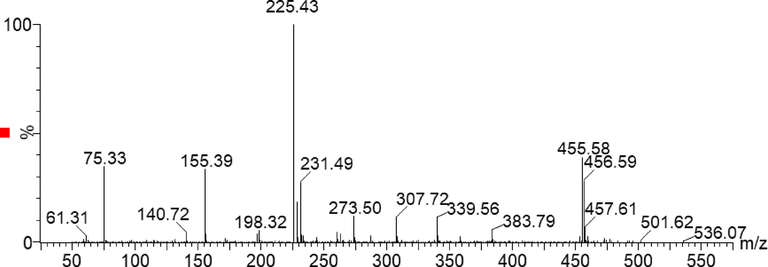
Full ion spectra of allura red.
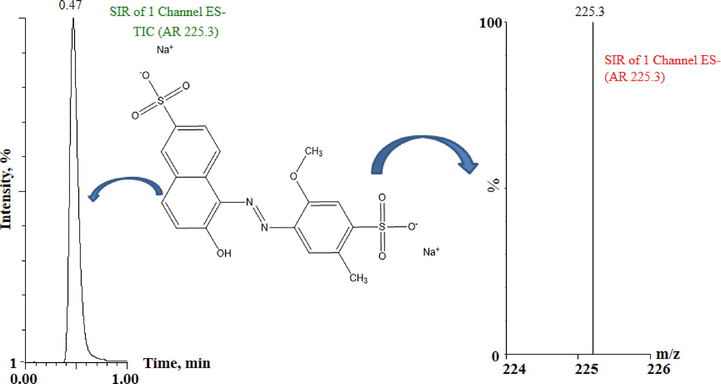
Standard Chromatogram along with corresponding mass spectra of allura red.
Proposed procedure
Amount of allura red (mgL−1)
RSD
Recovery
% SAE
Taken
Found ± S.D
(%)
(%)
Intra-day Precision
0.125
0.126 ± 0.003
2.50
100.80
0.001
0.8
0.812 ± 0.006
0.720
101.50
0.002
1.0
1.004 ± 0.019
1.87
100.40
0.008
Inter-day Precision
0.125
0.126 ± 0.004
2.84
100.80
0.002
0.8
0.805 ± 0.015
1.82
100.63
0.006
1.0
0.999 ± 0.027
2.70
99.90
0.011
3.3 Characterization of the SPE sorbent
The sorbent was subjected to characterization, pre and post adsorption. The corncob (CC) sorbent was subjected to characterization using Fourier-transform infrared spectroscopy (FTIR). The FTIR analysis of the CC material is performed for identifying the reactive components present in its surface. The FTIR spectrum associated with the CC adsorbent indicated peaks relative to various functional groups (Fig. 3). The absorbance peaks at various wavenumbers in the spectrum corresponds to the individual functional groups.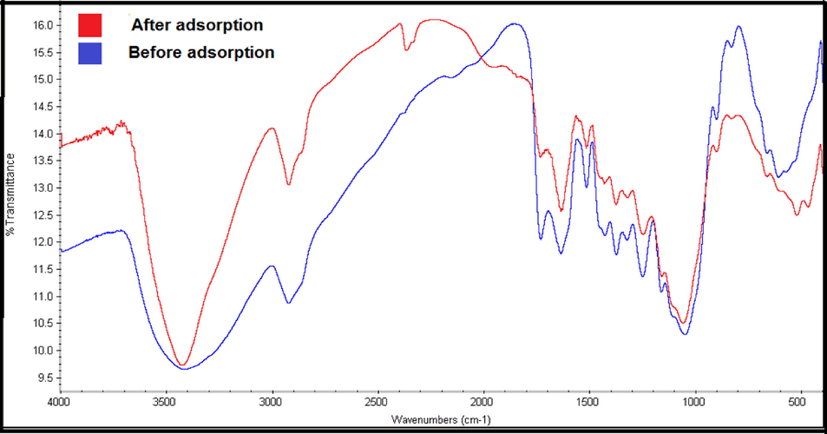
FTIR spectra of allura red before and after adsorption on corncob sorbent.
The peak observed at 3440 cm−1 corresponds to O–H stretching vibrations that confirms the presence of hydroxyl groups of alcohol and phenols which confirms the presence of significant amount of lignocellulose and carbohydrates compounds in the biosorbents (Reddy et al., 2012) The band near 2940 cm−1 indicates C–H stretching that indicates the presence of alkanes. 1060 cm−1 describes C–O stretching vibrations which might arises due to the presence of alcohols and phenols of cellulose and hemicellulose, and the peak at 609 cm−1 reflecting characteristics of C–H bending. The peak at 1640 is arises because of C=C bending and indicates the presence of aromatic compounds of lignin (Anukam et al. 2017). These functional groups might be responsible for the adsorption of AR.
After AR adsorption on corncob biomass, a slight shift or decrease in the spectral peaks was observed, which indicates the participation of the corresponding functionalities in the adsorption. The peak at 2390 cm−1 appeared after dye adsorption on the biomass surface, probably due to the presence of C-O moieties on the biomass surface and confirms the adsorption of the dye. It can also be assumed that the C–O functionalities present in the surface of CC were primarily responsible for binding negatively charged AR through electrostatic forces and it can be confirmed from the appearance of sharp and higher peak with slight red shift at 1080 cm−1. In addition, the band at 1660 cm−1 possibly due to the interaction between negatively charged O2 atom of dye and the sp2 carbon of the corncob.
3.4 SPE method optimization
To the best of our information, corncob was never used previously as a sorbent in solid phase extraction of AR therefore, the conditions needs to be optimized for effective extraction. Preliminary studies were performed in a batch process to verify the effectiveness of the sorbent. After the enthusiastic preliminary results, experiments were conducted on solid phase extraction assembly taking corncob as sorbent. The flow rate of the SPE was also optimized, it was observed that at higher flow rate the extraction efficiency decreased considerably, thus 1 mL per minute was considered as optimum. Selection of the extracting solvent is one of the most important task of SPE method, to select the most effective solvent for the AR recovery several solvents such as methanol, ethanol, acetonitrile, dichloromethane were tried for the desorption studies and it was found that none of the solvents were able to effectively extract AR from corncob sorbent. However, when methanol and acetonitrile were made basic either with ammonia or with sodium hydroxide the results were quite different and desorption of AR was witnessed. However, the recovery was best when methanol, ammonia solution (95:05, v/v) was used as an extracting solvent. Before the start of the extraction process, the role of the pH on the adsorption efficiency was also checked and it was found that at pH 2.8, corncob adsorbent showed maximum adsorption of the AR. pH plays an important role in the adsorption of the allura red AC. The structure of the AR suggest that it is a negatively charged dye and at lower pH there is abundance of H+ ion in the solution. So at the lower pH solution interface is marked by increase in positive charge and the adsorbent surface tend to appear positive charge which result in high adsorption of AR at lower pH. So individual sample post sonication was adjusted to 2.8 before the start of the SPE procedure.
3.5 Application of the developed UPLC-MS method
The developed method was applied for the determination of AR in soft drinks. Four different brands of the carbonated drinks were used for the determination. Allura red in carbonated drinks was found in the range of 8.32 mg L−1 to 22.07 mg L−1. The results are mentioned in Table 3. Further, the developed method was compared to the reported method (Bişgin et al., 2016) which was found to be more sensitive than the current method in terms of detection and quantitation limits. The current method involves sophisticated instrumentation where the determination of allura red is based on its molecular weight and the target analyte is determined even if interferants are present at the same retention time as that of the analyte which is not possible in case of spectrophotometric analysis. It also utilizes cheap adsorbent derived from waste while the reported method utilizes commercial resins for extraction process while the reported paper utilizes the commercial adsorbent.
Number
Type of drink
Flavor
Amount of allura red found (mgL−1) ± RSD
Sample 1
Carbonated
watermelon
8.32 ± 1.85
Sample 2
Carbonated
cherry
8.95 ± 1.43
Sample 3
Carbonated
Strawberry-1
16.64 ± 1.66
Sample 4
Carbonated
Strawberry-2
22.07 ± 1.07
4 Conclusion
UPLC-MS method was developed for the estimation of allura red in soft drinks. The developed method is fast and required only one minute of chromatographic analysis time which ultimately turns economical as it saves a significant amount of the solvents and time. The sample preparation does not require pretreatment steps. However, extraction process remains an integral part of the procedure which is significant to rule out any sort of the interference from the matrix as pure adsorbed dye is eluted from the sorbent. The method was applied to carbonated drinks and the results shows that the AR in the investigated drinks was found in the range of 8.32 mg L−1 to 22.07 mg L−1
Acknowledgement
The authors would like to extend their sincere appreciation to the Deanship of Scientific Research at King Saud University for funding this work through Research Group No. RG-1437-031.
Authors declare no conflict of interest
References
- The synthetic food colouring agent Allura Red AC (E129) is not genotoxic in a flow cytometry-based micronucleus assay in vivo. Food Chem. Toxicol.. 2013;59:86-89.
- [Google Scholar]
- Determination of allura red in some food samples by adsorptive stripping voltammetry. J. AOAC Int.. 2005;88:1387-1393.
- [Google Scholar]
- Studies on Characterization of Corn Cob for Application in a Gasification Process for Energy Production. J. Chem. 2017 Article ID 6478389
- [CrossRef] [Google Scholar]
- Development and Validation of HPLC Method for the Simultaneous Determination of Five Food Additives and Caffeine in Soft Drinks. Int. J. Anal. Chem. 2016
- [CrossRef] [Google Scholar]
- Solid-phase extraction and spectrophotometric determination of Allura Red (E129) in foodstuff, soft drink, syrup and energy drink samples: a comparison study. Inter. J. Food. Sci. Technol.. 2016;51:2367-2375.
- [Google Scholar]
- Identification and simultaneous determination of Azorubin, Allura red and Ponceau 4R by differential pulse polarography: application to soft drinks. Talanta. 2002;56:115-122.
- [Google Scholar]
- Determination of Carmoisine, Allura red and Ponceau 4R in sweets and soft drinks by Differential Pulse Polarography. J. Food Comp. Anal.. 2005;18:503-515.
- [Google Scholar]
- Voltammetric techniques for determination of Allura Red AC synthetic pigments in Beverages. Rev. Chim-Bucharest. 2015;66:1100-1104.
- [Google Scholar]
- Spectrophotometric determination of food dyes in soft drinks by second order multivariate calibration of the absorbance spectra-pH data matrices. Dyes Pigm.. 2013;97:330-339.
- [Google Scholar]
- Scientific Opinion on the re-evaluation of Allura Red (E 129) as a food additive. EFSA J.. 2009;7:1327-1363.
- [Google Scholar]
- Panel on additive and products or substances used in animal feed (FEEDAP), Scientific opinion on the safety and efficacy of Allura Red AC (E129) in feed for cats and dogs. EFSA J.. 2012;10(5):2675.
- [Google Scholar]
- Determination of some red dyes in food samples using a hydrophobic deep eutectic solvent-based vortex assisted dispersive liquid-liquid microextraction coupled with high performance liquid chromatography. J. Chromatogr. A. 2019;1591:15-23.
- [Google Scholar]
- Highly sensitive and accurate screening of 40 dyes in soft drinks by liquid chromatography-electrospray tandem mass spectrometry. J. Chromatogr. B Analyt. Technol. Biomed. Life Sci.. 2011;879:1813-1818.
- [Google Scholar]
- Evaluation of the in vivo genotoxicity of Allura Red AC (Food Red No. 40) Food Chem. Toxicol.. 2015;84:270-275.
- [Google Scholar]
- Jiménez, S., Velásquez, C., Mejía, F., Hormaza, A., 2017. Removal of the Mixture of Azo Dyes Allura Red - Tartrazine by Adsorption onto Corncob. In: Proceedings of the International Conference of Recent Trends in Environmental Science and Engineering (RTESE'17). Toronto, Canada Paper No. 141DOI: 10.11159/rtese17.141
- Solid-phase extraction of some food dyes on sea sponge column and determination by UV–vis spectrophotometer. Desalin. Water Treat.. 2015;57:25822-25829.
- [Google Scholar]
- Pretreatment of Lignocellulosic Materials as Substrates for Fermentation Processes. Molecules. 2018;23:2937.
- [CrossRef] [Google Scholar]
- Quantitative determination of methylene blue in environmental samples by solid-phase extraction and ultra-performance liquid chromatography tandem mass spectrometry: a green approach. RSC Adv.. 2014;4:34037-34044.
- [Google Scholar]
- Dodecyl sulfate chain-anchored mercerized lignocellulose agro-waste: an effective and sustainable adsorbent to sequester heavy metal ions from an aqueous phase. Environ. Prog. Sustainable Energy. 2017;36(6):1676-1684.
- [Google Scholar]
- New LC-MS/MS Method for the Analysis of Allura Red Level in Takeaway Chinese Dishes and Urine of an Adult Chinese Population. J. Agr. Food Chem.. 2017;65:2588-2593.
- [Google Scholar]
- Spectrophotometric determination of Allura Red (R40) in soft drink powders using the universal calibration matrix for partial least squares multivariate method. Anal Chim Acta. 1996;330:19-29.
- [Google Scholar]
- Simultaneous determination of 20 food additives by high performance liquid chromatography with photo-diode array detector. Chin. Chem. Lett.. 2012;23:492-495.
- [Google Scholar]
- High Dose Alllura Red, rather than the ADI dose, induce structural and behavioral changes in the medial prefontal cortex of rats and taurine can protect it. Acta Histochem. 2018;120:586-594.
- [Google Scholar]
- Determination of Allura red in food samples after cloud point extraction using mixed micelles. Food Chem.. 2011;126:1465-1469.
- [Google Scholar]
- Optimization of Cd(II), Cu(II) and Ni(II) biosorption by chemically modified Moringa oleifera leaves powder (2012) Carbohydr. Polym.. 2012;88:1077-1086.
- [Google Scholar]
- Extraction, Analytical and Advanced Methods for Detection of Allura Red AC (E129) in Food and Beverages Products. Front. Microbiol.. 2016;7:798.
- [CrossRef] [Google Scholar]
- MWCNT-modified Electrode for Voltammetric Determination of Allura Red and Brilliant Blue FCF in Isotonic Sport Drinks. Electroanalysis. 2019;31(5):883-890.
- [Google Scholar]
- Spectrophotometric determination of trace levels of allura red in water samples after separation and preconcentration. Food Chem. Toxicol.. 2011;49:1183-1187.
- [Google Scholar]
- Simultaneous determination of Allura Red and Ponceau 4R in drinks with the use of four derivative spectrophotometric methods and comparison with high-performance liquid chromatography. J. AOAC Int.. 2013;96:1377-1386.
- [Google Scholar]
- A Simple Spectrophotometric Evaluation Method of Allura Red (E129) in Several Food Samples Using Cloud Point Extraction. Al-Mustansiriyah J. Sci.. 2017;28:134-140.
- [Google Scholar]
- Determination of 20 synthetic dyes in chili powders and syrup-preserved fruits by liquid chromatography/tandem mass spectrometry. J. Food Drug Anal.. 2015;23:453-462.
- [Google Scholar]
- Development and Validation of an HPLC-UV method for determination of synthetic food colorants. Rev. Roum. Chim.. 2014;59:719-725.
- [Google Scholar]
- A rapid shaking-based ionic liquid dispersive liquid phase microextraction for the simultaneous determination of six synthetic food colourants in soft drinks, sugar- and gelatin-based confectionery by high-performance liquid chromatography. Food Chem.. 2013;141:182-186.
- [Google Scholar]
- Simultaneous determination of 11 restricted dyes in cosmetics by ultra high-performance liquid chromatography/tandem mass spectrometry. Anal. Met.. 2013;5:1965-1974.
- [Google Scholar]
- Detection of allura red based on the composite of poly (diallyldimethylammonium chloride) functionalized graphene and nickel nanoparticles modified electrode. Sens. Actuator B-Chem.. 2016;225:398-404.
- [Google Scholar]
- Simultaneous Determination of Seven Synthetic Colorants in Wine by Dispersive Micro-Solid-Phase Extraction Coupled with Reversed-Phase High-Performance Liquid Chromatography. J. Chromatogr. Sci.. 2015;53:210-218.
- [Google Scholar]


