

New insights into the contribution of gravity data for mapping the lithospheric architecture
⁎Corresponding author. khassanein@ksu.edu.sa (kamal Abdelrahman)
-
Received: ,
Accepted: ,
This article was originally published by Elsevier and was migrated to Scientific Scholar after the change of Publisher.
Peer review under responsibility of King Saud University.
Abstract
Amongst all the potential field methods, gravity data constitutes the frequently measured geophysical information for deep seated lithospheric structures. The present work aims to outline the structural pattern, the main basins of Sinai and the depths to both Conrad and Moho discontinuities (CMD) by utilizing the gravity data. Several basins were depicted based on high-pass filtered gravity map and much of them are in a close agreement with the former studies. Additionally, the dominant fault trends are NE, NW, EW and ENE. An empirical equation was applied to low-pass-filtered gravity data to estimate the depth of the CMD. However, the thickness of the sedimentary basins increases northwards, reaching approximately 8 km, the minimum depths of Conrad and Moho discontinuities were attained in the northern compartments to be about 18 and 31 km respectively. Meanwhile, far a way to the south, the maximum detectable depth of Conrad and Moho discontinuities are 21 and 37 km. Eventually, 2D gravity modeling was constructed and constrained by 15 drilled wells and the calculated depth of CMD to figure out the comprehensive lithospheric geometry beneath Sinai Peninsula.
Keywords
Gravity
Sinai
Moho
Conrad and 2D modeling

1 Introduction
Sinai Peninsula includes the country’s highest mountain (Mount Catherine; 2637 m). Geographically, it lies partly within Asia continent. The peninsula has a triangular shape and surrounded by water (the Red and Mediterranean Seas, the Gulf of Suez (GOS) and Suez Canal, as well as the Gulf of Aqaba (GOA) from all directions except the northeastern part that includes the border between Gaza and Israel (Fig. 1). Altogether, Sinai Peninsula covers an area of nearly 61,000 km2. It is divided into two primary regions. The northern portion has mostly semi-flat Paleozoic-and-younger sediments, while the southern one contains metamorphic and igneous rocks of Precambrian age. Because of the attractive geology of Sinai Peninsula, many geological and geophysical researchers (e.g., Shata, 1956, 1992; Said, 1962; Smith, 1971; El-Shazly et al., 1974; Bartov et al., 1980; Tealeb and Riad, 1986; Meshref, 1989; Aal et al., 1992; Omran et al., 2001; Rabeh, 2003; Khalil and Santos, 2013; Saada et al., 2020) have studied its tectonic history and structural provinces. The main structure of the sedimentary succession has a gentle northward dip interrupted in two wide areas. The first area lies North at latitude 30°N, where Sinai is intersected by a belt of strongly folded structures, oriented mostly NE-SW. The second is the western portion, where Sinai is affected by rift faulting that forms a portion of the GOS graben and the left lateral faulting of the GOA.
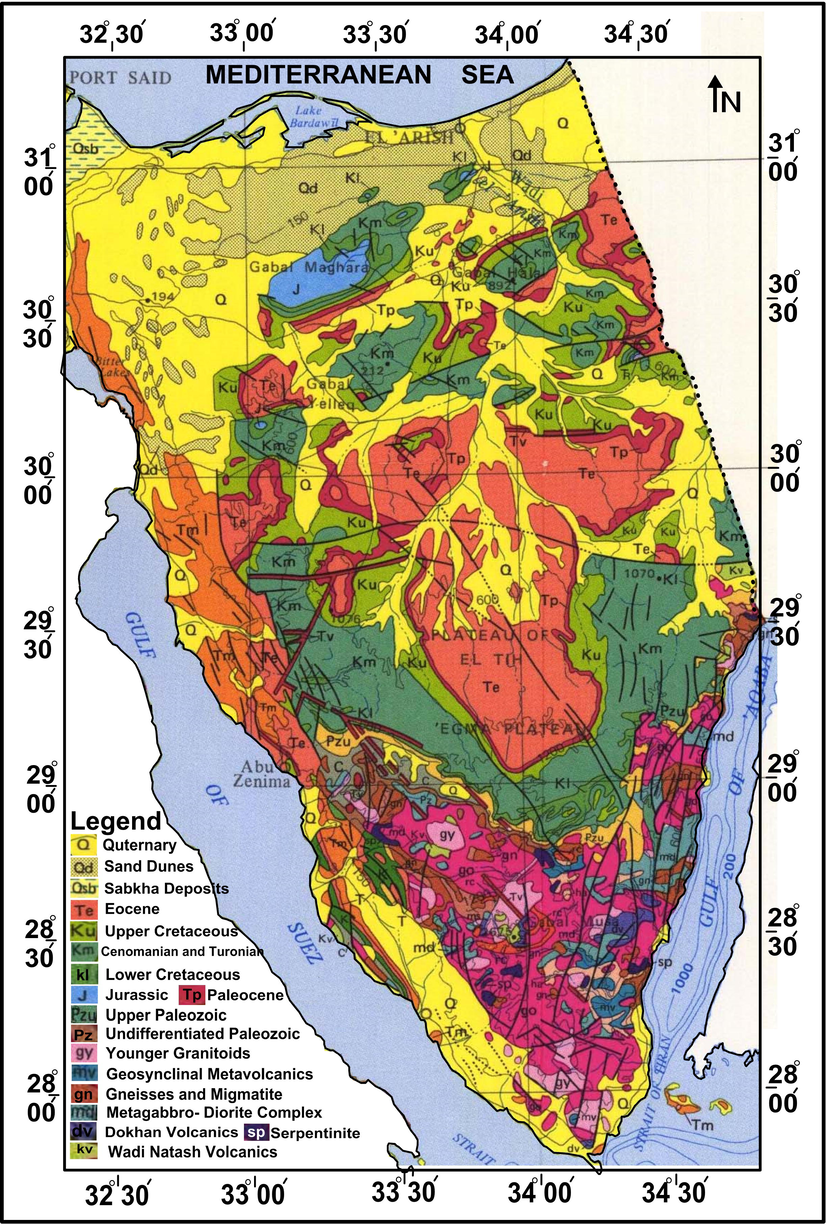
- Geologic map of Sinai.
In addition, the GOA graben is present at its eastern side (Shata, 1992). The crustal studies of Sinai are very limited and carried out as a part of regional studies. Herein, the gravity, and drilled well data were used to deduce the main structural patterns of the hidden basement rocks and the covering sedimentary rocks in addition to map the depth to the CMD within the area. Several processing techniques were applied to gravity data among of them the separation of regional and residual components, the empirical equations of Wollard, 1959; Demenitskaya, 1967 as well as the 2D crustal modeling.
2 Geologic setting
The continental shelf of Sinai is outcropped in its southern section, forming a landscape of high mountains of crystalline and metamorphic basement rocks. A sedimentary cover of different periods dipping gently to the North overlays these basement rocks. The stratigraphy of Sinai reveals rocks ranging in age from Cambrian in the southern section to Recent in the coastal areas and ranging in thickness from 2000 m in the continental facies at the southern part to approximately 8000 m at marine facies to the North, as shown in Fig. 2 (Alsharhan and Salah, 1994).
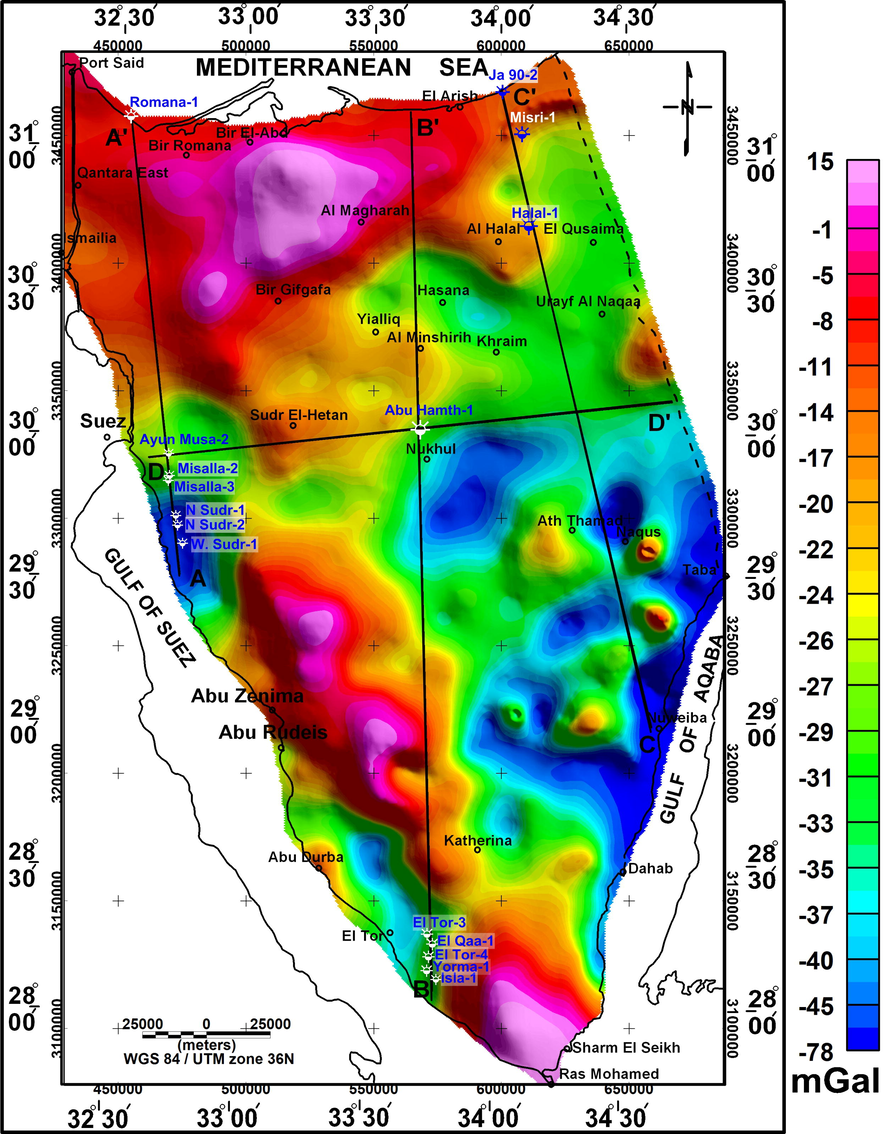
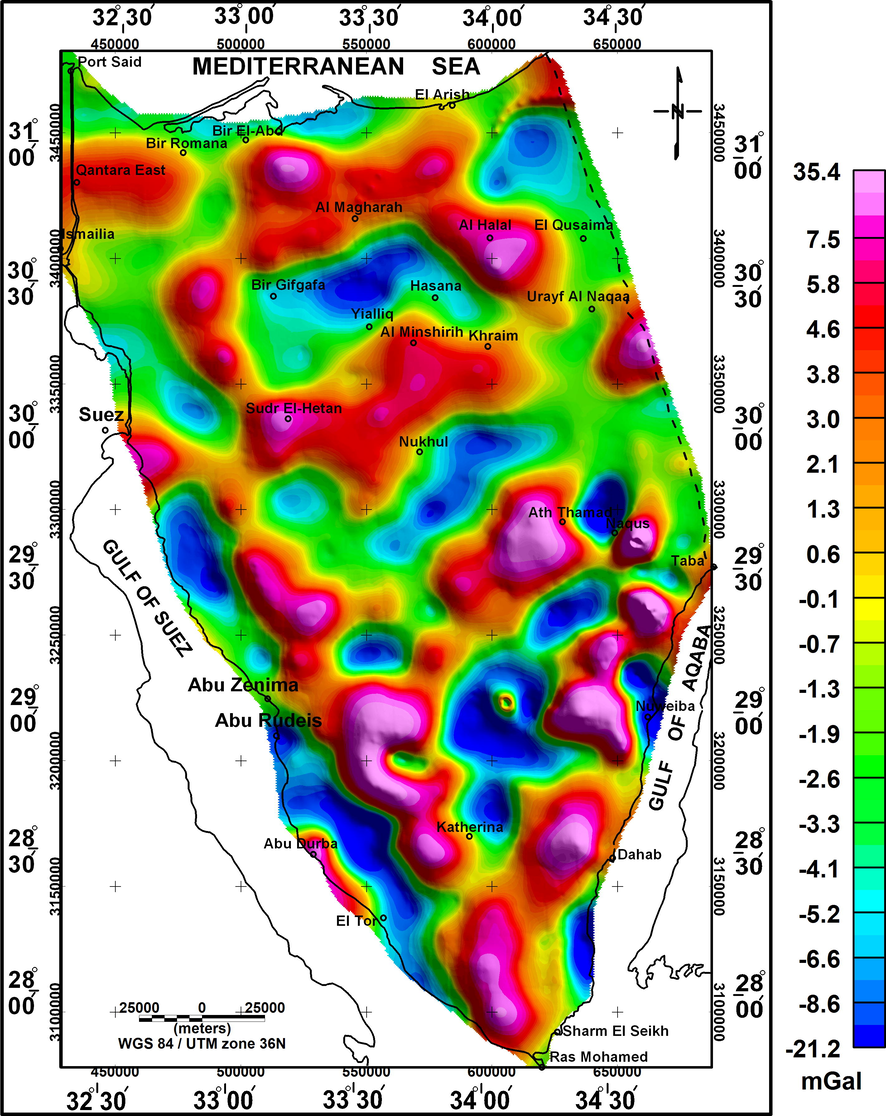
- The Bouguer map of Sinai showing the location of 2D crustal modeling.
Sinai Peninsula is an interesting region from the geological point of view since it shows a variety of both simple and complex structural systems (Abu Al-Izz, 1971). In general, Sinai reveals in miniature all the geologic sequences of Egypt. The surface rock units of Sinai range from the basement rocks of Precambrian age to Quaternary deposits (Fig. 1). The basement rocks are situated at the southern province along the GOS and the GOA. Both Paleozoic and Mesozoic rocks occupy the central parts of Sinai. The quaternary deposits lie east of the GOS and cover various sectors of the middle and northern parts of Sinai (Fig. 1).
Tectonically, Sinai Peninsula is confined by major tectonic elements that have had a main influence on its structure. These elements were subdivided chronologically into four tectonic phases. Pelusium megashear (Precambrian), the opening of Tethys, (Triassic- Liassic), the Syrian Arc system (Late Cretaceous- Early Tertiary), and the GOS (Late Oligocene–Early Miocene) and the GOA (Pliocene).
3 Data and methodology
3.1 Data
The Bouguer map of Sinai had a scale of 1:500,000 and 4 mGal contour interval (Fig. 2; Ismail et al., 2001). The observed gravity measurements were measured by a CG-3 Autograv microprocessor-based automated gravity meter that took measurements at over 7000 mGal without resetting and had a sense resolution of 0.01 mGal. The terrain correction was performed using a chart with a 5-m radius containing zones 9–14 (Hammer, 1939; Haalck, 1953) and using a detailed topographic map of Sinai with a scale of 1:50,000. Concentric rings and a number of radii were drawn at suitable angular intervals.
3.2 Methodology
3.2.1 Regional-residual separation
The gravity data were subjected to regional and residual isolation by using the Fast Fourier transform (FFT) to deduce low and high-pass maps. These maps were established based on cut-off wavenumbers. Bhattacharyya (1966); Spector and Grant (1970) designed spectral analyses depending on the analysis of the gravity data using FFT that is a function of wavelengths in the x and y directions. The first step is the transformation of the used grid to a periodic waveform on its boundaries. The grid transformation then comprises the following simple steps: (1) eliminating the first-order trend from the original gridded data. (2) Expanding the grid dimensions by adding dummy areas to the grid boundaries to produce a square grid. (3) Substituting all dummy values in the grid with the interpolated values from the legal parts of the grid.
3.2.2 Empirical method
Empirical studies on crustal structure to defined crustal thickness (H) was achieved by many researchers (Wollard, 1959; Wollard and Strange, 1962; Ram Babu, 1997; Rivero et al., 2002; Maden et al., 2015). To compute the depth to CMD established on Eqs. (1) and (2), the authors used the following formulas (Wollard, 1959; Demenitskaya, 1967) to assess the depths to CMD of Sinai:
In these equations, Δg, Hc, and H are the gravity anomaly, Conrad, and Moho depths, respectively. Maden et al. (2015) used this empirical equation to assess the depth to CMD in the Erzurum–Horasan–Pasinler basin. These equations proposed by Wollard (1959) were recommended for the whole Earth instead of a definite area.
3.2.3 2D forward modeling
The observed gravity field is a function of the spatial density and elevation changes of the subsurface geologic features. However, the gravity data do not depend only on the density distribution beneath the Earth’s surface (Tealeb and Riad, 1986). Bouguer anomalies are closely linked with crustal thickness changes. These anomalies provide an evidence of mass variations breaks within the crust and/or upper mantle (Pick et al., 1973; Riad et al., 1983; Riad and El-Etr, 1985). To determine the basement, lower crust, and upper mantle configuration, three models were constructed from the southern to the northern parts. These profiles were intersected by a fourth model running from West to East using the GM-SYS program put forward by Oasis Montaj (2015).
4 Results and interpretation
The Bouguer anomaly map (Fig. 2) displays three positive anomalies of high amplitudes and large extensions existing in the southern, northern and southwestern areas parallel to the GOS. Simultaneously, the map reveals a concentration of negative anomalies around the GOS and the GOA. Generally, the eastern area of the Sinai has negative anomalies with low amplitudes and small extensions. The anomalies of the northern region exhibit an ENE trend, while the southwestern area has anomalies of NW trend. In addition, the southeastern part exhibits anomalies with NNE trends. The Bouguer values of Sinai Peninsula range from −78 mGal at southeastern part (Nuweiba) to 15 mGal at the southern part. The separation of regional (low-pass) and residual (high-pass) components was gotten by applying FFT to the gravity data (Fig. 3). The figure revealed five segments, each being associated to the top of a definite density layer. The deepest segment is linked to the top of Moho discontinuity. The slope of the second segment is related to Conrad discontinuity. The third segment defines the depth to the top of the basement rocks. The shallow intrusions and the associated noise in the survey reflect the fourth and the fifth segments, respectively.
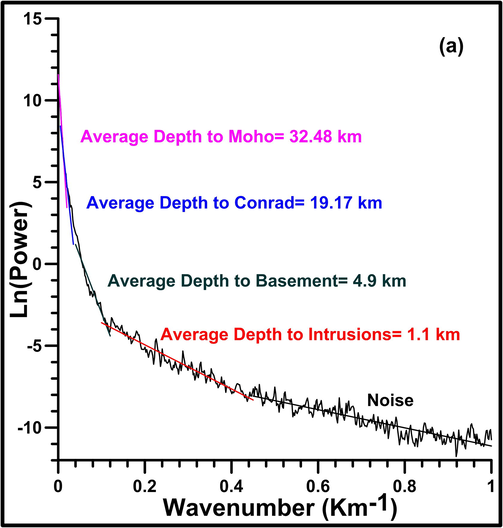
- The radial average power spectrum curves of gravity data.
Herein, the authors applied the Butterworth filter to the gravity data to attain the regional and residual components. A cut-off wavenumber of 0.01 rad/m was used to separate the gravity data depending on the interactive filter of Oasis Montaj (2015). The low-pass gravity map (Fig. 4) reveals anomalies with deeper gravity sources. It also reveals clearer positive and negative anomalies linked with the Bouguer map, with increasing extension. The high gravity values revealed in the northern area of Sinai can be due to the shallower upper mantle. Most of these anomalies have NE, W-E, NW, or NNE trends. The high-pass gravity map (Fig. 5) shows the scattering gravity field when eliminating the regional effect. The map exhibits the domination of various sporadic positive and negative anomalies of dissimilar sizes, amplitudes, forms, and trends and with relatively high wavenumbers, weak amplitudes, and sharp gradients, indicating various gravity sources of shallow depths. Nevertheless, the map displays several elongated anomalies dispersed in the region with amplitude varieties from −21 to 35 mGal. These amplitudes show that the subsurface structure has many gravity sources of uplifted and down-faulted blocks. Based on this filtration process, the utmost main trends in Sinai were found to be NW–SE, NE–SW, and ENE–WSW trends.
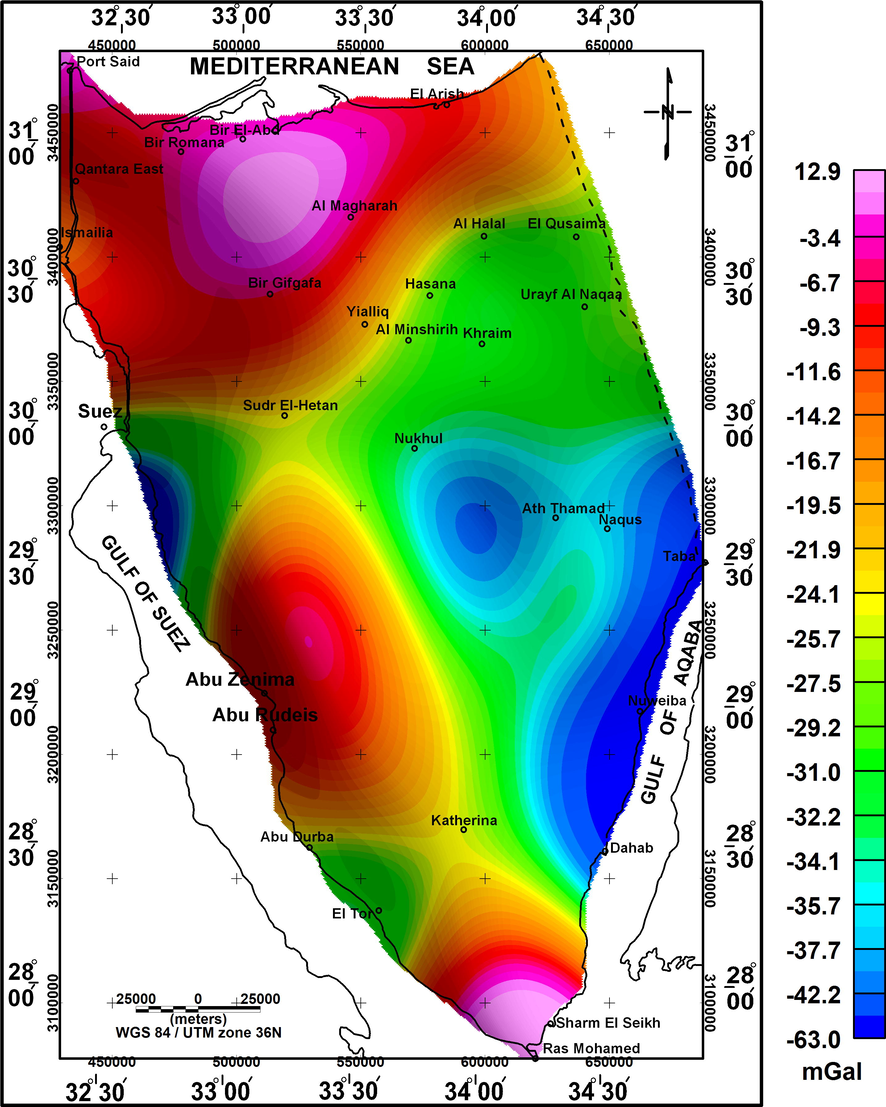
- Low-pass high-pass filtered gravity map with 0.01 Rad/m cut-off wavenumber.
- High-pass filtered gravity maps with 0.01 Rad/m cut-off wavenumber.
A structural map (Fig. 6) of Sinai Peninsula was constructed based mainly on the high-pass filtered gravity map. This map reflects alternating uplifted and down-faulted blocks with two main trends: NW and NE. The map reproduces the effects of the GOS and GOA tectonics on the structural outline of Sinai, especially in its middle and southern parts. Further, the structural map reveals some degree of agreement that presented by Meshref (1989). The down-faulted blocks denotes five basins previously introduced by Abdine and Aal (1992). The basement rocks in the southern Sinai are signified by uplifted faulted blocks.
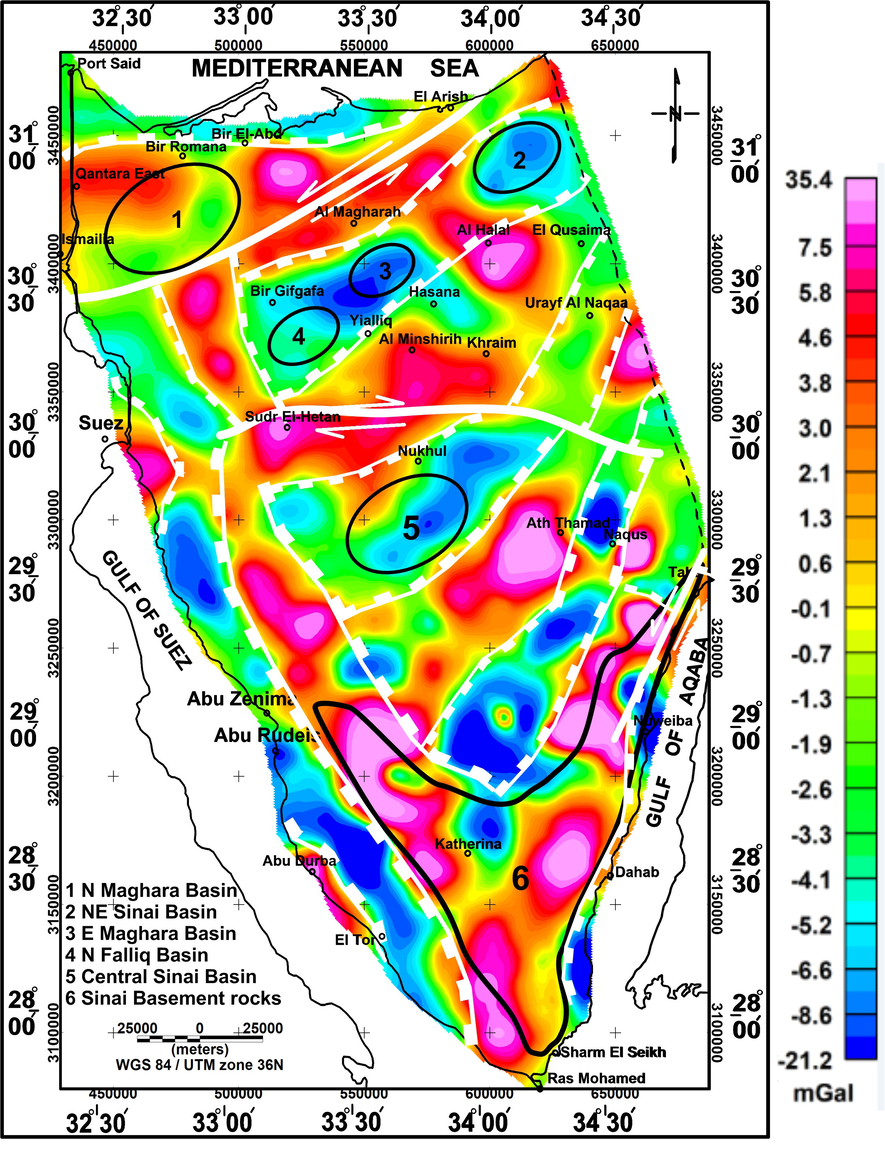
- Structure map of Sinai shows the locations of Abdine and Aal’s basins relative to the structures inferred from high-pass gravity map.
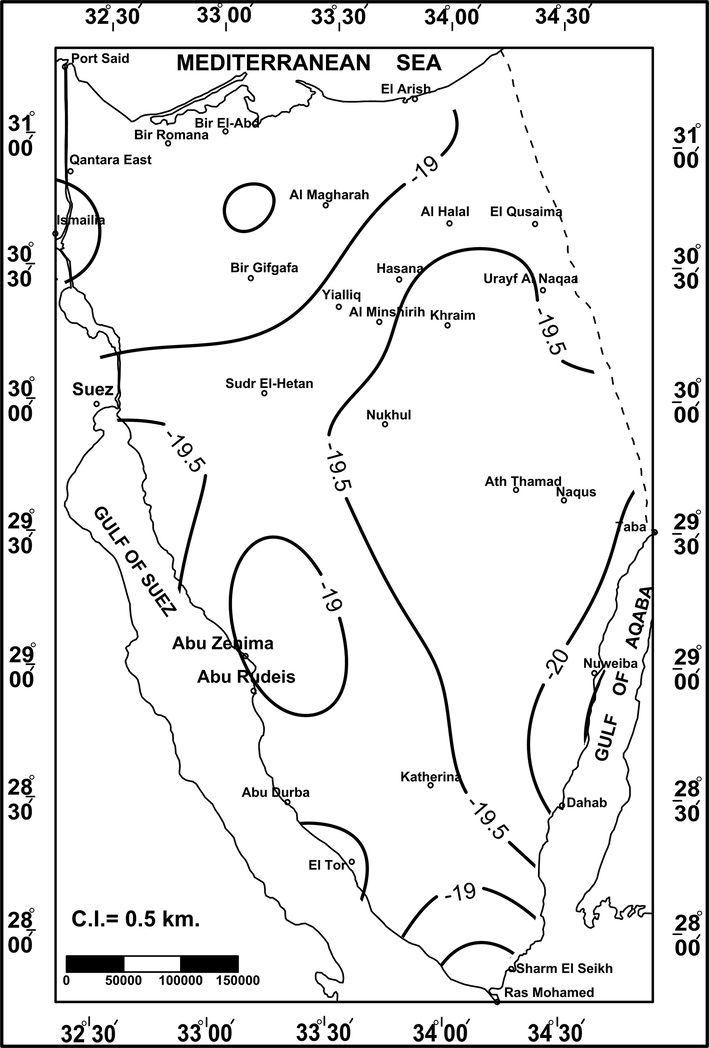
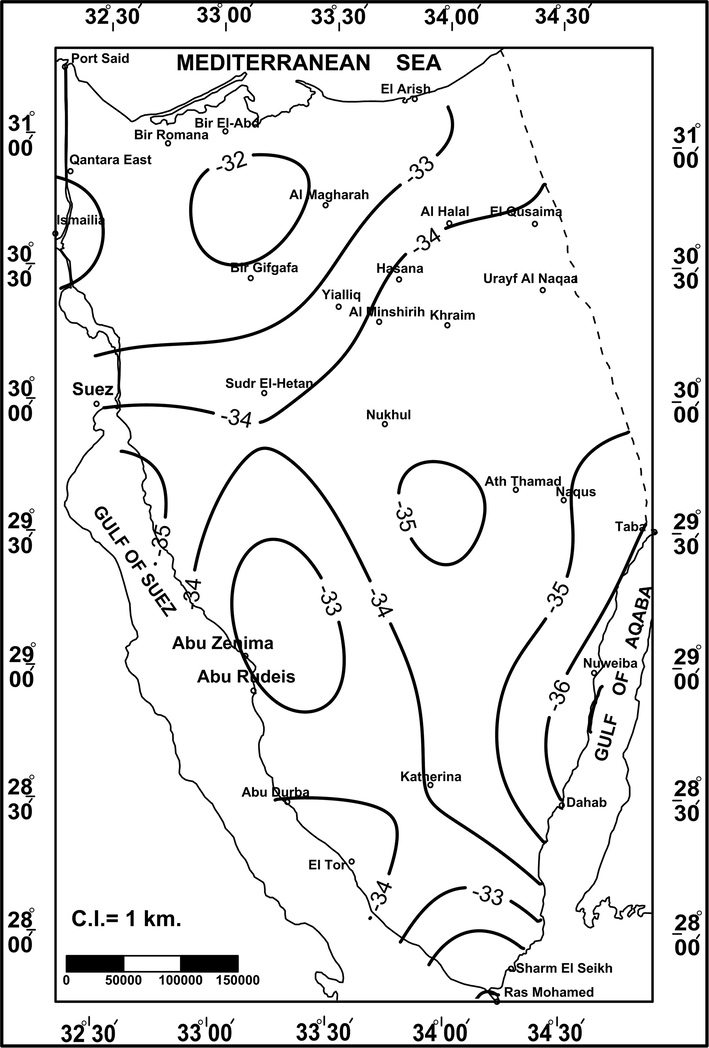
An empirical equation was utilized depending on Eqs. (1) and (2). The Moho depth map (Fig. 7) displays depth values ranging from 31 to 36 km. These values range around the Moho depth (32.48 km) that were calculated by using the FFT to the gravity data (Fig. 3). The extreme Moho depth values are represented in the southern area of the peninsula close to the GOA and the GOS. The shallowest depth is in the southernmost and northernmost parts. There was nearly no difference between the resulted depth of FFT procedure and the Wollard’s formula. Similarly, the depth of the Conrad discontinuity ranges from 18.2 to 20.5 km (Fig. 8). The average depth estimated by FFT (19.7 km) represented the average value of the outcomes of the empirical equations. Both the CMD depths thus have similar behavior.
- The Moho discontinuity depth map of Sinai Peninsula.
- The Conrad discontinuity depth map of Sinai Peninsula.
4.1 2D gravity modeling
The gravity profiles AA′, BB′, and CC′ (Fig. 2) are quasi parallel and run in the S-N direction with distances of approximately 174, 348, and 261 km, respectively. Meanwhile, a profile DD′ (Fig. 2) heading West-East with a distance of 206 km. The modeling process was constrained by the depths derived from 15 drilled wells (Table1) in addition to the calculated depths of CMD (Figs. 7 and 8). Plausible lithospheric models (Fig. 9) were obtained by achieving satisfactory fitting between the observed and calculated gravity data in an iterative way. The upper mantle, lower crust, and upper crust, were modeled using standard density values of 3.3, 2.9, and 2.67 gr/cc respectively. The average density of sedimentary cover is 2.41 gr/cc as inferred from different wells and previous studies (Ismail, 1998; Salem et al., 2004; Saada et al., 2013).
| Model No | Well No. | WELL Name | FTD (m) | FMTD |
|---|---|---|---|---|
| Model AA′ | 1 | W. Sudr-1 | 2447 | M. Jurassic |
| 2 | N.Sudr-2 | 1505 | U. Cretaceous | |
| 3 | N.Sudr-1 | 1406 | Jurassic | |
| 4 | Misalla-2 | 350 | U. Cretaceous | |
| 5 | Misalla-3 | 693 | L. Cretaceous | |
| 6 | Ayun Musa-2 | 2593 | Basement | |
| 7 | Romana-1 | 3505 | Oligocene | |
| Model BB′ | 1 | Isla-1 | 2880 | Nubia |
| 2 | Yoram-1 | 2177 | Basement | |
| 3 | El Tor-4 | 1451 | U. Cretaceous | |
| 4 | El Qaa-1 | 1237 | Basement | |
| 5 | El Tor-3 | 1405 | Nubia | |
| Model CC | 1 | Ja 90-2 | 2801 | L. Jurassic |
| 2 | Misri-1 | 2875 | Jurassic | |
| 3 | W. Sudr-1 | 2447 | M. Jurassic | |
| Model DD | 1 | Ayun Musa-2 | 2593 | Basement |
| 2 | Abu Hamth-1 | 2174 | Basement |
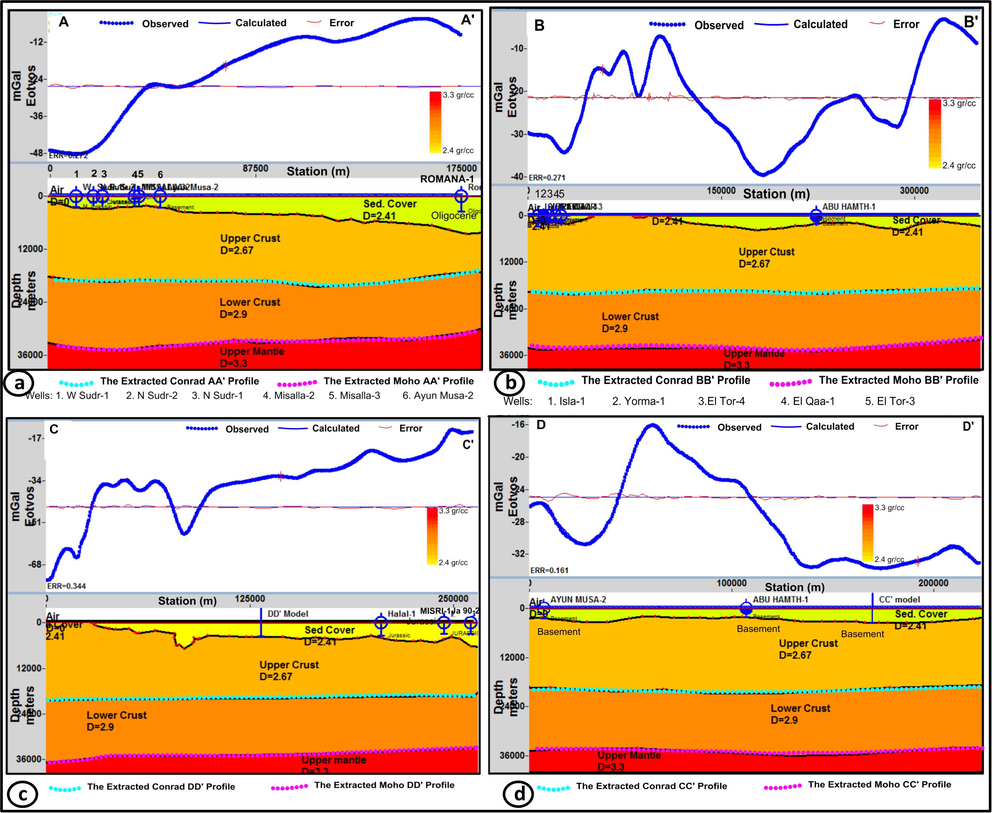
- 2D-crustal models along profiles AA′, BB′, CC′, and DD′.
The observed gravity anomaly along profile AA′ (top panel of Fig. 9a) reveals a general increase toward the North, with the gravitational field increasing from −48 to −4 mGal. In the modeled section (bottom panel of Fig. 9a), the depth to the CMD decreases when heading northwards, from 20 and 34 km to 18 and 31 km, respectively. Contrary, the basement depth increases in the same direction from 1 to about 8 km. The higher thickness in the northern part is due to the deep North Maghara Basin (Fig. 6). The thickness of sedimentary cover was adjusted based on the seven drilled wells (W. Sudr-1, N.Sudr-2, N.Sudr-1, Misalla-2, Misalla-3, Ayun Musa-2, and Romana-1) in close proximity to the profile AA′. The profile BB′ (top panel of Fig. 9b) reveals alternating positive and negative anomalies varying from −39 to −3 mGal. Likewise, the modeling was constrained by five drilled wells along the profile BB′ (Isla-1, Yoram-1, El Tor-4, El Qaa-1, and El Tor-3). The lower modeled cross-section (bottom panel of Fig. 9b) exhibits increasing in the depths to the CMD southwards from 20.5 and 35 km to about 19 and 32 km, respectively. The basement rocks are exposed between offsets of 40,000 and 78,000 m along the profile. The thick sedimentary sequence, which exceeds 4 km at offsets 180 km and 290 km, is correlated with Central Sinai and East Maghara Basins, respectively. The Profile CC′ (top panel of Fig. 9c) shows a noticeable increase in the gravity values from −74 (in the southern part) to −13 mGals (in the northern part). Three drilled wells (Ja 90-2, Misri-1, and W. Sudr-1) along the profile control the modeling process (Table 1). The lower modeled section (bottom panel of Fig. 9c) displays a gentle decease in the depth to the top of the upper mantle (from 36 to 33) and lower crust (from 20 to 19) furthest to the north. In contrast, the depth to the basement surface changes in an inverse behavior, where it exposed to the surface between horizontal distances (0 and 28 km) and reaching 6.5 km at its northern end. The West-East Profile DD′ (Fig. 9d) passes through Ayun Musa-2 and Abu Hamth-1 wells. The top panel reflects a gravitational field varies from −34 to −16 mGal. The lower section indicates a relatively constant depth to CMD (18.5–20.5) and (34–36) as well as basement surface (2 km–3.5 km). This can be related to its direction, which perpendicular to the general dip regime of the peninsula.
5 Discussion and conclusion
The gravity data were employed to investigate the crustal framework of Sinai Peninsula. The southern basement rocks of the Sinai have an influence on both gravitational and magnetic fields. The Bouguer gravity map revealed high amplitudes in this section of the peninsula. The northern region of Sinai has high gravity values because of deep basement rocks (thick sediments) and shallow depths to the CMD (thinner crust). The depth of CMD have a trend to decrease northwards due to the existence of the transition zone from continental to oceanic crust near to the northern Mediterranean Sea shoreline. The constructed structural map revealed that Sinai is highly affected by three main tectonic features. The Syrian Arc, which has an ENE-NE trend, can be easily detected in the northern region. The tectonic effects of both the GOS (NW) and the GOA (NNE) are represented mostly in the southern portion of the peninsula and to some extent in the central one. The map exhibits some agreement with the structural map constructed by Meshref (1989) and demonstrates the localities of the main basins previously revealed by Abdine and Aal (1992). In addition, it introduces down-faulted blocks (basins) in a number of its details.
The anomalies in the low-pass-filtered gravity map were caused by the deep sources of density contrast. The two surfaces of density contrasts are the CMD. We apply the Formulas presented by Wollard (1959) and Demenitskaya (1967) to appraise the depths of these discontinuities. Both of discontinuities have a decreasing depth northward because of the transition zone of the African Plate and westward due to the GOS rifting effect. The results of the current study are mostly in good agreement with Salem et al. (2004) and Saada et al. (2013) results, which were carried out on the northern Egypt. In addition, Ben Menahem et al. (1976) have reported that the continental crust becomes thinner toward the Mediterranean Sea, a result also obtained in the present work. 2D models also indicate that the depth of the basement rocks increases to the north direction. In dissimilarity, the depth to the CMD decreases in the same direction.
Acknowledgment
The authors extend their appreciation to the Deanship of Scientific Research at King Saud University for funding this work through the research group No. RGP-1436-011. Deep thanks are extending to the reviewers for their beneficial review and valuable comments.
Declaration of Competing Interest
The authors declare that they have no known competing financial interests or personal relationships that could have appeared to influence the work reported in this paper.
References
- Structural evolution and styles of the northern Sinai, Egypt. In: 11th EGPC Exploration Seminar, Egypt. 1992. p. :546-563.
- [Google Scholar]
- Impact of oil exploration on Sinai development. In: 3rd Conference on Sinai Development Ismailia. 1992. p. :281-288.
- [Google Scholar]
- Landforms of Egypt. Dar Al-Maaref, Cairo: American University of Cairo Press; 1971.
- Geologic setting and hydrocarbon potential ofnorth Sinai, Egypt. Bull. Can. Pet. Geol.. 1994;44(4):615-631.
- [Google Scholar]
- Sinistral movement along the Gulf of Aqaba, its age and relation to the opening of the Red Sea. Nature. 1980;285(5762):220-222.
- [Google Scholar]
- Tectonics, seismicity and structure of the AfroEurasian junction- the brecking of an incoherent plate. Phys. Earth Planet. Inter.. 1976;12:1-50.
- [Google Scholar]
- Continuous spectrum of the total magnetic field anomaly due to a rectangular prismatic body. Geophysics. 1966;31(1):97-121.
- [Google Scholar]
- Demenitskaya, R. M., 1967. Crust and Mantle of the Earth, Nedra, Moscow, pp. 288.
- Geology of Sinai Peninsula from the ERTS-1 satellite images. In: Remote Sensing Research Project Acad. Sci. Res. Technol., Cairo. 1974.
- [Google Scholar]
- Die gravimetrisch-en Methoden. In: Haalck Inoh., ed. lehrbuch der Angewandten Geophysik Barntriager, Berlin. 1953. p. :27-155.
- [Google Scholar]
- Bouguer and total magnetic intensity maps of Sinai Peninsula, Scale 1:500,000. In: Proc 2nd International Symposium on Geophysics. 2001. p. :111-117.
- [Google Scholar]
- Geophysical studies in northern part of Egypt. Cairo University; 1998. Ph.D. Thesis
- 3D gravity inversion of Northern Sinai Peninsula: a case study. Pure Appl. Geophys. 2013
- [CrossRef] [Google Scholar]
- Determination of the crustal and thermal structure of the Erzurum-Horasan-Pasinler Basins (Eastern Tu ¨rkiye) Using Gravity and Magnetic Data. Pure Appl. Geophys.. 2015;172:1599-1614.
- [CrossRef] [Google Scholar]
- Energy resources in Sinai (invited talk) In: Proc. 2nd Conf. Geol. Sinai Develop., Ismailia. 1989. p. :142-152.
- [Google Scholar]
- Geosoft Mapping and Application System version 8.3.3, Inc, Suit 500, Richmond St. West Toronto, ON Canada N5SIV6. 2015.
- Crustal modeling of north Sinai and southeast Mediterranean Sea. In: Proc. 2nd Internat., Symp. on Geophysics, Tanta. 2001. p. :118-129.
- [Google Scholar]
- Theory of Earth’s Gravity Field. Academia, Publ Hause of Czechoslovak academy of sciences; 1973.
- Structural set-up of Southern Sinai and Gulf of Suez areas indicated by geophysical data. Ann. Geophys.. 2003;46(6):1325-1337.
- [Google Scholar]
- Average crustal density of the Indian litosphere: an inference from gravity anomalies and deep seismic soundings. J. Geodyn.. 1997;23:1-4.
- [Google Scholar]
- Bouguer anomalies and lithosphere- crustal thickness in Uganda. J. Geodyn.. 1985;3(1-2):169-186.
- [Google Scholar]
- Preliminary interpretation of regional gravity anomalies of Egypt. In: Paper presented at the 8th General Assembly of the IUGG, Hamburg. 1983.
- [Google Scholar]
- Moho depth structure of the eastern part of the Pyrenean belt derived from gravity data. J. Geodyn.. 2002;33(3):315-332.
- [Google Scholar]
- Structural pattern and crustal modeling of the central northern part of Egypt, using Bouguer gravity data. J. Appl. Sci. Res.. 2013;9(10):6373-6386.
- [Google Scholar]
- Delineating the structural framework of the northeastern Sinai using gravity and magnetic data. Carpathian J. Earth Environ. Sci.. 2020;15(1):261-273.
- [CrossRef] [Google Scholar]
- The Geology of Egypt. Amsterdam: Elsevier Publishing Co; 1962.
- Structure and evolution of North African passive margin crust: as inferred from 2-D gravity modelling of Nile Delta and its surrounding areas, Egypt. Egypt. Geophys. Soc. J.. 2004;2(1):17-29.
- [Google Scholar]
- Structural development of the Sinai Peninsula, Egypt, Desert Institute of Egypt. Bulletin. 1956;6:22.
- [Google Scholar]
- Watershed management, development of potential water resources and desertification control in Sinai (invited talk) In: Proc. 3rd Conf. Geol. Sinai Develop., Ismailia. 1992. p. :273-280.
- [Google Scholar]
- Alpine deformation and the oceanic areas of the Tethys, Mediterranean and Atlantic. Geol. Soc. Amer. Bull.. 1971;82(8):2039.
- [CrossRef] [Google Scholar]
- Statistical models for interpreting aeromagnetic data. Geophysics. 1970;35(2):293-302.
- [Google Scholar]
- Regional gravity anomalies of western Saudi Arabia and their geological significance. In: EGS Proc of 5th Ann Meet March 29-30. 1986. p. :50-89.
- [Google Scholar]
- Crustal structure from gravity and seismic measurements. J. Geoph. Res.. 1959;64:1521-1544.
- [Google Scholar]
- Gravity anomalies and crust of the earth in the pacific basin,. In: The crust of the Pacific basin. Geophysical Monograph. 1962. p. :12.
- [Google Scholar]


