

Translate this page into:
Multivariate optimisation and validation of the analytical GC-FID for evaluating organic solvents in radiopharmaceutical
⁎Corresponding author at: Department of Imaging, Faculty of Medicine & Health Sciences, Universiti Putra Malaysia, Serdang 43400, Malaysia. rashmizal@upm.edu.my (Hairil Rashmizal Abdul Razak)
-
Received: ,
Accepted: ,
This article was originally published by Elsevier and was migrated to Scientific Scholar after the change of Publisher.
Peer review under responsibility of King Saud University.
Abstract
Objective
Analytical gas chromatography in line with a flame ionisation detector (GC-FID) method was developed and validated for evaluating organic solvents in radiopharmaceutical samples [18F]fluoro-ethyl-tyrosine ([18F]FET), [18F]fluoromisonidazole ([18F]FMISO) and [18F]fluorothymidine ([18F]FLT). Variables of the carrier gas flow (mL min−1) and a split ratio of injection on the response of analysis time and resolution were optimised with the assistance of a two-level full factorial design and desirability function of Derringer.
Methods
The proposed procedure was validated following the International Council for Harmonisation of Technical Requirements for Pharmaceuticals for Human Use (ICH) Q2 (R1) guideline.
Results
Excellent linearity, R2 > 0.990 indicated that approximately 99% of the variance in the response could be predicted from ethanol and acetonitrile concentrations ranging from 0.8 to 7.5 mg mL−1 and 0.1 to 1.0 mg mL−1, respectively. The proposed procedure proved to be selective, sensitive and accurate (85 to 105%), with excellent repeatability and precision (relative standard deviation (RSD) < 2%). In assessing the robustness of the method, the proposed procedure also proved to be robust as the standardised effects values (SE) were insignificant (p > 0.05).
Conclusion
The proposed method has also been successfully used for the quantitative determination of ethanol and acetonitrile in [18F]FET, [18F]FMISO and [18F]FLT samples. Analytes were well resolved (R, 7.9 – 8.1) within 3.5 min even though the column had a larger, 0.53 mm internal diameter. The proposed method is, therefore, relevant for routine organic solvent quality control analysis of any 18F-radiopharmaceutical derivatives.
Keywords
Organic solvent analysis
Quality control analysis
Gas chromatography-FID
Carrier gas flow
Injection split ratio
Radiopharmaceutical

- 18F
-
Fluorine-18
- [18F]FET
-
[18F]fluoro-ethyl-tyrosine
- [18F]FLT
-
[18F]fluorothymidine
- [18F]FMISO
-
[18F]fluoromisonidazole
- %RE
-
Percentage of relative error
- AUC
-
Area under curve
- CDNI
-
Centre for Diagnostic Nuclear Imaging
- CG
-
Carrier gas
- di
-
Individual desirability
- diAt
-
Individual desirability for analysis time
- diR
-
Individual desirability for resolution
- D
-
Global desirability
- FID
-
Flame ionisation detection
- GC
-
Gas chromatography
- GC-FID
-
Gas chromatography flame ionisation detection
- ICH
-
The International Conference on Harmonisation of Technical Specifications for The Registration of Pharmaceuticals for Human Use
- ISR
-
Injection split ratio
- LOD
-
Limit of detection
- LOQ
-
Limit of quantification
- min
-
minute
- mg mL−1
-
miligram per mililiter
- NCI
-
National Cancer Institute
- OLSM
-
Ordinary least squares method
- r
-
Correlation coefficient
- R
-
Resolution
- R2
-
Regression analysis
- RF
-
Response factor
- RSD
-
Relative standard deviation
- RSDIP
-
Relative standard deviation from intermediate precision
- RSDr
-
Relative standard deviation from repeatability
- S
-
Weight
- SE
-
Standardised effects
- SHT
-
Sample holding time
- UPM
-
Universiti Putra Malaysia
- w/v
-
Weight by volume
- yi
-
Response
- ymim
-
Lowest experimental response
- ymax
-
Highest experimental response
Abbreviations
1 Introduction
In the emergence of molecular imaging and nuclear medicine field, radiopharmaceutical has rapidly become a highly valuable instrument due to its in-vivo visualisation capability, as well as the monitoring of physiological and biochemical processes at the molecular and cellular level (Richter & Wuest, 2014). A radiopharmaceutical is an injectable non-pharmacological solution consisting of a molecular structure and a radionuclide for diagnostic or therapeutic purposes (dos Santos Costa et al., 2019; Vermeulen et al., 2019).
In most of the radiopharmaceutical production stages, organic solvents are deemed necessary, and it is almost impossible to exclude (dos Santos Costa et al., 2019; Mihon et al., 2017). Organic solvents promote reactions, separation, purification and drying (Tankiewicz et al., 2016). Methanol, acetone, ethanol and acetonitrile are examples of organic solvents used in the radiopharmaceutical production, with the latter being the most widely used.
Nevertheless, the presence of organic solvents in the final radiopharmaceutical formulation is inevitable, as eliminating them is almost impractical (Cheng et al., 2010; Otero et al., 2004). This difficulty has been repeatedly encountered in this area. Therefore, the amount of ethanol and acetonitrile in the final formulation of radiopharmaceutical must be limited to a maximum 5 mg mL−1 and 0.41 mg mL−1 respectively, as reported in some radiopharmaceutical pharmacopoeia monographs (dos Santos Costa et al., 2019; International Council for Harmonisation Of Technical Requirements for Pharmaceuticals for Human Use, 2018; Mihon et al., 2017).
The International Conference on Harmonisation of Technical Specifications for the Registration of Pharmaceuticals for Human Use (ICH) Guideline Q3C classified acetonitrile as Class 2 (harmful) and ethanol as Class 3 (moderately harmful in large quantities) solvents. Solvents listed in these groups pose a health risk due to their toxicity and must be regulated (Witschi & Doelker, 1997). Consequently, the determination of organic solvents in radiopharmaceutical quality control practice has become compulsory to ensure patient safety and also to meet regulatory requirements (dos Santos Costa et al., 2019). Nonetheless, the quality control of radiopharmaceutical product poses several challenges due to large volumes of ethanol, relatively short half-life of 18F-derivative and a mineral-rich matrix (dos Santos Costa et al., 2019).
The evidence to date suggests that the gas chromatography-flame ionisation detection (GC-FID) analysis of organic solvents has been generally recognised as one of the compelling techniques used. Available evidence shows that the specificity, sensitivity and ability of the GC-FID to run a sample in a minimum amount of time was defined as the decisive preference over other techniques (Farajzadeh et al., 2017; Meinert & Meierhenrich, 2012; Nader et al., 2011). Since some several factors or variables could affect the GC responses, it is not surprising that different pharmacopoeias have long discussed several methods of gas chromatography methods (Klok & Windhorst, 2006).
Among the variables that significantly affect the multiple responses on the GC are the column temperature, the split ratio of injection, the flow of carrier gas (mL min−1) and the carrier gas used (Bernardoni et al., 2019; dos Santos Costa et al., 2019; Mihon et al., 2017). The effect on multiple responses of these multiple factors has been extensively studied using multivariate optimisation approaches, in particular, the two-level full factorial design to improve the quality control process.
Several studies have shown that the two-level full factorial design allows for the simultaneous analysis of different factors and responses with a few experiments (Bezerra et al., 2016; Ferreira et al., 2018; Novaes et al., 2016; Orlandini et al., 2014). Previous research has shown that the two-level full factorial design has also been considered to be the most effective chemometric tool for robustness assessment (Ferreira et al., 2017). In essence, the interaction between multiple factors and responses can also be enhanced through a desirability analysis (Derringer & Suich, 1980; dos Santos Costa et al., 2019).
Multiple factors such as variability in the splitless time, injection temperature and column temperature have been extensively studied in our previous work on the multiple responses to the analysis time and resolution. It should be noted that the previous study indicated that the interaction between these factors had a significant effect on the analysis time (p < 0.05). However, previous evidence ultimately showed that the interaction between splitless time and injection temperature did not significantly influence the resolution of adjacent peaks (p > 0.05) (Hassan et al., 2021).
In this work, multiple factors of the split ratio of injection and carrier gas flow (mL min−1) applied to 0.53 mm internal diameter of the column were studied in the multiple responses to analysis time and resolution. The responses of this study may show differences as the column diameter used; 0.53 mm differs from the small column used; 0.25 mm and 0.32 mm in the previous analyses (dos Santos Costa et al., 2019; Kilian et al., 2014; Mihon et al., 2017; Nader et al., 2011). Therefore, this recent work is devoted to optimise and validate an improve GC-FID analytical method to determine ethanol and acetonitrile in manufactured radiopharmaceuticals.
2 Materials and methods
2.1 General
[18F]fluoride produced via the 18O(p,n)18F nuclear reaction on a 16.5 MeV cyclotron PETtrace® (GE Healthcare Technologies, USA) was supplied by the Department of Nuclear Medicine, National Cancer Insitute (NCI), Putrajaya and delivered in a liquid form to the Centre of Diagnostic Nuclear Imaging (CDNI), Universiti Putra Malaysia (UPM). The no-carrier-added [18F]fluoride solution was then transferred to the Scintomics GRP 4 V module (Scintomics GmbH, Germany) to produce [18F]FET, [18F]FMISO and [18F]FLT.
2.2 Reagent and chemicals
Ethanol and acetonitrile with the purity of 99.9% and 99.5% respectively, were purchased from Merck (Darmstadt, Germany) and used to prepare analytical solutions. Reagent kits and sterile cassettes used in the preparation of [18F]FET, [18F]FMISO and [18F]FLT were purchased from ABX Advanced Biochemical Compounds (Radeberg, Germany). All precursors and eluents were stored following ABX Advanced Biochemical Compounds instruction.
2.3 Instrumentation
All experiments were performed on a Shimadzu (Japan) GC-2010Plus AF gas chromatography equipped with FID-2010Plus flame ionisation detector (FID) and integrated AOC-20i autoinjector. The system was controlled by LabSolution (Version 5.82). The chromatographic separation was performed on the Agilent J&W DB-200 column (mid-polarity), 30 m × 0.53 mm × 1 µm, with the sample volume of 1 µL. The ultrapure nitrogen gas, 99.9995% purity (Air Products, Malaysia) was used as the carrier gas and set at 30 mL min−1. The FID airflow (Air Products, Malaysia) was set at 400 mL min−1, and 40 mL min−1 for hydrogen gas, 99.9992% purity (Air Products, Malaysia). The FID detector temperature was set at 250 °C.
Other chromatographic factors such as the injection temperature (220 °C) and column temperature (50 °C initial and hold for a minute, before linearly increase at 10 °C min−1 to 90 °C) optimised in the previous study, were maintained. The carrier gas flow (mL min−1) and the injection split ratio were determined using the multivariate optimisation techniques.
2.4 Optimisation of the experimental variables
The outcome of carrier gas flow and injection split ratio on the analysis time and resolution between adjacent peaks was assessed using a two-level full factorial design. The desirability function was used to enable these responses to be optimised simultaneously (Derringer & Suich, 1980; dos Santos Costa et al., 2019). Each response (yi) was converted to an individual desirability function (di), which varies between 0 and 1 (0 ≤ di ≤ 1). The individual desirability (di) then was determined using the Eqs. (1) and (2) for the analysis time and resolution between adjacent peaks.
In order to support this finding of an optimum set of input variables (“experimental matrix”), a Factorial ANOVA (Two-Way ANOVA) was used to determine whether there is an interaction between the factors on the responses. If the interaction between the factors exists, which factor significantly contributes to the response, percentage variation of the response that can be predicted from the factors and which simple effects of experimental matrices that contribute statistically significant responses. The data analysis derived from the multivariate optimisation was performed using the software SPSS Statistics 26 (IBM, USA).
2.5 Validation of the proposed procedure
The procedure was validated following the ICH’s analytical procedure validation guideline (International Council for Harmonisation Of Technical Requirements for Pharmaceuticals for Human Use, 2006). The matrix effect, linearity, precision (repeatability and intermediate precision), the limit of detection (LOD) and quantification (LOQ), accuracy (recovery) and robustness parameters were evaluated.
2.5.1 Matrix effect
The matrix effect was determined by comparing the matrix slopes from and standard calibration curves using the Levene’s test and the Student’s t-test (α = 0.05). At each spiking level, the enriched samples were prepared in triplicates with standards at a concentration of 0.5, 1.5, 3, 4.5, 6 and 7.5 mg mL−1 for ethanol and 0.1, 0.2, 0.4, 0.6, 0.8 and 1 mg mL−1 for acetonitrile to generate a matrix calibration curve. The standard calibration curve had also been prepared at the same matrix curve concentrations.
2.5.2 Linearity
Standard solutions of ethanol and acetonitrile were prepared at the six concentrations levels and evenly spaced. At each level, three independent replicates were prepared. The area under the curve of the calibration solutions was performed in a random order, to ensure no autocorrelated data. The calibration and residual plots were performed for the investigation of fitting quality and deletion of outliers (Thompson & Lowthian, 2011). Levene’s test was used to confirm homoscedasticity (p > 0.05). The slope, intercept, residual and correlation coefficients (R) were estimated using the ordinary least squares method (OLSM) (dos Santos Costa et al., 2019; Jurado et al., 2017)
2.5.3 Precision (repeatability and intermediate precision)
Standard solutions of ethanol and acetonitrile at the six concentrations levels and each level in three independent replicates were injected into the GC-FID and completed within the same day (intra-day). The response measurement of retention time and area under the curve was recorded and calculated for relative standard deviation (RSD). As for the determination of the intermediate precision, responses were recorded from solutions injected on another day (inter-day). The RSD of below 2% for both cases were agreed as an acceptance criterion.
2.5.4 The limit of detection (LOD) and quantification (LOQ)
The LOD and LOQ were calculated adopting the equation: LOD = 3.3 × sa / b , and LOQ = 10 × sa / b , where sa is the standard deviation of the calibration curve intercept, while b is the calibration curve slope. The estimated value was further confirmed by an independent analysis of the solutions prepared for these ranges (International Council for Harmonisation Of Technical Requirements for Pharmaceuticals for Human Use, 2018; Shrivastava & Gupta, 2011).
2.5.5 Accuracy (recovery)
The accuracy was assessed through a recovery study with spiked samples (n = 3) at low, middle and high concentration levels: ethanol (0.8, 3.0 and 6.0 mg mL−1) and acetonitrile (0.1, 0.4 and 0.8 mg mL−1). The acceptance criteria for the recovery of each solvent should be in between 90 and 115%, as suggested in the literature (dos Santos Costa et al., 2019)
2.5.6 Robustness
The two-level full factorial design was employed for the evaluation of robustness (Ferreira et al., 2017). The calculated standardised effects values (SE) were compared to the critical value of the Student's t-test (α = 0.05).
2.6 Application of the procedure
Radiolabeling of 18F-derivative samples of [18F]FET, [18F]FMISO and [18F]FLT, three samples each, were performed in Scintomics GRP 4 V automated synthesis module (Scintomics, Germany) at CDNI, UPM. Samples were then analysed using the proposed procedure.
3 Results and discussion
3.1 Optimisation of the experimental variables
The experiments were executed using a 0.9% (w/v) NaCl solution spiked with ethanol and acetonitrile concentrations equivalent to 1 mg mL−1 for the simulation of a radiopharmaceutical matrix. The two-level full factorial design was performed in two-level: high (+) and low (−). Table 1 shows the coded and actual values of the selected variables at this level, the central points triplicates and the di values for the resolution and analysis time.
Experiment
Carrier gas flow (mL min−1)
Injection split ratio
Individual desirability (di)
Analysis time (diAt)
Resolution (diR)
1
3 (−1)
10 (−1)
0.00
0.42
2
3 (−1)
50 (1)
0.44
0.58
3
4 (1)
10 (−1)
0.67
0.52
4
4 (1)
50 (1)
0.33
0.50
5
3.5 (0)
30 (0)
0.33
0.60
6
3.5 (0)
30 (0)
0.33
0.35
7
3.5 (0)
30 (0)
0.44
0.65
Carrier gas flow and injection split ratio were selected as factors as they potentially influence the analysis time and resolution between ethanol and acetonitrile peaks (dos Santos Costa et al., 2019). Analysis time and resolution of neighbouring peaks were chosen as outcomes in order to assess the suitability of the method in terms of rapid analysis time and separation efficiency. The factors were optimised using a two-level full factorial design which includes the central points triplicates for estimating the experimental error.
The statistical analysis of Factorial ANOVA showed a relatively high observed power, 0.98 and a significant interaction between the carrier gas flow and injection split ratio on the resolution of neighbouring peaks (p < 0.001). The Partial Eta squared revealed that about 97% of the variance in the resolution can be predicted from the injection split ratio. In comparison, only about 78% was predicted for the carrier gas flow. The finding supported the statement that injection split ratio only influenced resolution (dos Santos Costa et al., 2019).
As the interaction between these factors on the resolution was significant, further Games-Howell posthoc analysis was performed to determine the combination of experimental matrices that demonstrated significant difference in resolution. The Games-Howell posthoc analysis revealed that changing the injection split ratio from 1:10 to 1:50, produced a significant difference in the resolution. Nevertheless, the resolution only showed a statistically significant difference if the carrier gas flow was maintained at 3 mL min−1.
Further statistical analysis of Factorial ANOVA on the analysis time also revealed a high observed power, 0.99 and a significant interaction between these factors (p < 0.001). The Partial Eta squared reported that 100% of the variance in the analysis time can be predicted from the carrier gas flow. It is unsurprising to find that only about 91% was predicted for the injection split ratio. These results are in line with our expectations as, other than column temperature, the carrier gas flow influences the analysis time and resolution (dos Santos Costa et al., 2019).
The Games-Howell posthoc analysis on the analysis time revealed that increasing the carrier gas flow to 4.0 mL min−1 substantially leads to shorter analysis time. Nevertheless, it yields an imperfect separation of the adjacent peaks as compared to 3.0 mL min−1 of carrier gas flow used. The results were exciting and help to justify that the use of a relatively moderate gas carrier flows at 3 mL min−1 was adequate for an appropriate analysis time that <5 min with an excellence resolution (R > 5). Concerning the injection split ratio, using a lower injection split ratio of 1:10 will take more time for the sample to enter into the column. Additionally, an internal diameter column of 0.53 mm requires a minimum injection split ratio of 1:10. A higher injection split ratio of>1:50 will result in low sensitivity because less sample is injected into the column as well as wasting a carrier gas.
After the validation and optimisation of the two individual desirabilities (di) for analysis time and resolution, both functions could be combined into the overall desirability (D), which was computed using Eq. (3)
From the calculation, the optimum conditions for the ethanol and acetonitrile in the sample to be well resolved with a rapid analysis time (within 5 min, Fig. 1.) and highest D (0.51) were: 3.0 mL min−1 of carrier gas flow and 50 injection split ratio. Under these conditions, the resolution values were in between 7.8 and 8.1, with a relative standard deviation (RSD) of<2%. The statistical analysis of Two-Way ANOVA performed earlier significantly strengthened the optimum conditions that were obtained using the overall desirability (D). In summary, the optimal experimental conditions used for validation in the later part was as follow (Table 2).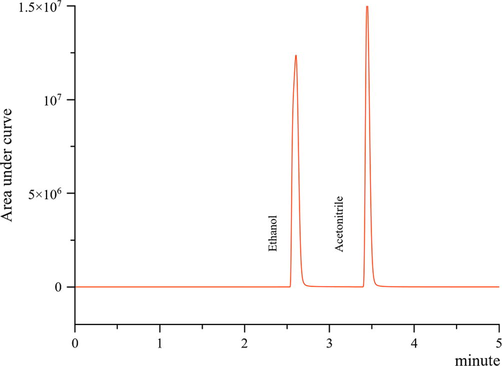
GC-FID chromatogram of 0.9% (w/v) NaCl solution spiked with ethanol and acetonitrile (1 mg mL−1) under optimised chromatographic conditions.
Parameters
Optimal conditions
Injection volume
1 µL
Injection split ratio
1:50
Injection temperature
220 °C
Carrier gas flow
3.0 mL min−1
Column temperature
50 °C for 1 min, 10 °C min−1 to 90 °C
Detector temperature
250 °C
3.2 Validation of the proposed procedure
The proposed method was validated based on matrix effect, linearity, precision, the limit of detection (LOD) and limit of quantification (LOQ), accuracy and robustness following to international regulation (International Council for Harmonisation Of Technical Requirements for Pharmaceuticals for Human Use, 2006).
Following a statistical analysis of Student’s t-test, the matrix slopes and standard calibration curve of acetonitrile showed a significant result of the matrix effect (p < 0.001). It may be due to the interaction between the matrix and acetonitrile in the sample that produces a significant difference in response. For this reason, fortified samples were used to construct the calibration curve for acetonitrile.
In the linearity study, the Levene’s test was performed to support homoscedasticity (p > 0.05) before the ordinary least squares method (OLSM) was used to examine the slope, intercept, residual and correlation coefficient (r). The correlation between the standard solution at the six concentrations levels and the response of area under the curve for both solvent was significantly strong, r > 0.990. Through the logistic regression analysis (R2), about 99% of the variance in the response can be predicted from the concentration.
All calibration points were found within the prediction interval (Fig. 2A.), and R2 present value of 0.999. Studentised residual plot (Fig. 2B.) also showed all the computed residuals within the ± 2 limits and appeared normally distributed and centred at zero. The same can be observed in the case of response factor (Fig. 2C.), whose values were included between 5%. In Fig. 2D., back-calculated relative errors (%RE) were represented against the concentration of standard solutions. Only a single point that corresponds to an ethanol concentration of 0.8 mg mL−1 showed closer to the computed residuals limit of 2 and 15% of RE. From the author's point of view, this finding is expected since the very low concentration. Although the response factor for the respective concentration was slightly above 5% limit, it did not affect the linearity of the curve.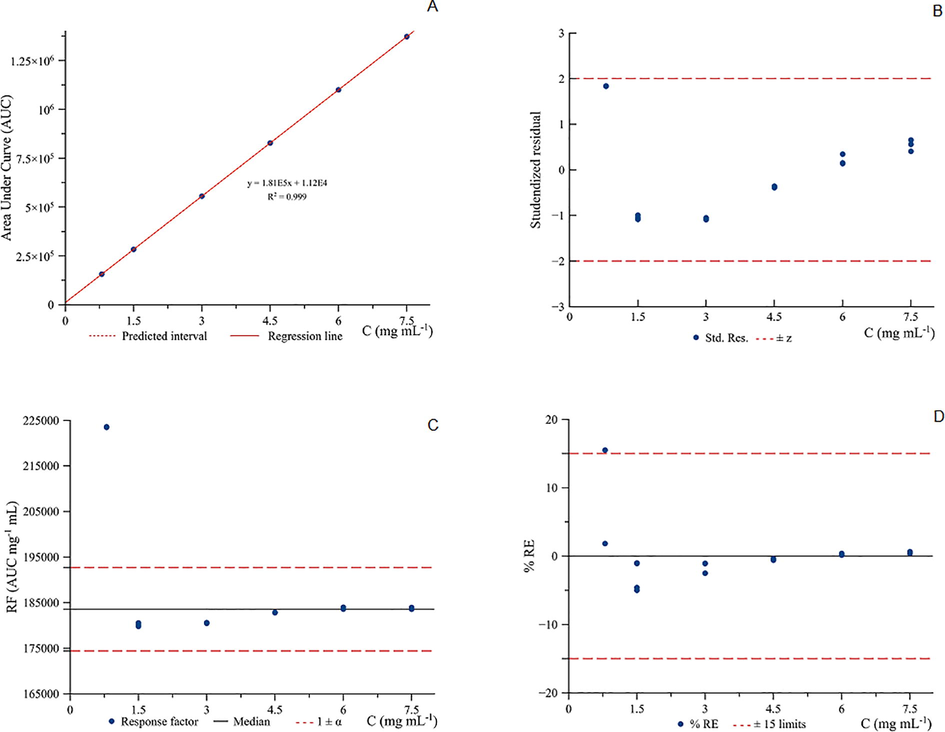
Linearity study for the calibration curve of ethanol by GC-FID in the calibration range, 0.8 to 7.5 mg mL−1.
In Fig. 3., all calibration points are found within the prediction interval (Fig. 3A.) and R2 present value of 1.000 by using the concentration range from 0.1 to 1.0 mg mL−1. Studentised residual plot (Fig. 3B.) also showed all the computed residuals within the ± 2 limits with the back-calculated %RE were lower than 5% (Fig. 3D). In the case of the response factor, it was obvious to notice that acetonitrile concentration at 0.1 mg mL−1 was the problematic concentration level. The response factor was out of range for the respected concentration and considered as outlier. In this sense, a new calibration line was generated accordingly by removing the respective concentration points (Fig. 4.).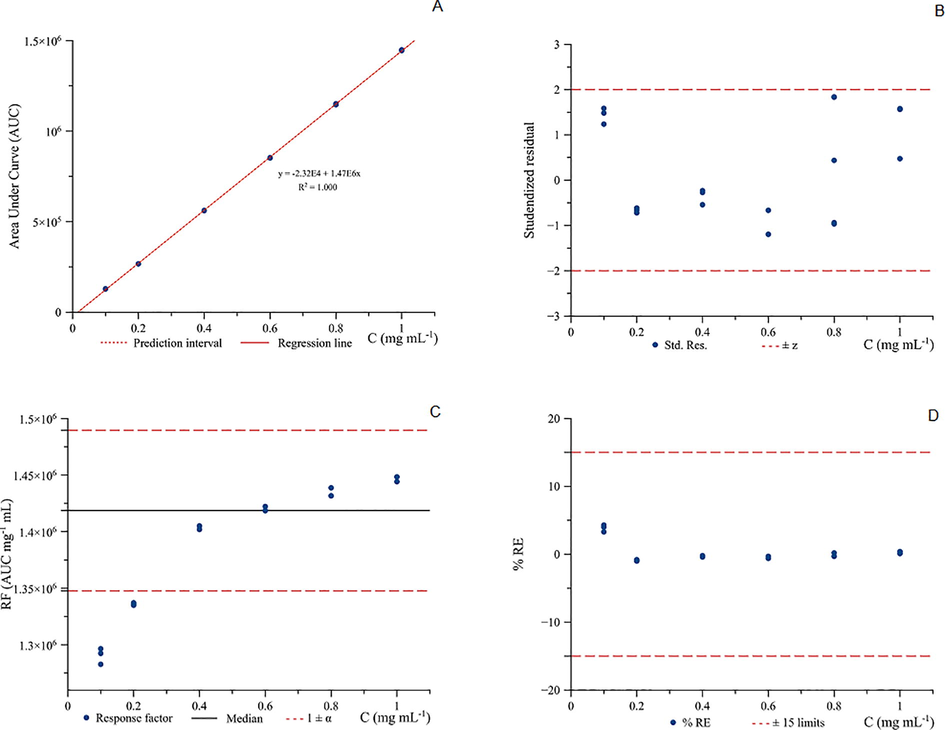
Linearity study for the calibration curve of acetonitrile by GC-FID in the calibration range, 0.1 to 1.0 mg mL−1.
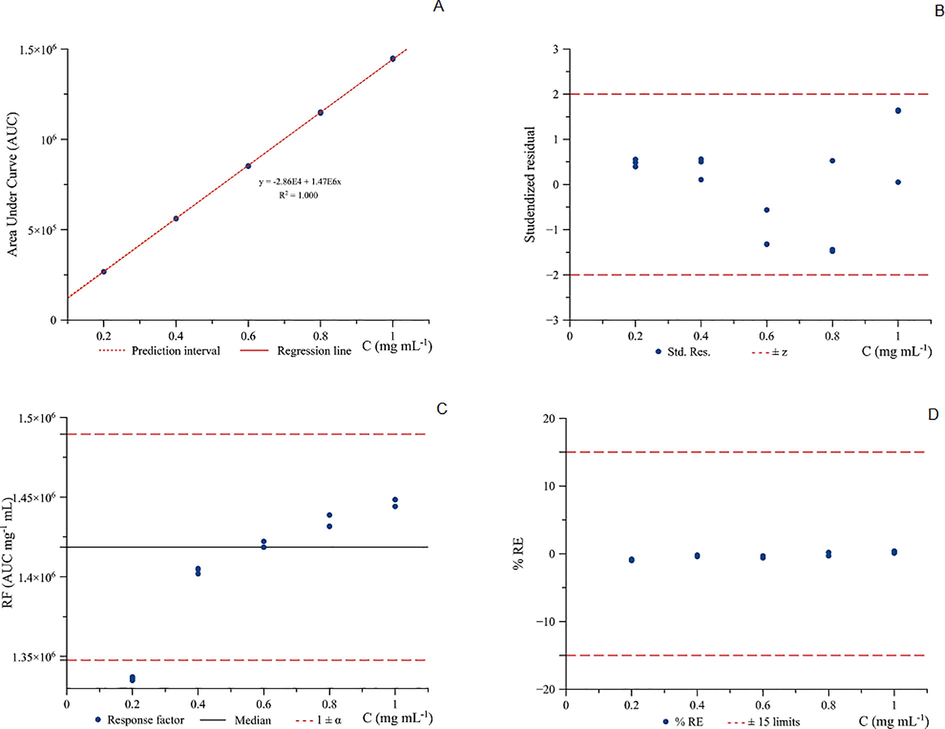
Linearity study for the calibration curve of acetonitrile by GC-FID in the calibration range, 0.2 to 1.0 mg mL−1.
The calibration line for acetonitrile has been optimised by using the concentration range between 0.2 and 1.0 mg mL−1. The logistic regression analysis, R2 was maintained but most remarkably improved was the response factor and the back-calculated %RE (Fig. 4C. and 4D.). The back-calculated %RE was lower than 1% (Fig. 4D.).
The estimated LOD and LOQ were subsequently verified by the independent analysis of solutions prepared solutions at these ranges (n = 6). The LOD and LOQ were higher for ethanol when compared to acetonitrile as the concentration range of the calibration curve were not similar (Mihon et al., 2017). The LOD was observed but not generally quantified as an accurate value, while LOQ demonstrated excellent precision (RSD below 5%) and accuracy (recovery from 84.8 to 104.6%) for both solvents.
The assessment of precision for repeatability and intermediate precision was carried out by the RSD % acquired from the recovery analysis (<2%). A statistical analysis of Student’s T-test was carried out and confirmed that there is no statistical difference between the result (p > 0.05).
In the evaluation of accuracy, the recovery values ranging between 96 and 119% and 95 to 99% of the spiked value for ethanol and acetonitrile respectively, were in agreement with the literature (dos Santos Costa et al., 2019). The recovery value was slightly higher for ethanol at the concentration of 6.0 mg mL−1 probably due to an interaction of analytes in the spiked that causing higher response obtained. Table 3 below summarised the linearity study, regression analysis, LOD and LOQ, assessment of precision and recovery. RSDIP = Relative standard deviation from intermediate precision. * Indicates inter-day. RSDr = Relative standard deviation from repeatability
Analyte
Linear regression equation
Correlation Coefficient (R2)
LOD
LOQ
RSDIP (%)
Recovery (%) ± RSDr %
Low level
Middle level
High level
Ethanol
y = 181,422.3x + 11,167.4
0.999
0.109
0.331
0.09 / *0.12
96 ± 0.6
108 ± 0.4
119 ± 0.2
Acetonitrile
y = 1,472,548.8x – 28,573.6
1.000
0.004
0.012
0.16 / *0.56
95 ± 1.7
96 ± 0.8
99 ± 0.9
Another critical element for validating the proposed method is the method’s robustness. Robustness is best described as the ability of the analytical method to remain unchanged, even in the presence of minor variations which have been intentionally implemented in the experimental conditions (Bosque-Sendra et al., 1999; Ferreira et al., 2017). The two-level full factorial was selected to evaluate the robustness of the proposed method as it is possible to assess the significance of all main effects and their interactions without confusing them. Besides, it is the most efficient chemometric tool for assessing robustness when the number of factors is not high (Ferreira et al., 2017).
In the evaluation of the robustness of the proposed method, the experimental matrix was developed based on altering factors related to the optimised conditions, taking into account the retention time of ethanol and acetonitrile as a response. The carrier gas flow was adjusted from 3.0 mL min−1 to 3.2 mL min−1, and the injection split ratio was modified from 50 to 30. The experiments were conducted randomly, and the findings were presented in Table 4. All the standardised effect values attained were below 4.303, the critical value of Student’s t-test for the degree of freedom of 2 at a confidence level of 95%. The proposed method is, therefore, robust for the experimental matrix set out in the analysis of robustness.
Parameters
Standardised effects
Ethanol
Acetonitrile
Carrier gas flow (mL min−1) (CG)
3.27
0.66
Injection split ratio (ISR)
4.19
0.42
CG × ISR
0.20
0.00
The calculated standardised effects for ethanol was found higher than the acetonitrile due to variations in the retention time of ethanol when changes were made to the proposed experimental method. Nevertheless, the RSD % for the precision was still <2%.
3.3 Application of the procedure
Following the production of [18F]FET, [18F]FMISO and [18F]FLT samples, ethanol and acetonitrile in the samples were evaluated using the developed method. Ethanol and acetonitrile were well resolved and determined within 3.5 min, with a total analysis time of<5 min, including sample injection and separation. Table 5 displays the concentration values for the radiopharmaceuticals, and all tested samples were within the acceptance range (ethanol < 5.0 mg mL−1; acetonitrile < 0.41 mg mL−1).
Sample (n = 3)
Average concentration (mg mL−1)
Ethanol
Acetonitrile
[18F]FET
1.22
0.14
[18F]FMISO
1.38
0.18
[18F]FLT
1.11
0.13
The separation between the two peaks was excellent. The total analysis time of<5 min was acceptable, as the procedures described in the literature required a total separation time of >5 min (Mihon et al., 2017). Even though the carrier gas flow and column temperature influence the analysis time, the size of the column’s internal diameter also plays a significant role from our point of view.
According to the author’s perspective, in any proposed method, the resolution between the adjacent peaks is also imperative as is the total analysis time. Excellent resolution, preferably R>5 is needed especially when the GC column begins to age, which may cause the peak to appear broad and potentially increase the tailing factor, 1 < T < 2. These results provide evidence that with a 0.53 mm of an internal diameter of the column, the resolution of adjacent peaks was excellent and comparable to the column size of 0.25 mm and 0.32 mm (Channing et al., 2001; dos Santos Costa et al., 2019; Kilian et al., 2014; Nader et al., 2011).
The analysis time also was within 3.5 min and shorter than the previous study when similar column sizes were used (Mihon et al., 2017). Nevertheless, the study did not specify the carrier gas flow. The lower injection split ratio of 1:15 used in the study was suspected to contribute to the longer analysis time as a lower injection split ratio takes longer time for the sample to enter the column (Mihon et al., 2017). The shorter analysis time observed in others was unsurprising given the smaller internal diameter of the column, 0.25 mm and 0.32 mm, which was used. The tabulated data in Table 6 below showed a 0.53 mm of the internal diameter of the column might require a longer time for the total separation Rt : retention time *** :not specifically mentioned the exact value
Solvent Rt
Optimised method
(dos Santos Costa et al., 2019)
(Mihon et al., 2017)
(Nader et al., 2011)
(Kilian, Pękal, et al., 2014)
(Klok & Windhorst, 2006)
(Channing et al., 2001)
Ethanol
2.61
1.20
4.55
2.44
0.90
4.50
2.26
Acetonitrile
3.45
1.40
5.37
2.68
0.95
4.10
1.76
ID of column used
0.53 mm
0.25 mm
0.53 mm
0.32 mm
0.32 mm
2 mm
0.25 mm
Resolution
7.9 – 8.1
7.9 – 8.5
> 2.0*
> 1.5*
> 2.0*
*
*
4 Conclusion
The experimental factors of carrier gas flow and injection split ratio were successfully optimised through a multivariate approach. The proposed method has been validated to meet all acceptance criteria and provides excellent linearity and resolution of an adjacent peak, adequate analysis time and robustness. The proposed method also has been successfully applied in [18F]FET, [18F]FMISO and [18F]FLT samples for the quantitative determination of ethanol and acetonitrile. The proposed method is relevant for routine organic solvent quality control analysis for any 18F-radiopharmaceutical derivatives.
5 Availability of data and materials
The datasets used and analysed during the current study are available on a reasonable request from the corresponding author.
Author contributions
All authors contributed to the study conception and design. Material preparation, data collection and analysis were performed by HH. The first draft was written by HH, and all authors made comments. All authors read and approved the final manuscript.
Funding
All authors would like to thank the Universiti Putra Malaysia (UPM) and the Ministry of Higher Education Malaysia for supporting this work under Putra Grant (9580700) and Hadiah Latihan Persekutuan – SLPP.
Acknowledgements
All authors sincerely thank the funding agencies mentioned above, as well as the Centre for Diagnostic Nuclear Imaging (CDNI), Universiti Putra Malaysia (UPM) and Department of Nuclear Medicine, National Cancer Institute, Putrajaya.
Declaration of Competing Interest
The authors declare that they have no known competing financial interests or personal relationships that could have appeared to influence the work reported in this paper.
References
- Generic gas chromatography flame ionization detection method using hydrogen as the carrier gas for the analysis of solvents in pharmaceuticals. J. Pharm. Biomed. Anal.. 2019;165:366-373.
- [CrossRef] [Google Scholar]
- Simplex optimization: a tutorial approach and recent applications in analytical chemistry. Microchem. J.. 2016;124:45-54.
- [CrossRef] [Google Scholar]
- Decision protocol for checking robustness with previous outlier detection in the validation of analytical methods. Fresenius’ J. Anal. Chem.. 1999;365(6):480-488.
- [CrossRef] [Google Scholar]
- Analysis of residual solvents in 2-[18F]FDG by GC. Nucl. Med. Biol.. 2001;28(4):469-471.
- [CrossRef] [Google Scholar]
- A generic static headspace gas chromatography method for determination of residual solvents in drug substance. J. Chromatogr. A. 2010;1217(41):6413-6421.
- [CrossRef] [Google Scholar]
- Simultaneous optimization of several response variables. J. Qual. Technol.. 1980;12(4):214-219.
- [CrossRef] [Google Scholar]
- dos Santos Costa, C. L., Ramos, D. P., & da Silva, J. B., 2019. Multivariate optimization and validation of a procedure to direct determine acetonitrile and ethanol in radiopharmaceuticals by GC-FID. Microchemical Journal, 147(November 2018), 654–659. DOI:10.1016/j.microc.2019.03.050.
- Extraction and preconcentration of residual solvents in pharmaceuticals using dynamic headspace–liquid phase microextraction and their determination by gas chromatography–flame ionization detection. Biomed. Chromatogr.. 2017;31(2):e3788.
- [CrossRef] [Google Scholar]
- Robustness evaluation in analytical methods optimized using experimental designs. Microchem. J.. 2017;131:163-169.
- [CrossRef] [Google Scholar]
- Multivariate optimization techniques in analytical chemistry - an overview. Microchem. J.. 2018;140:176-182.
- [CrossRef] [Google Scholar]
- Assessing the influence of neglected GC-FID variables on the multiple responses using multivariate optimization for the determination of ethanol and acetonitrile in radiopharmaceuticals. SN Appl. Sci.. 2021;3(2):251.
- [CrossRef] [Google Scholar]
- International Council for Harmonisation Of Technical Requirements for Pharmaceuticals for Human Use. (2006). ICH Topic Q2 (R1) Validation of Analytical Procedures: Text and Methodology. ICH Harmonised Guideline (Vol. 333). 10.1136/bmj.333.7574.873-a
- International Council for Harmonisation Of Technical Requirements for Pharmaceuticals for Human Use, 2018. Ich Q3C(R7) Impurities Residual Solvents. ICH Harmonised Guideline, 4(October 2002).
- Some practical considerations for linearity assessment of calibration curves as function of concentration levels according to the fitness-for-purpose approach. Talanta. 2017;172:221-229.
- [CrossRef] [Google Scholar]
- A fast method for the determination of residual solvents in 18FDG and 11C-methionine samples. Microchem. J.. 2014;115:95-99.
- [CrossRef] [Google Scholar]
- Residual solvent analysis by gas chromatography in radiopharmaceutical formulations containing up to 12% ethanol. Nucl. Med. Biol.. 2006;33(7):935-938.
- [CrossRef] [Google Scholar]
- A new dimension in separation science: comprehensive two-dimensional gas chromatography. Angew. Chem. Int. Ed.. 2012;51(42):10460-10470.
- [CrossRef] [Google Scholar]
- Fast method for the determination of residual solvents in radiopharmaceutical products. Rev. Chim.. 2017;68(4):666-670.
- [Google Scholar]
- Improved quality control of [18F]fluoromethylcholine. Nucl. Med. Biol.. 2011;38(8):1143-1148.
- [CrossRef] [Google Scholar]
- A review of multivariate designs applied to the optimization of methods based on inductively coupled plasma optical emission spectrometry (ICP OES) Microchem. J.. 2016;128:331-346.
- [CrossRef] [Google Scholar]
- Multivariate optimization of capillary electrophoresis methods: a critical review. J. Pharm. Biomed. Anal.. 2014;87:290-307.
- [CrossRef] [Google Scholar]
- Static headspace gas chromatographic method for quantitative determination of residual solvents in pharmaceutical drug substances according to European Pharmacopoeia requirements. J. Chromatogr. A. 2004;1057(1–2):193-201.
- [CrossRef] [Google Scholar]
- 18 F-labeled peptides: the future is bright. Molecules. 2014;19(12):20536-20556.
- [CrossRef] [Google Scholar]
- Methods for the determination of limit of detection and limit of quantitation of the analytical methods. Chronicles Young Scientists. 2011;2(1):21.
- [CrossRef] [Google Scholar]
- Analytical procedures for quality control of pharmaceuticals in terms of residual solvents content: challenges and recent developments. TrAC - Trends Anal. Chem.. 2016;80:328-344.
- [CrossRef] [Google Scholar]
- Notes on Statistics and Data Quality for Analytical Chemists. Imperial College Press; 2011.
- [CrossRef]
- Design and challenges of radiopharmaceuticals. Semin. Nucl. Med.. 2019;49(5):339-356.
- [CrossRef] [Google Scholar]
- Residual solvents in pharmaceutical products: Acceptable limits, influences on physicochemical properties, analytical methods and documented values. Eur. J. Pharm. Biopharm.. 1997;43(3):215-242.
- [CrossRef] [Google Scholar]


