

Translate this page into:
Multispectroscopic and molecular docking studies on the interaction of diltiazem hydrochloride with bovine serum albumin and its application to the quantitative determination of diltiazem hydrochloride
⁎Corresponding author. nafisurrahman05@gmail.com (Nafisur Rahman)
-
Received: ,
Accepted: ,
This article was originally published by Elsevier and was migrated to Scientific Scholar after the change of Publisher.
Peer review under responsibility of King Saud University.
Abstract
The interaction between diltiazem hydrochloride (DTZ) and bovine serum albumin (BSA) was probed by fluorescence, UV–vis absorption, Fourier transform infrared, circular dichroism spectroscopies and molecular docking analysis at pH = 7.4. The decrease in Stern-Volmer quenching constants with rising temperature illustrated the static nature of fluorescence quenching. The distance between DTZ and BSA was evaluated and found to be 1.40 nm. The thermodynamic parameters such as ΔG, ΔH and ΔS were computed which illustrated the spontaneous and endothermic nature of binding of DTZ with BSA. Molecular docking evaluation indicated that DTZ fits into the binding pocket of subdomain I-B (site III). A spectrofluorimetric method was developed based on fluorescence quenching of BSA by DTZ to quantify diltiazem in tablets.
Keywords
Diltiazem hydrochloride
Bovine serum albumin
Binding
Fluorescence
Quantification

1 Introduction
Hypertension is considered as a major health challenge due to its propagation worldwide and causing ischaemic heart diseases and acute kidney diseases. Diltiazem hydrochloride (DTZ) is a medication used not only in the treatment of hypertension but also to cure angina pectoris (Markham and Brogden, 1993). After oral administration, three metabolites namely O-desacetyl diltiazem, N-desmethyl-O-desacetyl diltiazem and N-desmethyl diltiazem were formed which are pharmacologically active (Dasandi and Shah, 2009). The purity of active pharmaceutical ingredients ensures the quality of the drug, which enhances the remedial effect and decreases the toxicity. Therefore, an analytical investigation of drug substances and their related impurities is necessary. Several analytical methods have been developed to quantify active pharmaceutical ingredients, impurities, metabolites and degradation products in different matrices (Rahman and Azmi, 2000a; Rahman et al., 2006, 2007; AlOthman et al., 2013; Siddiqui et al., 2017; Husain et al., 2021).
Serum albumin serves as carrier protein due to its large abundance and hence transport drug molecule to its site of action (Sood et al., 2018). The literature survey revealed that the structural analogy between bovine serum albumin (BSA) and human serum albumin (HSA) makes BSA an ideal protein to assess the drug protein interaction (Guo et al., 2009). It was also stated that the similarity between BSA and HSA in terms of amino acid sequence and identity is about 86% and 75.6%, respectively (Siddiqui et al., 2021). BSA is made up of a single chain of about 583 amino acid residues. The amino acid chain is consisting of 3 homologous but structurally different domains (I, II, III) (Fig. S1). These domains are further segregated into 9 loops by disulfide bonds. The drug binding property of BSA provides pharmacokinetic and pharmacodynamic data of drug molecules (Monirinasab et al., 2022).
The binding affinity of drug molecules to serum albumin may have direct effect on absorption, distribution, metabolism and excretion (Shi et al., 2018). The reaction of astilbin with BSA was probed by different spectroscopic approaches to gather information about the binding forces and conformational changes in BSA (Liu et al., 2018). Bao et al. (2018) have investigated the interaction between DTZ and BSA by fluorescence spectroscopy only. However, they have not studied in detail on DTZ-BSA interactions involving multi-spectroscopic approaches with molecular docking. The studies based on multi-spectroscopic techniques and molecular docking are useful to understand the binding sites for DTZ in the protein and stability of docked DTZ-protein system. Circular dichroism spectra illustrated the secondary structural changes in BSA on interaction with DTZ but this technique was not used by Bao et al.
The purpose of this work was to systematically probe the interaction of DTZ with BSA employing multi-spectroscopic methods and molecular docking. The binding mechanism was examined on the basis of thermodynamic studies of BSA-DTZ complex at different temperatures. Synchronous fluorescence, FTIR and circular dichroism spectroscopy were used to examine the conformation change of BSA due to complex formation with DTZ. Molecular docking was used to check the binding mode. Site marker studies were conducted to validate the binding site. Additionally, a spectrofluorimetric method was developed based on DTZ-BSA interaction to determine the concentration of DTZ in tablets.
2 Experimental
2.1 Reagents and chemicals
Procurements of BSA (fraction V, about 96%) and DTZ (>99%) were done from HiMedia Laboratories (India) and Sigma Aldrich (U.S.A.), respectively. Warfarin (>98%; TCI, Japan), ibuprofen (>98%; Sigma Aldrich) and indomethacin (98.5–100.5%; Sigma Aldrich) were used for site marker studies. NaH2PO4·H2O (99%) and Na2HPO4·2H2O (99%) were obtained from Central Drug House (P) Ltd, India to prepare a buffer solution (pH 7.4). The stock solutions of BSA (10 μΜ) and DTZ (1 mg/mL) were made in phosphate buffer solution (0.1 M; pH 7.4) and distilled water, respectively.
2.2 Fluorescence measurement
All fluorescence analyses were performed using a Fluorescence Spectrophotometer (Model: 2700, Hitachi High-Tech Corporation, Tokyo, Japan) fitted with quartz cells of 1 cm and a xenon lamp. Fluorescence spectra of solutions containing 5 µM BSA and varied concentration of DTZ (5–35 µg/mL) were scanned in the emission wavelength range from 300 to 540 nm using 280 nm as excitation wavelength at 283, 298 and 308 K. The measured fluorescence intensities were corrected using Eq. (1):
2.3 UV-absorption spectra
The absorption spectra of BSA (5 µM), DTZ (5–20 µg/mL) and DTZ-BSA were scanned from 200 to 350 nm using Perkin-Elmer Lamda-45 spectrometer. In DTZ-BSA system, varying concentration of DTZ was mixed with BSA (5 µM) and measured at 298 K.
2.4 Fluorescence resonance energy transfer (FRET)
The absorption spectrum of DTZ (5 μM) was measured in the wavelength range 300–550 nm whereas the fluorescence spectrum of BSA (5 μM; λex = 280 nm) was also obtained in the same wavelength region. The overlapping of absorption spectrum of DTZ with fluorescence spectrum of BSA was utilized to compute the energy transfer.
2.5 Circular dichroism (CD)
CD experiments were conducted using Jasco J-815 circular dichroism spectrometer fitted with temperature-controlled Peltier device, 150 W Xenon arc lamp and 2.0 mm quartz cuvette. Instrument specifications were response time 1 s, scanning rate 100 nm min−1 and wavelength range 190–300 nm. The instrument was continuously purged with N2 gas to remove the moisture content before and during the experiment.
2.6 Fourier transform infrared (FTIR) measurement
FTIR spectra of BSA and DTZ-BSA were scanned from 4000 to 400 cm−1 using FTIR spectrometer (PerkinElmer).
2.7 Molecular docking
BSA crystal structure was obtained from the protein data bank (PDB ID: 3 V03). Diltiazem structure was drawn in chemdraw 12.0 with energy minimization of MM-2 method implemented in Chem.3D Pro 12.0 and structure was saved in pdb format. Auto Dock Vina program was used for docking. All water molecules were pulled out and all polar hydrogens were added for smooth docking without hindrance. Grid parameters were set as 76 × 76 × 76 Å with grid center x = 38.078, y = 22.708, z = 40.771 to envelope all active site residues. Kollman and Gasteiger charges were added to drug and protein with Auto Dock Tools (ADT), respectively and the file was saved in pdbqt format. BSA was held as rigid whereas DTZ was flexible. Accelrys Discovery Studio 4.5 software was used to examine the energy minimized output files of the auto dock vina.
2.8 Analytical application
2.8.1 Procedure for determination of DTZ
Different concentrations of DTZ (3–50 µg/mL) were taken into various volumetric flasks (10 mL) containing a fixed BSA concentration (5 μM). The total volume was maintained at 10 mL with the phosphate buffer solution (pH 7.4). The fluorescence quenching of BSA was measured at 340 nm after excitation at 280 nm. The calibration curve was established by plotting (F0/F) versus DTZ concentration (µg/mL). The quantity of DTZ in the sample was computed from the calibration curve.
2.8.2 Procedure of reference method (Rahman and Azmi, 2000b)
Different volumes of DTZ (1.2 mg/mL) equivalent up to 50 µg/mL were transferred into various boiling tubes followed by sodium metavanadate (2.6 mL, 0.10 M) and H2SO4 (4 mL, 13.0 M). The mixture was heated on water bath for 20 min and then cooled. Thereafter, solution was taken into volumetric flask (10 mL) and water was added to complete the volume. Absorbance measurement was made at 750 nm.
2.8.3 Determination of DTZ in tablets
Two commercially available tablets were separately weighed, powdered and dispersed in distilled water with shaking. The insoluble materials were isolated by filtration. The filtrate was taken into a volumetric flask (100 mL) and diluted with distilled water. Further dilutions were made, if necessary. The determination of DTZ was carried out according to the procedure given in Section 2.8.1.
3 Results and discussion
3.1 Fluorescence quenching mechanism
BSA exhibits a fluorescence emission peak at 340 nm when excited at 280 nm while DTZ showed no intrinsic fluorescence. The fluorescence intensity of BSA decreases successively and the maximum emission wavelength moved from 340 nm to 351 nm with increasing concentration of DTZ at 298 K (Fig. 1(a)). The decrease in BSA fluorescence indicated the complex formation between DTZ and BSA. Additionally, the blue shift in maximum wavelength emission described the alteration in conformation of BSA. The blue shift also pointed towards decrease in polarity around the tryptophan residues and increase in hydrophobicity. The experiments were also conducted under the same conditions at 283 K and 308 K and it was found that the quenching decreases with increasing temperature. The fluorescence quenching caused by DTZ was analyzed by Stern-Volmer equation which is expressed as:
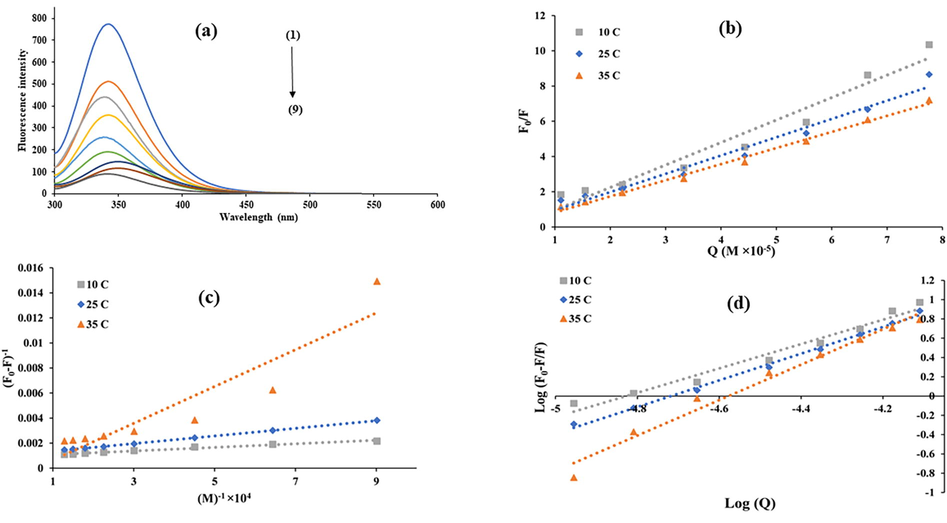
(a) Fluorescence quenching spectra of BSA (b) Stern-Volmer plots for BSA-DTZ system (c) Lineweaver-Burk plots for BSA-DTZ system and (d) binding plots for BSA-DTZ system; with varying concentration of DTZ [(1) without DTZ (2) 5 µM (3) 7 µM (4) 10 µM (5) 15 µM (6) 20 µM (7) 25 µM (8) 30 µM and (9) 35 µM at pH = 7.4.
Stern-Volmer parameters
Lineweaver-Burk parameters
Binding parameters
Temperature (K)
KSV
(L/mol)Kq
(L/mol s−1)R2
KLB
(L/mol)R2
Ka
(L/mol)n
R2
283
1.27 × 10⁵
1.27 × 10¹³
0.955
9.00 × 10⁴
0.980
1.25 × 10⁶
1.26
0.973
298
1.03 × 10⁵
1.03 × 10¹³
0.973
3.33 × 10⁴
0.999
3.36 × 10⁶
1.38
0.995
308
9.13 × 10⁴
9.13 × 10¹²
0.993
8.00 × 10³
0.862
2.65 × 10⁸
1.80
0.979
The Lineweaver equation (Abdelhameed et al., 2015) was also applied to analyze the type of quenching which is expressed as:
The plot of vs yields a straight line (Fig. 1(c)) which indicates static quenching. Moreover, the KLB values (Table 1) decreased as the temperature rises, pointing towards static quenching.
3.2 Binding constant and binding site
The binding constant and number of binding sites for a system obeying static quenching can be obtained from Eq.4:
Here, and n describe the binding constant and the number of binding sites, respectively. The and n values were computed from log /F vs plots at 283, 298 and 308 K (Fig. 1d). The results are listed in Table 1. The value increased as a function of temperature which suggested more stability of DTZ-BSA system at higher temperature. The values were higher at all the temperatures studied which illustrated a strong interaction between BSA and DTZ. This demonstrated that DTZ could be transported by BSA via blood circulation to other organs in vivo. Also, the n value is almost 1 which suggested the presence of one binding site for DTZ in BSA molecule.
3.3 Thermodynamic study
The thermodynamic parameters such as ΔG, ΔH and ΔS were assessed at 283, 298 and 308 K using Eqs. (5) and (6):
The values of binding constants at 283, 298 and 308 K were obtained from Eq. (4). R is a gas constant (8.314 J mol−1 K−1). The ΔH and ΔS values were computed from Van’t Hoff plot (Fig. S2). The values of ΔG were −31.57, −40.91 and −47.14 kJ mol−1 at 283, 298 and 308 K, respectively which demonstrated the spontaneous nature of interaction between DTZ and BSA. The ΔH and ΔS values were computed as 144.74 kJ mol−1 and 0.62 kJ mol−1 K−1, respectively. The value of ΔS indicated that the water molecules which are present in an ordered manner around the drug and protein molecules get more randomness due to hydrophobic interactions. Therefore, positive values of ΔH and ΔS illustrated the role of hydrophobic interactions in the binding of DTZ to BSA (Ross and Subramanian, 1981).
3.4 UV–Visible spectroscopy
UV–visible absorption spectra of BSA, DTZ and BSA-DTZ complex are depicted in Fig. S3. The absorption spectrum of BSA showed two bands centered at 210 nm and 280 nm. The peak at 280 nm represents the π-π* transitions arising from phenyl rings of aromatic amino acids. The peak at 210 nm characterizes the α-helical structure of BSA (Rudra et al., 2018). The addition of DTZ to BSA caused a gradual increase in absorption intensity of peak at around 210 nm with a red shift in maximum wavelength of absorption. The results confirmed the formation of complex between DTZ and BSA which also illustrated the alteration in the conformation of BSA.
3.5 Conformational studies.
3.5.1 FTIR spectroscopy
The FTIR spectrum of diltiazem hydrochloride (Fig. 2) shows a band at 1637 cm−1 which refers to C⚌O stretching. FTIR spectrum of BSA indicates the amide I band peaking at 1667 cm−1 which is mainly arising from C⚌O stretching of amide group. The band centered at 1528 cm−1 characterizes the amide II band which presents C—N stretching together with N—H bending. The amide I and amide II bands are considered as most valuable vibrational modes of protein backbone and are related to secondary structure of protein. The FTIR spectrum of DTZ-BSA complex revealed that the amide I band moved from 1667 cm−1 to 1643 cm−1 and amide II band disappeared which indicated that DTZ has reacted with BSA and also pointed towards the change in conformation of BSA structure.
FTIR Spectra of (a) BSA (b) BSA-DTZ (c) DTZ.
3.5.2 Circular dichroism spectra
CD spectra of BSA with and without DTZ at 298 K were recorded (Fig. 3). The CD spectrum of BSA exhibited two negative bands peaking at 208 nm and 222 nm which characterize the π-π* and n-π* transitions of α-helix peptide bonds, respectively. The addition of DTZ decreased the CD signal of BSA and no significant shift in band position was observed which illustrated the loss of α-helix content of BSA and alteration in protein secondary structure. These observations suggested the formation of DTZ-BSA complex. Further, α-helix content of BSA can be assessed after addition of DTZ. CD results are usually represented as mean residual ellipticity (MRE). The MRE (deg cm2 dmol−1) and α-helix content were quantified by Eqs. (7) and (8), respectively.

CD spectra of BSA-DTZ system.
Herein, is the experimental MRE obtained at 208 nm. The α-helix content of BSA (free) at 208 nm was 65.64%. The addition of 4.434 × 10⁻⁵ M DTZ reduces the α-helix content of BSA from 65.64% to 51.99%. Further addition of DTZ (8.87 × 10⁻⁵ M) reduced the α-helix content to 37.24%. These results suggested that the change has occurred in BSA secondary structure on interaction with DTZ.
3.5.3 Synchronous fluorescence spectra
When the Δλ value (
) is held at 15 and 60 nm, the synchronous fluorescence imparts characteristic properties of tyrosine and tryptophan residues of BSA, respectively. The effect of varying concentrations of DTZ on the synchronous fluorescence of BSA is depicted in Fig. 4. It is evident that the maximum emission wavelength (
shifted towards longer wavelength (6.5 nm) when Δλ was set at 15 nm while a red shift of 9.5 nm in
was noticed on setting Δλ at 60 nm upon addition of DTZ to BSA (Fig. 4b). Additionally, the synchronous fluorescence intensity of tyrosine and tryptophan residues decreased upon addition of DTZ. The results indicated the increase in polarity around tyrosine and tryptophan residues and decrease in hydrophobicity which suggested the involvement of tyrosine and tryptophan residues in binding with DTZ.![Synchronous fluorescence spectra (A) at Δλ = 15 nm (B) Δλ = 60 nm for BSA-DTZ system with varying concentration of DTZ [(1) without DTZ (2) 5 µM (3) 7 µM (4) 10 µM (5) 15 µM (6) 20 µM (7) 25 µM (8) 30 µM and (9) 35 µM] at 298 K and pH = 7.4.](/content/185/2022/34/7/img/10.1016_j.jksus.2022.102267-fig4.png)
Synchronous fluorescence spectra (A) at Δλ = 15 nm (B) Δλ = 60 nm for BSA-DTZ system with varying concentration of DTZ [(1) without DTZ (2) 5 µM (3) 7 µM (4) 10 µM (5) 15 µM (6) 20 µM (7) 25 µM (8) 30 µM and (9) 35 µM] at 298 K and pH = 7.4.
3.5.4 Three-dimensional (3D) fluorescence spectroscopy
3D fluorescence spectra and the corresponding contour plots of BSA and DTZ-BSA are displayed in Figs. 5(a) and (b) respectively, and the characteristic parameters are presented in Table 2. Peak a represents the second order scattering peak (λem = 2 λex) while peak b is related to Raleigh scattering peak (λem = λex). The 3-D fluorescence spectrum also exhibited peak 1 and peak 2. Peak 1 demonstrated the fluorescence spectral nature of tryptophan and tyrosine residues. Peak 2 illustrated the fluorescence characteristics of polypeptide backbone of BSA. The fluorescence intensity of peaks 1 and 2 decreases markedly with the addition of DTZ, indicating that the protein molecule's microenvironment is changed because of complex formation.
3D fluorescence spectra of (a) BSA (5 μM), (b) BSA + 5 µg/ml DTZ, (c) BSA + 10 µg/ml DTZ.

Contour plot of (a) BSA (5 μM), (b) BSA + 5 µg/ml DTZ, (c) BSA + 10 µg/ml DTZ.
Peaks
BSA
BSA: DTZ (1:20)
BSA: DTZ (1:40)
Peak
position
(λex/λem) nm/nmStokes
shiftPeak
position
(λex/λem) nm/nmStokes
shiftRelative intensity
Peak
position
(λex/λem) nm/nmStokes
shiftRelative intensity
Peak1
275/340
65
285/340
55
0.78
285/340
55
0.66
Peak2
225/340
115
225/340
115
0.08
225/345
120
0.04
3.6 Forster resonance energy transfer (FRET)
The overlapping of absorption spectrum of DTZ with the emission spectrum of BSA is displayed (Fig. S4). The E (Efficiency of energy transfer) value was determined using Eq. (9) (Forster, 1996).
defines quantum yield of donor molecule, N presents medium’s refractive index,
is dipole’s spatial orientation factor, and
is overlap integral.
can be estimated as:
In the wavelength range λ to λ + Δλ, normalized fluorescence intensity is given by and the molar absorptivity of the acceptor is provided by ε(λ).
The established values of , N, are 2/3, 1.36, 0.15, respectively (Senthilkumar et al., 2016). The computed values of R0, r and are 0.54 nm, 1.40 nm and 2.37 × 10⁻¹⁸ cm3 M−1, respectively. The average distance of <8 nm was obtained between the donor and acceptor, which is evidence for the transfer of energy from BSA to DTZ with high probability. The obtained r value illustrated that the reduction in the fluorescence intensity is due to static quenching mechanism (Suryawanshi et al., 2016).
3.7 Molecular docking
The 3D structure of BSA is heart-shaped with three analogous domains, which are further divided into two subdomains. Auto dock vina gives 9 different conformers of DTZ of varying Gibbs free energy that can bind with the BSA. The best fit model with minimum energy was chosen and the result shows that DTZ was mainly located at subdomain I-B (Yang et al., 2019). Fig. 6 gives 2D View of BSA-DTZ docking whereas Fig. S5 gives the detailed overview. The Gibbs free energy calculated from the docking result is slightly different from the experimental results because the X-ray crystal structure of BSA is different from that which is in the aqueous solution (Neelam et al., 2010). The results of molecular docking are reported in Table S1.
2D View of Docked structure of DTZ-BSA complex.
3.8 Displacement studies
Competitive binding experiments were performed using indomethacin (site IB), warfarin (site IIA) and ibuprofen (site IIIA) as specific binding site markers to locate the DTZ binding site on BSA (Zsila, 2013). The protein and site probes were kept at a constant molar ratio (1:1) and DTZ was varied up to 35 μg/mL. The fluorescence spectra were obtained for BSA-DTZ system with and without site markers at 298 K.
The values of Ksv for BSA-DTZ in the presence of indomethacin, warfarin and ibuprofen were calculated from Stern-Volmer plots (Fig. S6) and found to be 7.30 × 10³, 1.24 × 10⁴ and 1.00 × 10⁴ L mol−1, respectively. The Ksv value for BSA-DTZ system without any site marker was 1.03 × 10⁵ L mol−1. On comparing the Ksv values, it was noticed that in presence of indomethacine Ksv value decreased more dramatically. These results suggested that DTZ competes with indomethacin for I-B site in BSA.
3.9 Method validation
The calibration curve (F0/F vs concentration of DTZ) exhibited linearity in the range of 3–50 µg/mL DTZ with R2 > 0.99. The detection (LOD) and quantification limits (LOQ) were evaluated using Eqs. (12) and (13) (Rahman and Khan, 2016; Lutfullah et al., 2008).
S.D and b are standard deviation of intercept and slope of regression line, respectively. and values were 0.51 µg/mL and 1.70 µg/mL, respectively.
Within-day and between-day precision were assessed with three concentrations (10,20,30 µg/ml) by performing analysis 5 times per day for within-day whereas 5 times once a day for between-day precision (Table S2). The values of RSD (%) were found in the range 0.60–0.87% and 0.71–0.89% for with-in-day and between-day precision, respectively which revealed that the proposed method has acceptable precision.
3.10 Analytical application
The proposed and reference methods were utilized to determine the quantity of DTZ in tablets. The point and interval hypothesis tests were conducted to compare the results of proposed method with the results of reference method (Table 3). At 95% confidence level, the calculated F and t (paired) values were well below the indexed values which illustrated that no significant difference occurred between the methods compared. The interval hypothesis test (Rahman and Khan, 2019) was also conducted to compare the performance of proposed and reference methods based on the true bias which was evaluated using Eq.(14):
Formulations
Proposed method
Reference method
%Recoverya
%RSD
t-valueb
F-valueb
θL%
θU%
%Recovery
%RSD
Dilzem 30
100.0
0.02
0.16
2.19
100.00
101.52
99.6
0.08
Angizem CD 90
100.3
0.42
1.41
2.10
98.67
102.00
99.5
0.70
4 Conclusions
The quenching of BSA fluorescence by DTZ happened through static quenching mechanism because the Stern-Volmer quenching constant decreases from 1.27 × 10⁵ to 9.13 × 10⁴ L mol−1 with increasing temperature (283–308 K). The binding constant of DTZ-BSA complex was found to be 1.25 × 10⁶ L mol−1 at 298 K. The thermodynamic parameters pointed towards the spontaneous and endothermic nature of binding process. Molecular docking and displacement study indicated that DTZ fits into site IB of BSA. The calibration plot showed the linearity in the range 3–50 µg/ml DTZ with LOQ of 1.70 µg/mL. The proposed method was applied to determine diltiazem hydrochloride in tablets.
Acknowledgement
The authors acknowledge the Department of Chemistry, Aligarh Muslim University (A.M.U), for their kind support and instrumentation facility. Nabila Khalil acknowledges the UGC for research fellowship. The authors extend their appreciation to the Researchers Supporting Project number (RSP-2021/191), King Saud University, Riyadh, Saudi Arabia.
Declaration of Competing Interest
The authors declare that they have no known competing financial interests or personal relationships that could have appeared to influence the work reported in this paper.
References
- Spectrofluorimetric study of finasteride and bovine serum albumin interaction and its application for quantitative determination of finasteride in tablet dosage form. Anal. Methods. 2015;12:5096-5102.
- [Google Scholar]
- Canada Health Protection Branch, Ministry of National Health and Welfare: Draft. Ottawa: Canada; 1992.
- Review on pharmaceutical impurities, stability studies and degradation products: an analytical approach. Rev. Adv. Sci. Eng.. 2013;2:1-12.
- [CrossRef] [Google Scholar]
- The Fluorescence Spectroscopic Studies on the Interaction of Diltiazem Hydrochloride with Bovine Serum Albumin. J. Appl. Life Sci. Int.. 2018;18:1-9.
- [CrossRef] [Google Scholar]
- Dasandi, B., Shah, S., Shivprakash. 2009. Development and validation of a high throughput and robust LC-MS/MS with electrospray ionization method for simultaneous quantitation of diltiazem and its two metabolites in human plasma: Application to a bioequivalence study. J. Chromatogr. B: Anal. Technol. Biomed. Life Sci., 877, 791–798. https://doi.org 10.1016/j.jchromb.2009.02.016.
- Modern Quantum Chemistry. 1996;vol. 3:93.
- Spectroscopic studies on the interaction between sodium ozagrel and bovine serum albumin. J. Mol. Struct.. 2009;928(2009):114-120.
- [Google Scholar]
- Identification of metabolic pathways involved in the biotransformation of eslicarbazepine acetate using UPLC-MS/MS, human microsomal enzymes and in silico studies. J. King Saud Univ. Sci.. 2021;33(2021):101281
- [CrossRef] [Google Scholar]
- Characterizing the binding interaction of astilbin with bovine serum albumin: A spectroscopic study in combination with molecular docking technology. RSC Adv.. 2018;8:7280-7286.
- [CrossRef] [Google Scholar]
- Optimized and validated spectrophotometric method for the determination of uranium (VI) via complexation with meloxicam. J. Hazard. Mater.. 2008;155:261-268.
- [CrossRef] [Google Scholar]
- Diltiazem: A review of its pharmacology and therapeutic use in older patients. Drugs Aging. 1993;3:363-390.
- [CrossRef] [Google Scholar]
- Study of β-lactam-based drug interaction with albumin protein using optical, sensing, and docking methods. J. Biol. Phys.. 2022;1–18
- [CrossRef] [Google Scholar]
- Neelam, S., Gokara, M., Sudhamalla, B., Amooru, D.G., Subramanyam, R., 2010. Interaction studies of coumaroyltyramine with human serum albumin and its biological importance, J. Phys. Chem. B. 114, 3005-3012. 10.1021/jp910156k.
- Extractive spectrophotometric methods for determination of diltiazem HCl in pharmaceutical formulations using bromothymol blue, bromophenol blue and bromocresol green. J. Pharm. Biomed. Anal.. 2000;24:33-41.
- [CrossRef] [Google Scholar]
- Spectrophotometric determination of diltiazem hydrochloride with sodium metavanadate. Microchem. J.. 2000;65:39-43.
- [CrossRef] [Google Scholar]
- The importance of impurity analysis in pharmaceutical products: An integrated approach. Accred. Qual. Assur.. 2006;11:69-74.
- [CrossRef] [Google Scholar]
- Quantitation of diltiazem hydrochloride in commercial dosage forms by visible spectrophotometry. J. Chinese Chem. Soc.. 2007;54:185-196.
- [CrossRef] [Google Scholar]
- Circular dichroism spectroscopy: An efficient approach for the quantitation of ampicillin in presence of cloxacillin. Spectrochim. Acta A Mol. Biomol. Spectrosc.. 2016;160:26-33.
- [CrossRef] [Google Scholar]
- Circular dichroism spectroscopy: A facile approach for quantitative analysis of captopril and study of its degradation. ACS Omega. 2019;4:4252-4258.
- [CrossRef] [Google Scholar]
- Thermodynamics of protein association reactions: forces contributing to stability. Biochemistry. 1981;20:3096-3102.
- [CrossRef] [Google Scholar]
- Characterization of the binding of strychnine with bovine β-lactoglobulin and human lysozyme using spectroscopic, kinetic and molecular docking analysis. New J. Chem.. 2018;42:8615-8628.
- [CrossRef] [Google Scholar]
- Plasma protein binding of anisomelic acid: spectroscopy and molecular dynamic simulations. J. Chem. Inf. Model.. 2016;5:2401-2412.
- [CrossRef] [Google Scholar]
- Multi-spectroscopic and molecular modeling approaches to elucidate the binding interaction between bovine serum albumin and darunavir, a HIV protease inhibitor. Spectrochim. Acta, Part A. 2018;188:362-371.
- [CrossRef] [Google Scholar]
- Analytical techniques in pharmaceutical analysis: A review. Arabian J. Chem.. 2017;10:S1409-S1421.
- [CrossRef] [Google Scholar]
- Studying the interaction of drug/ligand with serum albumin. J. Mol. Liq.. 2021;336:116200
- [CrossRef] [Google Scholar]
- Mechanistic interaction study of bromo-noscapine with bovine serum albumin employing spectroscopic and chemoinformatics approaches. Sci. Rep.. 2018;8:1-11.
- [CrossRef] [Google Scholar]
- Spectroscopic analysis on the binding interaction of biologically active pyrimidine derivative with bovine serum albumin. J. Pharm. Anal.. 2016;6:56-63.
- [CrossRef] [Google Scholar]
- Multispectroscopic and molecular modeling studies on the interaction of bile acids with bovine serum albumin (BSA) J. Mol. Struc.. 2019;1180:89-99.
- [CrossRef] [Google Scholar]
- Subdomain IB is the third major drug binding region of human serum albumin: toward the three-sites model. Mol. Pharmaceutics.. 2013;10:1668-1682.
- [CrossRef] [Google Scholar]
Appendix A
Supplementary data
Supplementary data to this article can be found online at https://doi.org/10.1016/j.jksus.2022.102267.
Appendix A
Supplementary data
The following are the Supplementary data to this article:


