

Translate this page into:
Multifactorial antioxidant potential of novel compounds isolated from Zanthoxylum armatum fruits along with cytotoxicity studies on HepG2 cell lines
⁎Corresponding authors at: Phytochemical Technology Depatment, Central Institute of Medicinal and Aromatic Plants, Lucknow 226016, India. khan.zulfanooreen7860@gmail.com (Zulfa Nooreen), nsiddiqui@ksu.edu.sa (Nasir Ali Siddiqui)
-
Received: ,
Accepted: ,
This article was originally published by Elsevier and was migrated to Scientific Scholar after the change of Publisher.
Peer review under responsibility of King Saud University.
Abstract
Abstract
Objective
Oxidative stress causes multidirectional damage including different types of cancers in our body by affecting the normal physiological functions of the cells and tissues. The objective is to study the cytotoxic and antioxidant potential of natural compounds isolated from fruits of Z. armatum DC.
Methods
This study was designed to investigate the chemical nature as well as biological effects of natural compounds. The isolated compounds were tested for antioxidant effect in various ways e.g. DPPH free radical inhibition, ferric reducing effect, superoxide dismutase, and catalase evaluation. The cytotoxic effect of isolated compounds was evaluated using HepG2 cancer cells.
Results
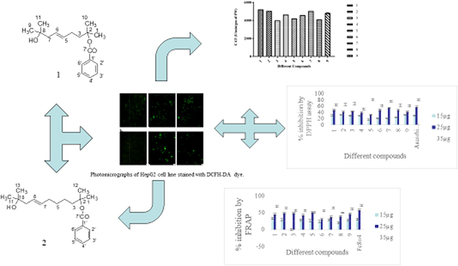
Chemical investigations on the fruits of Z. armatum DC, led to the isolation of two new compounds characterized as (cis)-2, 8-dimethyl-non-5-en-8-ol-2-olyl benzoate (1), (cis)-2, 10-dimethyl-undec-7-en-10-ol-2-olyl benzoate (2) along with five known compounds such as n-dodecanyl linoleniate (3), n-octacos-10, 20-dienoic acid (4), (cis, cis)-dotriacont-6, 12-dienoic acid (5), lignoceric acid (6), and (cis, cis)-dotriacont-6, 8-dienoic acid (7). Compound 1 shows potent activity against HepG2 cancer cells in comparison 2 and significantly affected the viability of cells till 48 hrs. The highest antioxidant potential among compounds and extracts with respect to DPPH free radical inhibition and the ferric reducing effect was shown by compound 1 followed by 2 and 7 with an EC50 value of 19.44, 20.44 and, 22.46 respectively.
Conclusions
The present study indicates that compound (1) showed a significant effect against HepG2 cancer cells as well as antioxidant potential through DPPH and FRAP methods. Compounds 2 and 7 also proved to be useful up to some extent for antioxidant potential.
Keywords
Zanthoxylum armatum
Rutaceae
Fruits
New compounds
Cytotoxic
Antioxidant

- CAT
-
Catalsase
- SOD
-
Superoxide dismutase
- FRAP
-
Ferric reducing antioxidant power
- ROS
-
Reactive oxygen species
- DPPH
-
1,1-diphenyl-2-picrylhydrazyl
- NMR
-
Nuclear magnetic resonance
Abbreviations
1 Introduction
Aromatic tree or large shrub of Zanthoxylum armatum Timur commonly known as prickly ash is an important medicinal plant. Its fruits contain single rounded and shining black seeds, 2–3 mm in size, found in four hot valleys of subtropical to the temperate Himalayas of North-East India and Pakistan, Laos, Myanmar, Thailand, China (Phuyal et al., 2018). It has been traditionally used in the treatment of various diseases such as hypertension, abdominal pain, fever, high altitude sickness, diarrhea, and as a tonic, condiment, and anthelmintic treatment (Mushtaq et al., 2019). Fruits are used for the treatment of toothache, stomachache, dyspepsia, and as a carminative. Seeds are used for condiments and flavoring agents. Young shoots as toothbrushes and are useful for curing gum diseases (Abbasi et al, 2010). The fruits extract is effective in expelling roundworms, due to its deodorant, disinfectant, and antiseptic properties, the fruits are also used in case of dental troubles (Gaur, 1999). Toothache tree or Z. armatum plays an important role in the history of the Indian system of medicines also and its volatile oil possesses active constituents such as linalool, limonene, and lignan. Various studies indicated that it possesses larvicidal, antifungal, hepatoprotective, and allelopathic properties (Singh and Singh, 2011). According to Ayurveda it has been used in swassa, kasa, Ardita, Danta roga, hrdroga, and many more diseases (Anonymous, 2004).
Phytochemical constituents such as alkaloids, sterols, phenolics, lignans, coumarins, terpenoids, flavonoids, and their glycosides and others have been isolated from the plant. Armatamide (1)-, asarinin and fargesin, alpha- and beta-amyrins, lupeol, and beta-sitosterol-beta-D-glucoside-have been isolated from the bark of Zanthoxylum armatum (Kalia et al., 1999), and tambulin, prudomestin, ombuin and 3, 4, 5, 3′, 4′, 5′-hexahydroxydiphenyl ether (Nooreen et al., 2017 A) and 2α-methyl-2β-ethylene-3β-isopropyl-cyclohexan-1β, 3α-diol and phenol-O-β-D-arabinopyranosyl-4′-(3″,7″,11″,15″-tetramethyl)-hexadecan-1″-oate, m-methoxy palmityloxy benzene, acetyl phenyl acetate, linoleiyl-O-α-D-xylopyranoside, m-hydroxyphenoxy benzene and palmitic acid have been isolated from the hexane extract of fruits (Nooreen et al., 2017b) (7S,8R)-guaiacylglycerol-ferulic acid ether-7-O-β-D-glucopyranoside, erythro-1-(4-hydroxyphenyl) glycerol, thero-syringylglycerol, erythro-syringylglycerol, 7-(3-hydroxy-5-methoxyphenyl) propane-7,8,9-triol, threo-guaiacylglycerol, (−)-(7R,8S)-guaiacylglycerol 8-O-β-d-glucopyranoside, xylocoside A, syringing, coniferin, 3-hydroxy-2-{4-[(1E)-3-hydroxyprop-1-en-1-yl]-2-methoxyphenoxy}propyl-d-glucopyranoside, psoralenoside are also reported from Z. armatum fruits (Guo et al., 2017).
2 Material and methods
2.1 Instruments, chemicals and reagents
Melting points were determined using digital melting point apparatus (Sonar) India, whereas Rudolf autopol model polarimeter measured the optical rotations. The solvents, hexane, ethyl acetate, methanol, ethanol, glacial acetic acid, sulphuric acid, hydrochloric acid, were purchased from E-Merck Ltd, India. Pre-coated TLC plates (layer thickness 0.25 mm), silica gel for column chromatography (70–230 mesh ASTM) and LiChroprep RP-18 (40–63 μm) were from Merck (Germany). Authentic standards of chemicals were purchased from Sigma-Aldrich (USA). Ultraviolet–visible spectroscopy was measured with TU-1800PC UV–vis spectrophotometer. Both 1H and 13C NMR spectra were recorded in CDCl3 and CD3OD on a Bruker DRX-300 & 500 model spectrometers operating at 300 and 75 and 500 and 125 MHz, respectively. NMR spectra were obtained in deuterated chloroform, methanol using tetramethylsilane (TMS) as an internal standard, FAB-MS data were recorded on a JEOL SX-102 spectrometer, and Electrospray ionization (ESI) mass spectra were recorded in positive mode on an API-3000, LC/MS/MS (Applied Biosystem/MDS SCIEX, Toronto, Canada) mass spectrometer using a standard ESI source coupled with LC separation system and HR ESI MS in the positive mode was recorded on an agilent 6520 QTOF (ESI-HRMS). Infrared spectroscopy was recorded on an FT-IR spectrophotometer Shimadzu 8201 PC (4000–400 cm−1). Thin layer chromatography was performed on precoated silica gel 60 F254, plates (Merck, layer thickness 0.25 mm). Visualization of the TLC spots was performed using 5% H2SO4 in ethanol spray reagent.
2.2 Plant material
The fruits of Z. armatum were purchased from the local market of Lucknow, State of Uttar Pradesh, India in the month of March 2018 and identified by the Department of Botany and Pharmacognosy, CIMAP. A voucher specimen (ZA/F/14) was deposited in the herbarium of the CSIR-CIMAP, India.
2.3 Extraction of fruits
Dried fruits of Z. armatum (14.5 Kg) in powdered form were extracted with methanol (70 L) by refluxing 8 h for three days and concentrated in vacuo to obtain a semisolid brown mass to yield (2.9 kg) of an extract, which was suspended in water and extracted with hexane, ethyl acetate and, n-butanol, successively, to produce 1.5 kg, 300 g, 258 g and, 603 g extracts, respectively. Isolated compounds (1–7), ethyl acetate fraction (8), and n-butanol fraction (9) was evaluated for cytotoxicity and anti-oxidant potential.
2.4 Isolation of the compounds from ethyl acetate extract of Z. armatum
The ethyl acetate extract (206 g) was subjected to silica gel column (1.5 kg; 60–120 mesh size) and eluted with solvent of n-hexane, n-hexane-EtOAc (9:1–1:9, v/v), EtOAc, and MeOH to give 37 fractions (frs.; each of 10 L). Fractions were checked by TLC and showing complex mixtures, fraction 7 (11 g, n-hexane-EtOAc 7:3) were chromatographed over silica gel column (90 g; 60–120 mesh size, each fraction of 50 ml) yields. The elution was sequentially performed with CHCl3, CHCl3-MeOH (9.5:0.5, 9:1, 8:2 v/v) Compound 1 (10 mg), fraction 26 (3.4 g, obtained in EtOAc) were re-chromatographed over silica gel column (50 g; 200–400 mesh size; each fraction of 20 ml). The elution was sequentially performed with CHCl3, CHCl3-MeOH (1%, 2%, 3%, 4%, 5% v/v) to yield 20 fractions yield Compound 2 (25 mg).
Fraction I (105 gm) was subjected to silica gel column (500 gm; 60–120 mesh size) and eluted with solvent of n-hexane, n-hexane-EtOAc (1:1, 3:7, 2:8, 1:9 v/v), EtOAc, and MeOH to give 17 fractions (each of 15 L). Fraction 2 (25gm, n-hexane-EtOAc 1:1) was chromatographed over silica gel column (50 g; 60–120 mesh size, each fraction of 20 ml) elution was sequentially performed with CHCl3, CHCl3-MeOH (0.5%, v/v) yields 10 fractions yield Compound 3 (10 mg). Fraction 7&8 (41 g, n-hexane-EtOAc 7:3) were chromatographed over silica gel column (120 g; 60–120 mesh size, each fraction of 100 ml). The elution was sequentially performed with CHCl3, CHCl3-MeOH (1%, 2%, 5% v/v) to yields 25 fractions yields Compound 5 (15.2 mg), Compound 6 (20 mg), Fraction 13&14 (20 g, n-hexane-EtOAc 9:1) were chromatographed over silica gel column (100 g; 60–120 mesh size, each fraction of 50 ml) and elution was sequentially performed with CHCl3, CHCl3-MeOH (0.5%, 1%, 2%, 3%, v/v) to yield 12 fractions yields Compound 4 (22 mg), and the isolation of Compound 7 from the method described by Nooreen et al. (2017a).
2.4.1 Compound 1:(cis)-2, 8-dimethyl-non-5-en-8-ol-2-olyl benzoate
Semi-solid, Rf 0.47(CHCl3:MeOH; 9.5:0.5); UV λmax(MeOH): 256, 266, 277; IRνmax (KBr): 3403, 2926, 2856, 1721, 1633, 1548, 1435, 1377, 1177, 1015, 931 cm−1; 1H NMR (MeOD; 500 MHz): δ 6.71 (1H, m, H-4′), 5.99 (1H, m, H-2′), 5.96 (1H, m, H-6′), 5.94 (1H, ddd, J = 1.5, 3.0, 8.5 Hz, H-5), 5.92 (1H, ddd, J = 1.5, 1.5, 8.6 Hz, H-6), 5.59 (1H, m, H-3′), 5.56 (1H, m, H-5′), 3.23 (2H, m, H2-4), 2.2. (2H, m, H2-3), 1.67 (2H, d, J = 7.5 Hz, H2-7), 1.09 (12H, s, Me-1), Me-9, Me-10, Me-11); 13C NMR (CDCl3; 125 MHz): δ 18.48 (C-1), 71.78 (C-2), 33.10 (C-3), 32.70 (C-4), 125.18 (C-5), 129.93 (C-6), 51.22 (C-7), 71.78 (C-8),27.36 (C-9), 18.48 (C-10), 27.36 (C-11), 145.29 (C-1′), 132.98 (C-2′), 133.25 (C-3′), 131.60 (C-4′), 133.25 (C-5′), 132.82 (C-6′), 169.20 (C-7′); ESIMS m/z (rel. int.): 291 [M+H]+, (C18H27O3) (10.2), 245 (8.4); HR-ESI/MS m/z 291.1968 [M+H]+ (calcd. 291.1960 for (C18H27O3).
2.4.2 Compound 2:(cis)-2, 10-Dimethyl-undec-7-en-10-ol-2-olyl benzoate
Semi-solid, Rf 0.34 (CHCl3:MeOH; 9.5:0.5); UV λmax (MeOH): 266 nm; IR νmax (KBr): 3415, 2974, 2928, 1725, 1630, 1550, 1440, 1363, 1258, 1175, 993, 906 cn-1; 1H NMR (CDCl3; 500 MHz)): δ 6.78 (1H, m, H-4′), 6.05 (1H, m, H-2′), 6.01 (1H, m, H-6′), 5.83 (1H, m, H-3′), 5.80 (1H, m, H-5′), 5.67 (1H, ddd, J = 2.5, 7.0, 7.5 Hz, H-8), 5.63 (1H, ddd, J = 8.0, 5.5, 7.6 Hz, H-7), 3.24 (2H, m, H2-6), 2.58 (2H, m, H2-3), 2.29 (2H, m, H2-4), 2.21 (2H, m, H2-5), 1.72 (2H, d, J = 7.0 Hz, H2-9), 1.16 (12H, s, Me-1, Me-11, Me-12, Me-13); 13C NMR (CDCl3 ; 125 MHz): δ 18.20 (C-1), 70.80 (C-2), 32.06 (C-3), 31.87 (C-4), 31.82 (C-5), 31.34 (C-6), 123.60 (C-7), 129.36 (C-8), 50.19 (C-9), 70.80 (C-10), 27.11 (C-11), 26.42 (C-12), 18.26 (C-13), 144.34 (C-1′), 132.01 (C-2′), 131.53 (C-3′), 130.04 (C-4′), 131.39 (C-5′), 131.61 (C-6′, 167.27 (C-7′); ESIMS m/z (rel. int.): 319 [M+H]+ (C20H31O3) (70.4); HR-ESI/MS m/z 319.2278 [M+H]+ (calcd. 319.2273 for C20H31O3).
2.5 Cell viability study on HepG2 cells
The HepG2 (Liver) and lung (A549) cancer cell lines were obtained from the German Collection of Moicroorganisms and Cell Cultures (DSMZ), Braunschweig, Germany. The cell viability of isolated compounds (1–7), ethyl acetate extract and, n-butanol extract was tested using a protocol of Fraga et al. (2008) with slight modifications, and this assay was used to detect the influence of isolated compounds on cell viability using the following protocol (Fraga et al., 2008). The effect of different compounds on the viability of normal and transformed cells was determined by MTT (3- [4, 5-dimethylthiazol-2-yl]-2, 5-diphenyltetrazolium bromide) assay. Briefly, cells were seeded in a 96-well plate at a density of 1 × 10⁴ cells/well. Cells were treated with different concentrations of samples (10 µg, 20 µg, 30 µg, 40 µg, 50 µg, 100 µg, 150 µg, and 200 µg) at 24 h, 48 h, and 72 h to determine the toxic and sub-toxic doses. At the end of treatment, 20 µL MTT (5 mg/mL) was added to each well. After incubation for 3 h, media along with MTT was removed. 200 µL DMSO was added to dissolve the formazan crystal, and absorbance was recorded at 540 nm using an ELISA plate reader. The plot of percent cell viability versus different compounds concentrations was used to calculate the concentration lethal to 50% of the cells (IC50). The cellular morphological changes were observed under inverted phase-contrast microscopy (Nikon Eclipse Ti-S, Tokyo, Japan). A similar test of different compounds was also performed on WRL-68 to examine if the treatment had a distinguishable effect between normal and cancer cells.
2.6 Quantification of intracellular reactive oxygen species (ROS)
Intracellular reactive oxygen species (ROS) generation was analyzed by using fluorescence microscopic imaging technique as per previous protocol (Siddiqui, 2015). Cells (1 × 10⁴ per well) were exposed with compound 1with sub IC50 value and IC50 value, i.e., 25.375 µg/ml and 50.75 µg/ml for 24 h and 48 h. Subsequently, cells were incubated with Dichloro-dihydro-fluorescein diacetate (DCFH-DA, 10 mM) at 37 °C for 30 min and washed with PBS. The intracellular fluorescence intensity of cells was visualized by an inverted fluorescence microscope (Nikon ECLIPSE Ti-S, Tokyo, Japan). For quantitative fluorometric analysis, cells (1 × 10⁴per well) were seeded and treated with different compounds in 96-well black bottom culture plate. Fluorescence intensity was measured with a multiwall microplate reader (Synergy H1 Hybrid Multi-Mode Microplate Reader, BioTek, Winooski, VT) at an excitation wavelength of 485 nm and an emission wavelength of 528 nm. ROS production was quantified using Image J software (Image J, National Institutes of Health, and Bethesda, MD). Data were expressed as a percentage of fluorescence intensity relative to the control wells.
2.7 DPPH radical inhibition activity
The free radical inhibition activity of different compounds (1–7), ethyl acetate extract (8), and butanol extract (9) were determined by 1, 1-diphenyl-2-picrylhydrazyl (DPPH Assay) (Blois, 1958). 3 ml reaction mixture was prepared which contained different concentrations of the crude extract and 0.1 mM methanolic DPPH solution and was incubated for 30 min. The absorbance of each reaction mixture using a spectrophotometer was taken at 517 nm where lower absorbance recorded for the reaction mixture indicated elevated free radical inhibition activity. All extracts were analyzed in triplicates. Ascorbic acid was taken as a standard. Where, A1- Sample absorbance; A0 - Absorbance of the control.
2.8 Ferric reducing antioxidant power (FRAP) assay
This assay is based upon the measurement of the change in absorbance at 593 nm occurring due to the development of blue color. A blue-colored ferrous; Fe2+ − 1,2,5 tripyridyltriazine compound was formed from the colorless oxidized ferric Fe3+ form due to the electron-donating antioxidants (Benzie and Strain, 1996). The FRAP assay solutions consisted of 300 mM acetate buffer pH 3.6, 10 mM, TPTZ (2,4,6- tripyridyltriazine) added in 40 mM HCl and 20 mM FeCl3·6H2O FeSO4 was taken as a standard. Results of percentage scavenging were compared with the standard i.e. Ascorbic acid. Where, A1- sample absorbance A0 – absorbance of the control.
2.9 Assay of antioxidant enzyme (SOD and Catalase) activities
The samples containing the antioxidant enzymes to be tested were prepared by the following steps described by Mukherjee and Choudhuri (1983) with some modifications, Samples were finely ground by pestle in an ice-cold motor in 10 ml of phosphate buffer (KH2PO4/K2HPO4) (100 mM) with pH 7.0, having Na2EDTA (0.1 mM) and also 0.1 g of polyvinylpyrrolidone (PVP) was added to the samples. Filtering of the homogenate using filter paper was done, centrifuged at 15000Xg for 10 min at 4 °C, the supernatant was re-centrifuged at 18000Xg for 10 min, the supernatant was stored at 4 °C for enzyme assay.
2.9.1 Superoxide dismutase (SOD) activity
To measure the SOD enzyme activity a reaction solution of 3 ml was prepared according to the procedure of Giannopolitis and Ries, 1977. Nitro blue tetrazolium (NBT) was photochemically reduced at 560 nm therefore, the inhibition of photochemical reduction of nitro blue tetrazolium (NBT) at 560 nm was measured which determines SOD activity where an amount of enzyme causing 50% inhibition in the photochemical reduction of NBT was termed as one unit of SOD activity.
2.9.2 Catalase activity
Catalase enzyme (CAT) activity was determined by the method of Aebi et al., in a reaction solution (3 ml). The reduction in the absorbance at 240 nm for 1 min with respect to the H2O2 consumption estimated the catalase activity (Aebi, 1984).
2.10 Statistical analysis
All data are expressed as mean ± standard deviation (SD). Statistical analyses were performed using One-way ANOVA. Differences as p < 0.05 were considered statistically significant
3 Result
3.1 Characterization of compounds
Compound 1 (Fig. 1), was obtained as yellow semi-solid mass from ethyl acetate extract and its IR spectrum displayed absorption bands for hydroxyl group (3403 cm−1), ester function (1721 cm−1), unsaturation (1633 cm−1), and aliphatic chain (931 cm−1). Its molecular ion peak was determined at m/z 291 [M+H]+ on the basis of ESIMS and 13C NMR spectra corresponding to the molecular formula of an aromatic ester with aliphatic chain C18H27O3.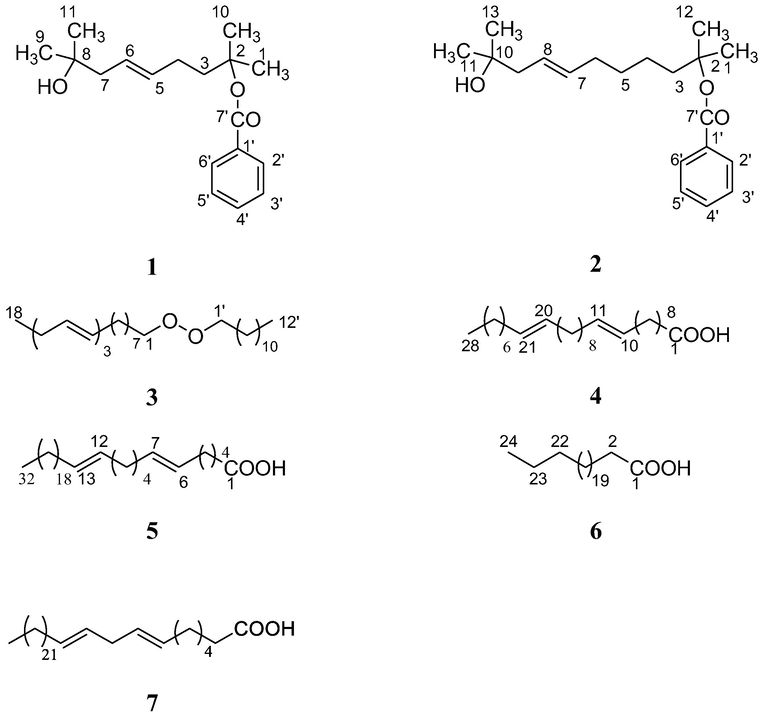
Chemical structures of compounds (1 – 7) isolated from Z. aramtum fruits.
The 1H NMR spectrum of compound 1, showed deshielded signals as a triple-doubles at δ 5.94 (J = 1.5, 3.0, 8.5), 5.92 (J = 1.5, 1.5, 8.6 Hz) and multiplets at δ 6.71, 5.99, 5.96, 5.59 and 5.56 were assigned to vinylic H-5, H-6 and aromatic protons H-2′, H-3′, H-4′, H-5′ and H-6′. Twelve three-proton signals as a broad singlet at δ 1.09, as doublets at δ 1.67 (J = 7.5 Hz), and multiplets at δ 2.20, 3.23 were associated with tertiary C-1, 9, 10, 11 methyls, and C-7, 3, 4 methylene protons. The 13C NMR spectrum of 1, exhibited a signal for ester carbon at δ 169.20 (C-7′), and vinylic carbons appeared at δ 125.18 (C-5), 129.93 (C-6) were assigned. The six aromatic carbons were appeared at δ 145.29 (C-1′), 132.98 (C-2′), 133.25 (C-3′), 131.60 (C-4′), 133.25 (C-5), and 132.82 (C-1′). The methyl and vinylic carbons appeared at δ 18.48 (C-1, 10), 27.36 (C-9, 11) and at δ 125.18 (C-5), 129.93 (C-6), respectively. The methylene and methane carbons were appeared at δ 33.10 (C-3), 32.70 (C-4), 51.22 (C-7), and 71.78 (C-2), 71.78 (C-8), respectively. The presence of C-7′ signal in the deshielded region at δ 169.20, and C-1′ signal also deshielded in at δ 145.29 suggested ketone linkage of the benzene ring.
The 1H–1H COSY spectrum of 1 showed correlations of H-2′ with H-3′ and H-4′; H-7 with H-9, 11 methyls and H-6 methine; H-3 with H-1, and 10 methyls. The HSQC experiment of 1 showed key-correlations between the protons H-2′ at δ 5.99 and C-2′ at δ 132.98; H-6′ at δ 5.96 and C-6′ at δ 132.82; H-5 at δ 5.94 and C-5 at δ 128.18; H-6 at δ 5.92 and C-6 at δ 129.93; H-3 at δ 2.20 and C-5 at δ 33.10; H-4 at δ 3.23 and C-4 at δ 32.70; H-7 at δ 1.67 and C-7 at δ 51.22. The HMBC spectrum of 1 exhibited interaction of H-2′, H-3′ and H-6′ with C-1′; H-3′ and H-4′ with C-5′; H-1 and h-10 with C-2; H-4 with C-5 and C-6; H-7 with C-5, C-6, and C-8; H-9, 11 with C-8. On the basis of the evidence of spectroscopic studies, the structure of 1 was established as (cis)-2, 8-dimethyl-non-5-en-8-ol-2-olyl benzoate (1). This is a new compound and reported the first time in nature.
Compound 2 (Fig. 1), was obtained as yellow semi-solid mass from ethyl acetate extract and its IR spectrum displayed absorption bands for hydroxyl group (3415 cm−1), ester function (1725 cm−1), unsaturation (1630 cm−1), and aliphatic chain (906 cm−1). Its molecular ion peak was determined at m/z 319 [M+H] + (C20H31O3) on the basis of ESIMS and 13C NMR spectra corresponding to the molecular formula of an aromatic ester with an aliphatic chain (C20H31O3).
The 1H NMR spectrum of compound 1, showed deshielded signals as a triple doublet at δ 5.67 (J = 2.5, 7.0, 7.5), 5.63 (J = 8.0, 5.5, 7.6 Hz) and multiplets at δ 6.78, 6.05, 6.01, 5.83 and 5.80 were assigned to vinylic H-8, H-7 and aromatic protons H-2′, H-3′, H-4′, H-5′ and H-6′. Twelve three-proton signals as broad singlet at δ 1.16, as doublet at δ 1.72 (J = 7.0 Hz), and multiplets at δ 3.24, 2.58, 2.29 and 2.21 were associated with tertiary C-1, 11, 12, 13 methyls, C-9, 3–6 methylene protons. The 13C NMR spectrum of 1, exhibited signals for ester carbon at δ 169.20 (C-7′), vinylic carbons at δ 125.18 (C-5), 129.93 (C-6) and aromatic carbons δ 145.29 (C-1′), 132.98 (C-2′), 133.25 (C-3′), 131.60 (C-4′), 133.25 (C-5) and 132.82 (C-1′).
The 1H–1H COSY spectrum of 2 showed correlations of H-2′ with H-3′ and H-4′; H-7 with H-8 and H-6; H-9 with H-11 methyls and H-9 methylene; H-3 with H-1. The HSQC experiment of 1 showed key-correlations between the protons H-2′ at δ 6.05 and C-2′ at δ 132.01; H-6′ at δ 6.01 and C-6′ at δ 131.61; H-7 at δ 5.63 and C-7 at δ 123.60; H-8 at δ 5.67 and C-8 at δ 129.36; H-3 at δ 2.58 and C-3 at δ 32.06; H-4 at δ 2.29 and C-4 at δ 31.87; H-9 at δ 1.72 and C-9 at δ 50.19. The HMBC spectrum of 1 exhibited interaction of H-2′, H-3′ and H-6′ with C-1′; H-3′ and H-4′ with C-5′; H-1 and H-10 with C-2; H-6 with C-7 and C-8; H-9 with C-7, C-8 and C-9; H-11, 13 with C-10. On the basis of these evidences of spectroscopic studies, the structure of 2 was established as (cis)-2, 10-dimethyl-undec-7-en-10-ol-2-olyl benzoate (2). This is a new compound and reported the first time in nature.
3.2 Cytotoxicity evaluation
All the isolated compounds (1–7), ethyl acetate extract (8), and butanol extract (9) were evaluated for cytotoxic activity against the growth of HepG2 and A549 cancer cells in a dose-dependent and time-dependent manner using MTT assay to assess cell inhibition. The results are shown in Table 1. Nine treatments (1 to 9) were screened by using MTT cell viability assay. Compound 1 was the most potent inhibitor of HepG2 cancer cells compared to compounds 2 and 7. It significantly affected the viability of cells till 48 h. After which there was no effect. The IC50 value of 1 was approximately 50 ± 0.05 µg/mL against HepG2 at 24 h. and 25 ± 0.02 µg/mL at 48 hrs against standard drug doxorubicin IC50 of 0.95 ± 0.08 µg/mL at 24 hrs and 1.7 ± 0.01 µg/mL at 48hrs against HepG2 cancer cells. A similar IC50 value for doxorubicin has been reported by other researchers (Khazaei et al., 2017). Compound 2 and 7 also exhibited a certain degree of cytotoxicity with an IC50 value of 52.37 ± 0.04/78 ± 0.02 in 24 hrs/48 hrs and 52.40 ± 0.04/78 ± 0.02 in 24hrs/48 hrs, respectively.
Treatment
IC50 values (μg/mL)
24 h
48 h
48 h
72 h
72 h
HepG2
A549
HepG2
A549
HepG2
A549
1
50 ± 0.05
>100
25 ± 0.02
>100
80 ± 0.03
>100
2
52.37 ± 0.04
>100
78 ± 0.02
>100
75 ± 0.02
>100
3
80.39 ± 0.039
>100
80.39 ± 0.039
>100
84.39 ± 0.039
>100
4
54.83 ± 0.01
>100
80 ± 0.07
>100
76 ± 0.03
>100
5
82.39 ± 0.05
>100
84.39 ± 0.05
>100
84.39 ± 0.05
>100
6
86.00 ± 0.07
>100
98 ± 0.01
>100
95 ± 0.06
>100
7
52.40 ± 0.04
>100
78 ± 0.02
>100
75 ± 0.02
>100
8
57.07 ± 0.02
>100
45 ± 0.02
>100
42 ± 0.03
>100
9
54.60 ± 0.06
>100
55.60 ± 0.06
>100
60.60 ± 0.06
>100
Doxorubicin (Std.)
0.95 ± 0.08
0.85 ± 0.03
1.7 ± 0.01
0.65 ± 0.02
0.2 ± 0.03
0.55 ± 0.03
3.3 Quantification of intracellular reactive oxygen species (ROS) assay
The HepG2 cells treated with compound 1 showed a significant increase in ROS intensity in a dose- and time-dependent manner as compared to untreated cells as shown in Fig. 2. (a) Control cells for 24 h. (b) Cells treated for 24 h with 25.375 µg/mL of compound 1. (c) Cells treated for 24 h with 50.75 µg/mL of 1. (d) Control cells for 48 h. (e) Cells treated for 48 h with 25.37 µg/mL of compound 1. (f) Cells treated for 48 h with 50.02 µg/mL of compound 1. The results of the quantitative measurement of ROS showed that 25.37 µg/mL of compound 1 induced a 122.43% increment in ROS production as compared to untreated cells. Moreover, ROS production was increased by 165.53% (p < 0.001) at 50.75 µg/mL of compound 1 compared to untreated cells. Those findings are properly supported via previous reports, in which the induction inside the ROS generation was documented because of the effect of herbal bioactive compounds (Karimi et al. 2010; Ghali et al., 2014).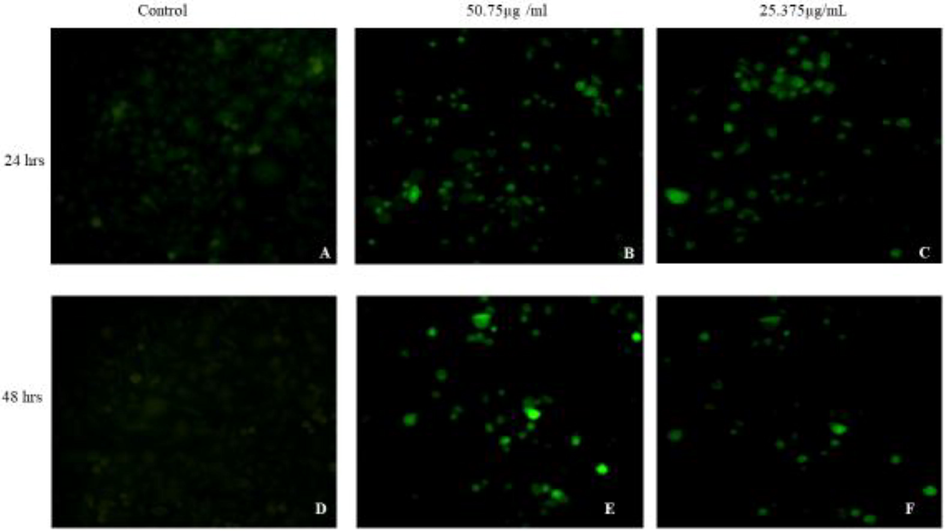
Photomicrographs of HepG2 cell line stained with DCFH-DA dye. Detection of reactive oxygen species in HepG2 cell line where; (A) & (D) are control cells; (B), (C), (E) & (F) are treated cells.
3.4 Antioxidant activity
DPPH free radical inhibition activity of various compounds in various concentrations is depicted in Table 2A, Fig. 3A. The inhibition activity of the different compounds revealed that the highest inhibition was caused by compound 1 followed by 2 and 7 compounds. Inhibition shown by these compounds was far higher than the other compounds and to some extent was comparable to the standard i.e. ascorbic acid over the IC50 value 14.90, 15.44, and 15.53 (Table 3, Fig. 4). Compound 5 recorded the least inhibition having an IC50 value of 20.61 and the rest tested compounds demonstrated moderate inhibition. Results on Fe (III) reduction demonstrated that all the treated extracts and compounds had lower reducing ability than the radical inhibiting activity (Table 2B). 1, 2, and 7 compounds showed the highest reducing ability at an EC50 value of 19.44, 20.44, and 22.46 respectively (Table 3). Compounds showed reducing ability which was nearly comparable to the standard used i.e. FeSO4 (Table 3, Fig. 4). The reducing effect of all the compounds increased with an increase in their concentrations. The highest activity of SOD (427.14 ± 0.52) was reported for compounds 1(Table 4, Fig. 5A). In contrary to this a remarkable decrease in SOD enzyme activity was recorded in compound 6 which was 121.11 ± 0.50 (Fig. 3B).
S. No.
Different Compounds Percentage Inhibition
15 µg
25 µg
35 µg
1
31.2590 ± 0.7400
47.9620 ± 0.8100
63.8990 ± 0.8300
2
31.5880 ± 0.3000
41.8890 ± 0.3000
65.5960 ± 0.5000
3
29.8540 ± 0.4900
43.3150 ± 0.6300
67.9840 ± 0.8200
4
29.2570 ± 0.3400
39.0500 ± 0.4100
51.1080 ± 0.7600
5
17.5090 ± 0.4400
32.9700 ± 0.7100
81.3520 ± 0.5700
6
21.2590 ± 0.3000
48.0900 ± 0.5000
61.8830 ± 0.3000
7
21.0340 ± 0.4000
54.7210 ± 0.7000
75.9410 ± 0.5000
8
24.7830 ± 0.5000
47.6870 ± 0.4000
62.5670 ± 0.7000
9
32.1750 ± 0.5600
42.2120 ± 0.6100
61.1450 ± 0.4900
Ascorbic acid
30.7600 ± 0.3000
57.6900 ± 0.2000
79.8900 ± 0.2000
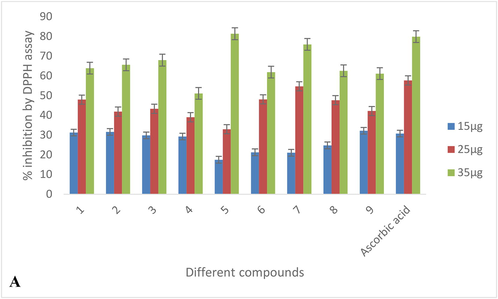
DDPH free radical inhibition caused by different compounds.
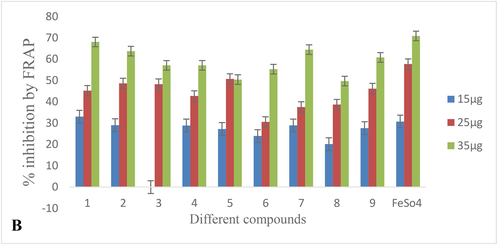
Ferric ion scavenging activity of different compounds.
S.No. Different Compounds Percentage Inhibition
15 µg
25 µg
35 µg
1
33.0300 ± 0.4300
45.1900 ± 0.8100
68.0700 ± 0.6200
2
29.0400 ± 0.6200
48.6100 ± 0.5500
63.7800 ± 0.2900
3
26.3600 ± 0.6000
48.2900 ± 0.7000
57.0900 ± 0.7000
4
28.8700 ± 0.7500
42.7100 ± 0.5200
57.0900 ± 0.3500
5
27.2700 ± 0.7200
50.7400 ± 0.8600
50.4300 ± 0.2800
6
23.9700 ± 0.3000
30.5800 ± 0.2000
55.2777 ± 0.3000
7
28.9100 ± 0.4000
37.5800 ± 0.7000
64.4400 ± 0.5000
8
20.1610 ± 0.4100
38.7000 ± 0.4600
49.7490 ± 0.7800
9
27.6500 ± 0.5000
46.1900 ± 0.3000
60.8500 ± 0.3000
FeSO4
30.7600 ± 0.3000
57.6900 ± 0.2000
70.8900 ± 0.6000
S. No.
Different Compounds
DPPH IC50 (µg/mL)
FRAP EC50 (µg/mL)
1.
1
14.90
19.44
2.
2
15.44
20.44
3.
3
16.62
23.10
4.
4
15.62
23.52
5.
5
20.61
24.86
6.
6
17.62
26.80
7.
7
15.53
22.46
8.
8
18.08
27.65
9.
9
16.62
26.16
10
Ascorbic acid
12.66
–
11.
FeSO4
–
18.02
S. No
Different Compounds
SOD (U/min/gm of FW)
1.
1
427.14 ± 0.52
2.
2
189.80 ± 0.30
3.
3
304.77 ± 0.70
4.
4
225.90 ± 0.53
5.
5
218.60 ± 0.60
6.
6
121.11 ± 0.50
7.
7
206.84 ± 0.20
8.
8
204.10 ± 0.20
9.
9
262.20 ± 0.29
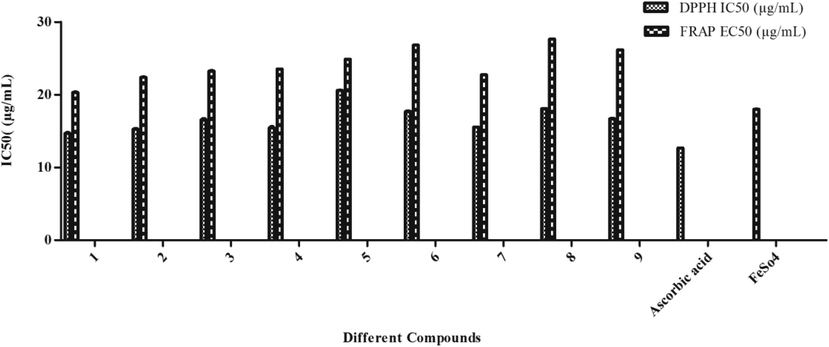
Antioxidant enzyme activity of the different compounds in terms of IC50 and EC50 (µg/mL).
3.5 Catalase activity
Compounds 1, 2, and compound 7 recorded the highest enhancement in enzymatic activities 5212.50 ± 0.61, 5045.83 ± 0.48, and 5030.83 ± 0.70 respectively (Table 5, Fig. 5B). Compound 3 reported the least activity 3995.83 ± 0.60. Considerably higher catalase enzyme activity was recorded in the compounds, particularly which might have aroused due to a large amount of H2O2 generated as the finishing product of SOD catalyzed reaction which has to be neutralized by the optimized treated compounds when compared to control.
S. No
Different Compounds
CAT (U/min/gm of FW)
1.
1
5212.50 ± 0.51
2.
2
5045.83 ± 0.28
3.
3
3995.83 ± 0.60
4.
4
4641.66 ± 0.20
5.
5
4212.50 ± 0.50
6.
6
4587.50 ± 0.60
7.
7
5030.83 ± 0.60
8.
8
4108.33 ± 0.50
9.
9
4825.00 ± 0.40
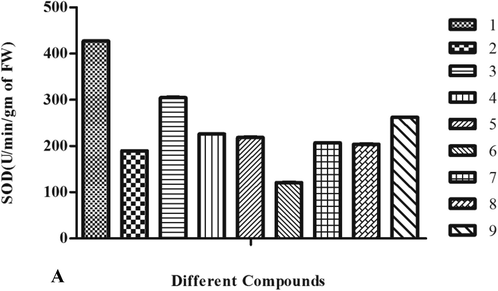
Effect of different compounds and extracts on enzymatic activity (SOD).
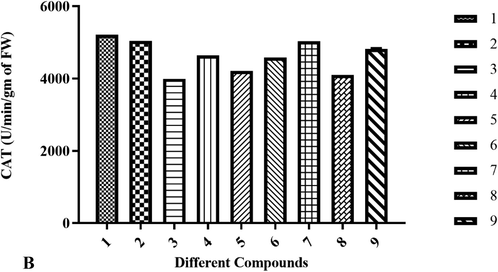
Effect of different compounds and extracts on enzymatic activity (CAT).
4 Discussion
The reported two new compounds belong to the category of aromatic esters (benzoates) with aliphatic chain and the previous studies already proved that the benzoates are very popular for being used as food preservatives (Franco et al., 2019). Antioxidant potential is one of the prerequisites for food preservation. The isolated two new compounds have shown significant antioxidant potential. The cytotoxicity study suggested that compound 1 was the most potent as compared to (2–9) on HepG2 cancer cells while almost no effect on A549 cancer cells. Furthermore, (2–9) did not show cytotoxicity against the human normal liver cell line (WRL-68). Moreover, these cytotoxicity data suggest that compound 1 was the most potent compound isolated from plant extract against HepG2 in comparison to other tested entities in this study. Compound 2 and 7 also exhibited a certain degree of cytotoxicity on HepG2 cell lines. It is also studied previously that alkyl benzoates isolated from red sea sponge Hyrtios erectus possess significant cytotoxicity against breast adenocarcinoma (MCF-7) and hepatocellular carcinoma cells (HepG 2) (Hawas et al., 2018).
The generation of some chemically reactive molecules containing ROS takes place endogenously in most of the cells during deisease development, in response to injury and, even in normal course of metabolism. Reactive oxygen species plays an important role in cellular protection and its physiology and contribute to disease initiation, progression and severity. The major physiological functions affected by ROS include proliferation, migration, hypertrophy, differentiation, cytoskeletal dynamics, and metabolism. The excess of ROS leads to its reaction with lipids, proteins, and nucleic acid, thereby altering structural and functional properties of target molecules and leading to tissue dysfunction and injury (Kathy et al., 2016). To control the ROS most of the oxygen is reduced to water, but incomplete reduction of oxygen leads to generation of O2−, H2O2 and hydroxyl radical. The findings of this experiment suggest that compound 1 significantly affect the ROS production.
Usually the chemical compounds have the role in either potentiation or suppression of the enzymatic activity. Here in this study Compound 1 was found to be the most active compound enhancing the activity of SOD. The reported level of SOD enzyme activity in the compounds might be a defensive response, which could imitate a lower O2– production or a higher ability for the abolition of O2–. The variations in the SOD activity in these compounds were too prominent. Therefore, it can be concluded that its presence in all samples suggests that this enzyme may have participated in safeguarding the cells from free superoxide radicals. As far as the anti-oxidant potential is concerned the FRAP methods reveals that the compounds 1, 2, 7 are most active and exhibited concentration dependent activity but possess lesser reduction power than radical inhibition. DPPH free radical inhibition activity maximally enhanced by compound 1 followed by 2 and 7 and comparable to the standard i.e. ascorbic acid.
5 Conclusion
Extraction and isolation of compounds from the plant were performed through chromatography and two novel compounds were evaluated along with five known compounds. All the isolated compounds and extract of ethyl acetate and n-butanol were tested for cytotoxic activity against the growth of HepG2 cancer cells in a dose-dependent and time-dependent manner using an MTT assay to assess cell inhibition. All samples were screened by using an MTT cell viability assay. Compound 1 was the most potent inhibitor of HepG2 cancer cells. It significantly affected the viability of cells till 48 h. The antioxidant activity (DPPH free radical inhibition) of compound and extracts was revealed that the highest inhibition was caused by compound 1 followed by compound 2 and compound 7. The Fe (III) reduction demonstrated that both the treated extracts and compounds had lower reducing ability than the radical inhibiting activity. Compounds 1, 2 and, 7 showed the highest reducing ability estimated by FRAP method. The highest enhancement in SOD activity was reported in compound 1 followed by 2. The over all findings of this study suggest further exploration on both the novel compounds for their biological efficacy or therapeutic advantages.
Acknowledgement
The authors extend their appreciation to Researchers Supporting Project number (RSP-2021/119), King Saud University, Riyadh, Saudi Arabia for supporting and funding this work.
Conflicts of interest
The authors declare no conflicts of interest with respect to research, authorship, and/or publication of this article.
References
- J. Ethnopharmacol.. 2010;128:322-335.
- [CrossRef]
- Methods Enzymol.. 1984;1984(105):121-126.
- [CrossRef]
- Anonymous, 2004. The Ayurvedic Pharmacopoeia of India, Part-I, vol.-IV, Government of India, Ministry of Health and Family Welfare, Department of Health, New Delhi.
- Anal Biochemis.. 1996;239(1):70-76.
- [CrossRef]
- Nature.. 1958;29:1199-1200.
- [CrossRef]
- Fraga, D., et al., 2017. Real‐time PCR: Current protocols essential laboratory techniques, 2008, (1), 10-3. https://doi.org/10.1002/9780470089941.et1003s00
- Antioxidants. 2019;8:542-554.
- [CrossRef]
- Flora of District Garhwal, North Western Himalaya (with ethnobotanical notes). Srinagar, Uttarakhand, India: Transmedia; 1999.
- Cancer Metabol.. 2014;2(Suppl. 1):21.
- [CrossRef]
- Plant Physiol.. 1977;59(2):309-314.
- [CrossRef]
- Nat. Prod. Res.. 2017;31(1):16-21.
- [CrossRef]
- Hawas, U.W. et al., 2018. Nat. Prod. Res., 32, 12.: 1369-74. https://doi.org/10.1080/14786419.2017.1344662
- J Nat Prod.. 1999;62(6):311-312.
- [CrossRef]
- Molecules. 2010;15(9):6244-6256.
- [CrossRef]
- Kathy, et. al., 2016. Circ. Res. 119 (5): doi:e39-e75. 10.1161/RES0000000000000110; PMID: 27418630.
- BMC Complement. Altern. Med.. 2017;17(1):104-115.
- [CrossRef]
- Physiol. Plantarum. 1983;58:166-170.
- [CrossRef]
- Phytomed.. 2019;53:163-170.
- [CrossRef]
- Biomed. Pharmacother.. 2017;89:366-375.
- [CrossRef]
- Nat. Prod. Res.. 2017;33(5):665-672.
- [CrossRef]
- J. Ethnopharmacol.. 2018;229:326-341.
- [CrossRef]
- Cell Prolifera.. 2015;48(4):443-454.
- [CrossRef]
- Indian J. Nat. Prod. Res.. 2011;2(3):275-285.
Appendix A
Supplementary data
Supplementary data to this article can be found online at https://doi.org/10.1016/j.jksus.2021.101792.
Appendix A
Supplementary data
The following are the Supplementary data to this article:


