

Translate this page into:
Morphological and biochemical variations caused by salinity stress in some varieties of Pennisetum glaucum L.
⁎Corresponding authors. sibgha.noreen@bzu.edu.pk (Sibgha Noreen), kausar.shah@bzu.edu.pk (Kausar Hussain Shah)
-
Received: ,
Accepted: ,
This article was originally published by Elsevier and was migrated to Scientific Scholar after the change of Publisher.
Abstract
The salinity of the soil is a severe challenge to the sustainability of agricultural production. It causes significant loss in the productivity of crop plants. To overcome this problem, one of the possible solutions could be the identification and cultivation of salinity tolerant crop plants in salt affected land. Therefore, this study was designed to screen some varieties of Pearl Millet (Pennisetum glaucum L. Family Poaceae), an equally important cereal crop for food and forage, for salinity tolerance in a pot experiment. Some eighteen varieties of Pearl Millet were utilized to investigate the morphometric and biochemical variations induced by saline stress. The plants were grown for three weeks under normal conditions in sand culture in disposable PVP cups with three inches diameter. Afterwards, the plants were challenged with salinity stress (aqueous solution of NaCl applied in successive steps of 50, 100, 150 and 200 mM with Hoagland’s nutrients). The plants adopted salinity stress after one week and harvested for various physio-biochemical attributes. The results showed that the varieties YBS-93, YBS-94, YBS-95 and YDR-8-1 exhibited tolerance toward salinity stress as their shoot length, root length, biomass production and K+ was maintained under salt stress. The levels of proline contents and free amino acids in their leaves were relatively higher under salt stress as compared with other varieties. The accumulation of Na+ in theses varieties was lower as compared to other varieties under saline stress. These findings indicated their potential strategy to cope with salinity stress. While theYBS-83, YBS-98, YCMP-19 and YCMP-34 varieties among the subjected eighteen varieties of Pearl Millet were screened as most sensitive varieties to salinity stress in these experimental conditions. Because these varieties had reduction in shoot length, root length biomass production and K+. Other varieties did not show any significant success in salinity stress management. This study has provided significant preliminary screening data of morphological and biochemical aspects of eighteen varieties of Pearl Millet for their capability of salinity tolerance. Further molecular investigations are underway which will be helpful in revealing insights of the salt tolerance mechanism and signaling pathways in the screened salt tolerant varieties.
Keywords
Abiotic stress
Pearl millet
Pennisetum glaucum
Proline
Salinity tolerance

1 Introduction
Salinity, drought, heavy metals, flooding and extremely high/low temperatures are examples of plants abiotic stresses. All these stresses negatively affect the plant growth, development and yield attributes. Among these stresses, salinity is the most significant environmental stress that limits the plant productivity by affecting morphology, physiology, and biochemical profile of plants especially in semi-arid and arid regions (Alam et al., 2021). It is reported that one billion hectares area is salt affected in the world (Ivushkin et al., 2019). While, Pakistan has 6.28 mha salt affected area (Malik et al., 2021).
Salinity stress causes reduction in leaf area, chlorophyll contents, transpiration rate, water uptake and photosystem II efficiency (Netondo et al., 2004; Ahanger et al., 2020). The sodium and chloride ions accumulation reduce potassium ions and nutrients uptake (Ulfat et al., 2020). The high level of Na+ and Cl- caused the ionic imbalance and osmotic stress that cause the negative effect on plant morphology, biomass production and biochemical profile. Different plants have adaptive mechanism to overcome the salt stress by acquisition Na+ ions in vacuole through osmotic adjustment (Rahneshan et al., 2018).
When plants are exposed to salt, they produce reactive oxygen species (ROS) especially in mitochondria and chloroplasts (Ahmad et al., 2019; Kohli et al., 2019; Mansoor et al., 2022). ROS is extremely harmful and causes cell damage. It causes lipid peroxidation, protein oxidation, and nucleic acid destruction (Kohli et al., 2019).
Pennisetum glaucum L. (Pearl millet) belongs to family Poaceae and Panicoideae subfamily. It is sixth important annual cereal crop (Andrews and Kumar, 1992). According to International Crops Research Institute for the Semi-arid Tropics (ICRISAT), 31 million hectares are utilized for pearl millet cultivation worldwide. 90 million people depends upon the pearl millet for food and income (ICRISAT, 2021). For the livestock and humans, it is inexpensive source of energy (Chanwala et al., 2020). As a result, it is an essential crop to research for its tolerance to various abiotic challenges, particularly salt stress.
2 Materials and methods
The experiment was carried out at Botanic Garden, Bahauddin Zakariya University Multan, Pakistan. The seeds of eighteen pearl millet varieties i.e., YBS-10, YBS-13, YBS-17, YBS-18, YBS-83, YBS-92, YBS-93, YBS-94, YBS-95, YBS-98, YCMP-7, YCMP-16, YCMP-19, YCMP-33, YCMP-34, YDR-8-1,14RBS-01 and 14RBS-05 were obtained from Maize and Millet Research Institute (MMRI), Yousaf Wala, Sahiwal, Pakistan. The trial was carried out in complete randomized block design (CRBD) and three replicates of each variety. The plants were grown in disposable PVP cups having diameter of three inch filled with sand. For three weeks, the plants were cultivated in sand under normal conditions using Hoagland's nutrient solution (half strength). The plants were subjected to salinity stress after three weeks of growth, which was achieved by mixing 200 mM NaCl with Hoagland's nutrients solution. The control plants were irrigated with Hoagland's nutrients solution, which did not include NaCl. The plants were taken after one week of salinity exposure for morphometric and biochemical analysis.
Harvested plants were split into shoots and roots. The shoot and root lengths were measured in centimetres per plant using a standard measuring tape. Using a digital scientific scale, the fresh weight of the shoot and root were measured individually in g per plant. To measure dry weight in g per plant, the shoot and root samples were stored in an oven at 80 °C for one week.
The Bradford's method was used to quantify total soluble proteins (Bradford, 1976). The total free amino acids (TFAAs) were determined using the Hamilton and Slyke (1943) method. Proline was assessed by the method of Bates et al. (1973). The ions analysis was done by following Munns et al. (2010).
The hydrogen peroxide (H2O2) was assessed by the method of Velikova et al. (2000). Malondialdehyde (MDA) was measured by using the method of Heath and Packer (1968). Catalase and peroxidase were determined by following Chance and Maehly (1955). APX was measured by using the method of Nakano and Asada (1981).
The data were tabulated and the mean, standard deviation and standard error were calculated by using MS-Excel 2016. Two-way analysis of variance (ANOVA) was done by using software Statistix 8.1.
3 Results
3.1 Shoot and root lengths
Salinity stress significantly (P ≤ 0.005) decreased (7 %-63 %) shoot length of all P. glaucum L. varieties. The YBS-98, YCMP-19, YCMP-33, and YCMP-34 exhibited highest reduction (60 %, 63 %, 61 % and 59 % respectively) in shoot length under salt conditions. Under saline stress, YBS-93, YBS-94 and YDR-8-1 varieties exhibited lowest reduction (7.8 %, 21 % and 14 % respectively) in shoot length in comparison to control (Table 1). Under salinity stress, root length was considerably (P ≤ 0.005) decreased in all P. glaucum L. varieties, with the exception of YBS-93 and YDR-8-1, which exhibited a considerable (P ≤ 0.005) increase in root length (13 % and 16 % respectively) under saline stress. The varieties YBS-94 and YBS-95 showed lowest decrease (8 % and 6 %) in root length under salt stress (Table 1). Each value represents the mean ± SE of multiple treatments with n replicates (n = 3). *, **, *** denote significance at the 0.05, 0.01, and 0.001 percent probability levels, respectively.
Varieties
Shoot length (cm plant−1)
Root length (cm plant−1)
Shoot fresh weight (g plant−1)
Shoot dry weight (g plant−1)
Root fresh weight (g plant−1)
Root dry wight (g plant−1)
Control
Saline
Control
Saline
Control
Saline
Control
Saline
Control
Saline
Control
Saline
YBS-10
23.88 ± 1.5
14.16 ± 0.72
28 ± 1.73
23 ± 0.66
0.73 ± 0.03
0.24 ± 0.0057
0.53 ± 0.02
0.17 ± 0.004
0.33 ± 0.0003
0.22 ± 0.01
0.24 ± 0.0002
0.16 ± 0.007
YBS-13
35.16 ± 3.4
22.83 ± 0.833
20.33 ± 0.33
18 ± 1.15
1.14 ± 0.002
0.51 ± 0.03
0.83 ± 0.0016
0.37 ± 0.02
0.43 ± 0.01
0.12 ± 0.01
0.32 ± 0.01
0.09 ± 0.01
YBS-17
48 ± 0.577
21.33 ± 2.8
22.66 ± 2.3
19 ± 0.57
1.32 ± 0.11
0.15 ± 0.01
0.96 ± 0.08
0.10 ± 0.008
0.73 ± 0.05
0.05 ± 5.7E
0.54 ± 0.04
0.03 ± 0.003
YBS-18
25.16 ± 0.7
10.5 ± 0.76
35 ± 0.88
23.66 ± 0.88
0.62 ± 0.03
0.04 ± 0.00012
0.45 ± 0.02
0.03 ± 8.7E
0.04 ± 4.9E
0.03 ± 0.0011
0.034 ± 0.0011
0.02 ± 0.0008
YBS-83
24.66 ± 0.7
17 ± 3.02
26 ± 1.2
19.66 ± 1.4
1.94 ± 0.02
0.35 ± 0.0033
1.45 ± 0.01
0.26 ± 0.005
0.50 ± 0.005
0.13 ± 0.005
0.37 ± 9.8E
0.10 ± 9.81E
YBS-92
35.66 ± 0.5
23.5 ± 1.15
28.33 ± 0.33
18.33 ± 0.57
1.13 ± 0.03
0.18 ± 0.0018
0.85 ± 0.02
0.13 ± 0.002
0.27 ± 0.045
0.04 ± 0.004
0.19 ± 0.002
0.03 ± 0.00003
YBS-93
29.66 ± 3.1
27.3 ± 1.322
17.33 ± 0.33
19.66 ± 0.33
0.56 ± 0.09
0.44 ± 0.01
0.42 ± 0.06
0.33 ± 0.01
0.078 ± 0.03
0.072 ± 0.007
0.05 ± 0.004
0.05 ± 0.005
YBS-94
33.33 ± 1.15
26.33 ± 2
24 ± 0.33
22 ± 1.4
0.93 ± 0.033
0.39 ± 0.01
0.36 ± 0.02
0.28 ± 0.01
0.33 ± 0.05
0.3 ± 0.004
0.24 ± 0.001
0.21 ± 0.002
YBS-95
26 ± 0.16
18 ± 2
19.33 ± 0.33
18 ± 0.33
0.75 ± 0.13
0.65 ± 0.01
0.56 ± 0.09
0.49 ± 0.01
0.27 ± 0.02
0.05 ± 0.0013
0.20 ± 0.003
0.03 ± 0.00098
YBS-98
27.33 ± 0.2
10.8 ± 0.33
37.66 ± 1.2
18.33 ± 2.4
1.79 ± 0.02
0.48 ± 0.02
1.34 ± 0.02
0.36 ± 0.01
0.61 ± 0.007
0.05 ± 0.001
0.44 ± 0.0054
0.04 ± 0.007
YCMP-7
21.33 ± 0.66
15 ± 1.73
24.66 ± 0.88
18 ± 0.5
0.68 ± 0.05
0.17 ± 0.01
0.53 ± 0.005
0.12 ± 0.005
0.11 ± 0.0049
0.16 ± 0.004
0.08 ± 0.0035
0.11 ± 0.001
YCMP-16
25.33 ± 0.16
19.33 ± 0.66
36 ± 0.88
21 ± 0.57
1.19 ± 0.01
0.76 ± 0.05
0.89 ± 0.009
0.57 ± 0.04
0.57 ± 0.04
0.1 ± 9.8E
0.41 ± 0.029
0.07 ± 0.01
YCMP-19
23 ± 1.36
8.33 ± 0.92
25.66 ± 0.57
14.3 ± 0.57
1.50 ± 0.006
0.050 ± 0.002
1.13 ± 0.004
0.037 ± 0.004
0.44 ± 0.0013
0.0270.0282
0.31 ± 0.02
0.019 ± 0.02
YCMP-33
26.33 ± 0.76
10.16 ± 1.16
23.33 ± 0.57
13.66 ± 0.33
0.45 ± 0.01
0.12 ± 0.0009
0.33 ± 0.01
0.09 ± 0.0012
0.56 ± 0.03
0.20 ± 0.007
0.39 ± 0.002
0.14 ± 0.005
YCMP-34
35 ± 1.15
14.3 ± 0.44
29.66 ± 0.57
16 ± 0.5
1.94 ± 0.01
0.082 ± 0.01
1.45 ± 0.01
0.061 ± 0.09
0.42 ± 3.9E
0.021 ± 0.008
0.30 ± 0.0011
0.015 ± 0.006
14RBS-01
30 ± 1.15
16.66 ± 0.33
24.33 ± 1.76
14.66 ± 0.88
0.64 ± 0.05
0.42 ± 0.05
0.48 ± 0.03
0.31 ± 0.04
0.53 ± 0.04
0.19 ± 0.01
0.38 ± 0.0035
0.14 ± 0.008
14RBS-05
30.33 ± 0.57
20 ± 3.2
27.33 ± 2.08
19.33 ± 0.66
1.13 ± 0.09
0.25 ± 0.04
0.85 ± 0.07
0.19 ± 0.03
0.45 ± 0.02
0.07 ± 0.003
0.32 ± 0.0014
0.05 ± 0.0025
YDR-8-1
21.66 ± 1.76
18.5 ± 1.3
16 ± 0.33
18.66 ± 1.7
0.22 ± 0.01
0.20 ± 0.02
0.16 ± 0.01
0.15 ± 0.01
0.33 ± 0.03
0.41 ± 0.01
0.23 ± 0.0027
0.29 ± 0.0085
ANOVA
SOV
DF
R
2
6.33
1.231
0.0006
0.00199
0.00138
0.00103
V
17
124.33***
96.481***
0.6003***
0.3401***
0.07072***
0.03312***
T
1
1606.22***
936.33***
12.4690***
6.7487***
1.62978***
0.78539***
V*T
17
66.03**
39.275***
0.3039***
0.16945***
0.07413***
0.02503***
E
70
26.13
2.698
0.0041
0.00429
0.00345
0.00091
3.2 Plant biomass production
The biomass of shoot was significantly (P ≤ 0.005) declined (7 %-96 %) in all P. glaucum L. varieties under salt stress. The highest decrease was noted in YBS-98 (95 %), YCMP-19 (96 %) and YCMP-34 (95 %) varieties. While the varieties YDR-8-1, YBS-93 and YBS-94 exhibited lowest reduction (22 %, 21 % and 7.5 % respectively) in shoot biomass (Table 1). The biomass of root was significantly (P ≤ 0.005) decreased in all varieties under salt stress with the exception of varieties YCMP-7 and YDR-8-1 which showed increased (36 % and 24.8 % respectively) fresh and dry weight of root under salt stress (Table 1).
3.3 Sodium and potassium ions
The sodium ions (Na+) accumulation in the leaf and root increased significantly (5.9 % to 89 % in the leaf and 15 % to 45 % in the root) across all varieties of pearl millet due to salt stress. Under saline conditions, the YBS-93, YBS-94, YBS-95, and YDR-8-1 varieties exhibited the lowest levels of leaf Na+. Similarly, in the root, the YBS-93, YBS-94, and YDR-8-1 varieties showed comparatively lower increases (22 %, 18 %, and 15 % respectively) in Na+ due to salt stress. The root Na+ content was highest in the YBS-83, YCMP-16, and YCMP-33 varieties (40.6 %, 40.3 %, and 45.6 % respectively) as a consequence of saline stress (Table 2). Each value represents the mean ± SE of multiple treatments with n replicates (n = 3). *, **, *** denote significance at the 0.05, 0.01, and 0.001 percent probability levels, respectively.
Varieties
Leaf Na+ (mg/g dry wt.)
Leaf K+ (mg/g dry wt.)
Root Na+ (mg/g dry wt.)
Root K+ (mg/g dry wt.)
Leaf K+/Na+ (mg/g dry wt.)
Root K+/Na+ (mg/g dry wt.)
Control
Saline
Control
Saline
Control
Saline
Control
Saline
Control
Saline
Control
Saline
YBS-10
9.08 ± 0.03
13 ± 0.6
12.27 ± 0.14
8.37 ± 0.09
10.67 ± 0.33
14 ± 0.58
13.17 ± 0.08
10.3 ± 0.05
1.35 ± 0.02
0.64 ± 0.008
1.24 ± 0.03
0.74 ± 0.03
YBS-13
8.73 ± 0.12
11.33 ± 0.33
10.83 ± 0.32
7.47 ± 0.19
11.67 ± 0.33
15 ± 0.58
13.43 ± 0.57
9.4 ± 0.06
1.24 ± 0.04
0.66 ± 0.01
1.15 ± 0.02
0.63 ± 0.02
YBS-17
7.74 ± 0.07
10.9 ± 0.5
8.37 ± 0.08
5.37 ± 0.04
9.43 ± 0.32
12.23 ± 0.12
12.27 ± 0.08
9.53 ± 0.17
1.08 ± 0.01
0.49 ± 0.001
1.30 ± 0.1
0.78 ± 0.01
YBS-18
7.33 ± 0.08
10.9 ± 0.05
11.19 ± 0.1
6.7 ± 0.7
11.07 ± 0.52
14.27 ± 0.14
11.77 ± 0.33
8.92 ± 0.1
1.53 ± 0.007
0.61 ± 0.006
1.07 ± 0.05
0.63 ± 0.005
YBS-83
9.33 ± 0.17
11.63 ± 0.3
9.62 ± 0.07
5.4 ± 0.06
10.67 ± 0.33
15 ± 0.58
12.27 ± 0.9
8.92 ± 0.1
1.03 ± 0.02
0.46 ± 0.01
1.16 ± 0.02
0.59 ± 0.02
YBS-92
10.7 ± 0.3
10.9 ± 0.33
9.13 ± 0.18
5.4 ± 0.07
11.66 ± 0.33
14.33 ± 0.33
14.44 ± 0.067
10.33 ± 0.26
1.04 ± 0.02
0.49 ± 0.01
1.21 ± 0.04
0.72 ± 0.04
YBS-93
8.73 ± 0.1
11.66 ± 0.05
10.3 ± 0.08
8.14 ± 0.06
11.8 ± 0.33
14.41 ± 0.33
15.99 ± 0.01
14 ± 0.33
0.97 ± 0.02
0.69 ± 0.0019
1.35 ± 0.04
0.97 ± 0.003
YBS-94
8.85 ± 0.2
10.33 ± 0.33
11.15 ± 0.18
9.62 ± 0.03
10.57 ± 0.41
12.51 ± 0.05
14.3 ± 0.003
12.7 ± 0.15
1.25 ± 0.02
0.93 ± 0.01
1.35 ± 0.02
1.01 ± 0.0014
YBS-95
10.6 ± 0.04
11.33 ± 0.33
10.3 ± 0.1
8.65 ± 0.04
10.66 ± 0.23
13.33 ± 0.03
15.13 ± 0.03
13.46 ± 0.15
0.96 ± 0.002
0.67 ± 0.02
1.42 ± 0.01
1.01 ± 0.01
YBS-98
7.74 ± 0.07
14.68 ± 0.14
8.67 ± 0.06
4.39 ± 0.1
12 ± 1.154
16.4 ± 0.2
13.77 ± 0.39
6.53 ± 0.9
1.12 ± 0.005
0.29 ± 0.01
1.15 ± 0.03
0.39 ± 0.005
YCMP-7
10.17 ± 0.4
13 ± 0.05
8.54 ± 0.01
5.1 ± 0.06
11.34 ± 0.0033
14.33 ± 0.08
11.77 ± 0.33
7.77 ± 0.09
0.84 ± 0.03
0.39 ± 0.002
1.04 ± 0.02
0.54 ± 0.003
YCMP-16
11 ± 0.5
14.67 ± 0.33
10.1 ± 0.05
6.85 ± 0.14
10.17 ± 0.03
14.27 ± 0.14
12.27 ± 0.89
9.4 ± 0.06
0.92 ± 0.04
0.47 ± 0.02
1.21 ± 0.005
0.65 ± 0.005
YCMP-19
8.44 ± 0.33
15.30 ± 0.16
9.38 ± 0.03
5.37 ± 0.04
11.21 ± 0.003
14.79 ± 0.005
14.15 ± 0.07
7.77 ± 0.09
1.11 ± 0.05
0.35 ± 0.002
1.26 ± 0.007
0.52 ± 0.005
YCMP-33
9.1 ± 0.05
13.03 ± 0.03
10.1 ± 0.05
5.4 ± 0.05
8.4 ± 0.05
12.23 ± 0.12
14.14 ± 0.1
9.82 ± 0.03
1.11 ± 0.00006
0.41 ± 0.0045
1.68 ± 0.01
0.80 ± 0.01
YCMP-34
6.71 ± 0.07
12.39 ± 0.04
11.19 ± 0.1
6.7 ± 0.07
10.95 ± 0.02
13.99 ± 0.005
14.92 ± 0.2
9.82 ± 0.04
1.67 ± 0.02
0.54 ± 0.006
1.36 ± 0.002
0.70 ± 0.002
14RBS-01
7.33 ± 0.08
10.33 ± 0.33
10.83 ± 0.3
6.7 ± 0.07
7.47 ± 0.33
9.99 ± 0.005
14.14 ± 0.01
11.77 ± 0.33
1.47 ± 0.04
0.64 ± 0.0018
1.89 ± 0.03
1.17 ± 0.03
14RBS-05
7.33 ± 0.08
10.7 ± 0.35
12.27 ± 0.14
8.4 ± 0.09
9.99 ± 0.005
12.23 ± 0.12
10.3 ± 0.05
7.7 ± 0.06
1.67 ± 0.006
0.78 ± 0.01
1.03 ± 0.01
0.62 ± 0.01
YDR-8-1
11.27 ± 0.15
12.2 ± 0.07
9.62 ± 0.07
8.66 ± 0.07
13.33 ± 0.33
15.45 ± 0.11
13.37 ± 0.3
12.17 ± 0.16
0.85 ± 0.007
0.71 ± 0.0019
1 ± 0.01
0.78 ± 0.01
ANOVA
SOV
DF
R
2
0.221
0.116
0.329
0.597
0.00087
0.00359
V
17
7.932***
9.401***
11.408***
15.124***
0.18495***
0.23321***
T
1
281.562***
312.236***
258.819***
309.392***
9.87139***
7.64249***
V*T
17
4.993***
1.875***
0.808***
3.929***
0.10598***
0.04111***
E
70
0.157
0.041
0.212
0.095
0.00149
0.00242
The reduction of Potassium ions (K+) in both leaf and root was observed significantly in all varieties of pearl millet under salt stress. In the case of leaf K + reduction, the varieties YBS-93, YBS-94, YBS-95, and YDR-8-1 experienced the lowest decrease. However, in the case of root K + reduction, the varieties YBS-93, YBS-94, YBS-95, and YDR-8-1 experienced a lesser reduction (12 %, 11.2 %, 11 %, and 8.7 % respectively) under salt stress. The highest decrease in root K+ percentage was observed in varieties YBS-98, YCMP-19, and YCMP-34 (52 %, 45 %, and 34 % respectively). Similarly, under salt stress, the ratio of potassium to sodium ions was reduced in both leaf and root of all varieties of pearl millet (Table 2).
3.4 Pigments
Salinity stress caused the significant (P ≤ 0.005) reduction (3–92 %) in chlorophyll a contents in all P. glaucum L. varieties. The decrease level of chlorophyll a was lowered in YBS-93, YBS-94 and YDR-8-1 varieties (3.4 %, 6 % and 7 % respectively) under salt stress. While the varieties YBS-95, YCMP-7, YCMP-19 and 14RBS-05 exhibited highest reduction in chlorophyll a contents (92 %, 89 %, 92 % and 88 % respectively) (Table 3). Similar to chlorophyll a, the chlorophyll b was also decreased in some pearl millet varieties. However, the varieties YBS-10, YBS-95 and 14RBS-05 (86 %, 113 % and 27 % respectively) had improved level of chlorophyll b contents under salt stress. Salinity stress also disturbs the chlorophyll a/b in some varieties as presented in Table 3. The total chlorophyll contents were decreased (4.4–79 %) in pearl millet varieties under salinity stress except the varietyYBS-10 (15 % increase). Salinity significantly reduced the carotenoids contents in some varieties while the varieties YBS-10, YBS-95, YCMP-7, YCMP-16 and 14RBS-01 had increased (16 %, 42.7 %, 42 %, 1.3 % and 21 % respectively) level of carotenoids contents. Salinity stress reduced the quantum yield significantly (P ≤ 0.005) in all varieties with the exception of varieties YBS-18 and YBS-98 (Table 3). Each value represents the mean ± SE of multiple treatments with n replicates (n = 3). *, **, *** denote significance at the 0.05, 0.01, and 0.001 percent probability levels, respectively.
Varieties
Chlorophyll a (mg g-1F. wt.)
Chlorophyll b (mg g-1F. wt.)
Chlorophyll a/b (mg g-1F. wt.)
Total chlorophyll (mg g-1F. wt.)
Carotenoid (mg g-1F. wt.)
Quantum yield
Control
Saline
Control
Saline
Control
Saline
Control
Saline
Control
Saline
Control
Saline
YBS-10
0.69 ± 0.055
0.58 ± 0.022
0.31 ± 0.02
0.57 ± 0.07
2.25 ± 0.048
1.04 ± 0.088
0.99 ± 0.08
0.57 ± 0.0
0.07 ± 0.001
0.091 ± 0.006
0.69 ± 0.04
0.47 ± o.005
YBS-13
0.82 ± 0.058
0.55 ± 0.005
0.35 ± 0.03
0.28 ± 0.005
2.40 ± 0.109
1.92 ± 0.02
1.16 ± 0.09
0.28 ± 0.005
0.08 ± 0.006
0.063 ± 0.006
0.54 ± 0.05
0.59 ± 0.008
YBS-17
0.81 ± 0.005
0.58 ± 0.016
0.53 ± 0.02
0.31 ± 0.04
1.53 ± 0.063
1.95 ± 0.29
1.34 ± 0.02
0.31 ± 0.04
0.11 ± 0.005
0.030 ± 0.009
0.64 ± 0.02
0.46 ± 0.14
YBS-18
0.79 ± 0.072
0.50 ± 0.088
0.42 ± 0.04
0.31 ± 0.01
1.93 ± 0.08
1.61 ± 0.36
1.21 ± 0.11
0.31 ± 0.01
0.096 ± 0.005
0.070 ± 0.002
0.65 ± 0.02
0.11 ± 0.005
YBS-83
0.98 ± 0.005
0.14 ± 0.005
0.75 ± 0.005
0.48 ± 3.93E
1.29 ± 0.002
0.30 ± 0.011
1.73 ± 0.011
0.48 ± 3.93E
0.11 ± 0.009
0.071 ± 0.014
0.6 ± 0.01
0.57 ± 0.027
YBS-92
0.83 ± 0.022
0.72 ± 0.03
0.46 ± 0.05
0.31 ± 0.032
1.87 ± 0.2
2.40 ± 0.39
1.28 ± 0.05
0.31 ± 0.0325
0.1 ± 0.006
0.064 ± 0.005
0.55 ± 0.01
0.60 ± 0.038
YBS-93
0.9 ± 0.07
0.87 ± 0.06
0.80 ± 0.04
0.75 ± 0.01
1.12 ± 0.055
1.15 ± 0.09
1.70 ± 0.11
0.75 ± 0.015
0.12 ± 0.005
0.079 ± 0.009
0.69 ± 0.005
0.65 ± 0.025
YBS-94
0.73 ± 0.022
0.68 ± 0.006
0.40 ± 0.005
0.38 ± 0.02
1.82 ± 0.08
1.78 ± 0.13
1.13 ± 0.01
0.38 ± 0.025
0.09 ± 0.001
0.058 ± 0.008
0.64 ± 0.029
0.62 ± 0.01
YBS-95
0.89 ± 0.011
0.06 ± 0.001
0.29 ± 0.09
0.61 ± 0.056
3.77 ± 0.9
0.10 ± 0.01
1.18 ± 0.08
0.60 ± 0.056
0.07 ± 0.016
0.107 ± 0.006
0.68 ± 0.02
0.64 ± 0.015
YBS-98
0.98 ± 0.01
0.29 ± 0.01
0.43 ± 0.003
0.16 ± 0.003
2.25 ± 0.034
1.76 ± 0.1
1.41 ± 0.14
0.16 ± 0.0037
0.09 ± 0.01
0.061 ± 0.009
0.70 ± 0.033
0.69 ± 0.02
YCMP-7
0.73 ± 0.005
0.08 ± 0.006
0.42 ± 0.003
0.21 ± 0.007
1.71 ± 0.007
0.36 ± 0.01
1.16 ± 0.009
0.21 ± 0.007
0.07 ± 0.009
0.103 ± 0.01
0.61 ± 0.02
0.27 ± 0.01
YCMP-16
0.96 ± 0.033
0.75 ± 0.005
0.57 ± 0.01
0.14 ± 0.012
1.67 ± 0.11
5.21 ± 0.5
1.54 ± 0.01
0.14 ± 0.01
0.10 ± 0.008
0.104 ± 0.01
0.65 ± 0.01
0.41 ± 0.045
YCMP-19
0.85 ± 0.022
0.06 ± 0.0008
0.49 ± 0.01
0.26 ± 0.01
1.73 ± 0.1
0.25 ± 0.018
1.35 ± 0.005
0.26 ± 0.014
0.09 ± 0.001
0.079 ± 0.0002
0.6 ± 0.02
0.25 ± 0.05
YCMP-33
0.77 ± 0.067
0.20 ± 0.0057
0.32 ± 0.04
0.12 ± 0.005
2.54 ± 0.51
1.66 ± 0.046
1.09 ± 0.036
0.12 ± 0.005
0.07 ± 0.008
0.044 ± 0.01
0.64 ± 0.003
0.28 ± 0.01
YCMP-34
0.9 ± 0.005
0.13 ± 0.005
0.64 ± 0.005
0.18 ± 0.005
1.39 ± 0.003
0.74 ± 0.03
1.54 ± 0.011
0.18 ± 0.005
0.11 ± 0.004
0.061 ± 0.006
0.54 ± 0.05
0.39 ± 0.088
14RBS-01
0.52 ± 0.02
0.14 ± 0.028
0.57 ± 0.005
0.15 ± 0.031
0.91 ± 0.03
1.09 ± 0.49
1.09 ± 0.018
0.15 ± 0.03
0.05 ± 0.01
0.069 ± 0.009
0.61 ± 0.03
0.47 ± 0.05
14RBS-05
1.02 ± 0.002
0.11 ± 0.005
0.52 ± 0.02
0.66 ± 0.005
1.95 ± 0.088
0.17 ± 0.008
1.54 ± 0.02
0.66 ± 0.005
0.11 ± 0.0008
0.090 ± 0.003
0.56 ± 0.01
0.37 ± 0.1
YDR-8-1
0.84 ± 0.003
0.77 ± 0.012
0.47 ± 0.006
0.44 ± 0.004
1.75 ± 0.018
1.75 ± 0.01
1.31 ± 0.01
0.44 ± 0.004
0.11 ± 0.002
0.056 ± 0.009
0.64 ± 0.01
0.4 ± 0.066
ANOVA
SOV
DF
R
2
0.00001
0.00001
0.0513
0.00003
0.0807
0.00019
V
17
0.00106***
0.00084***
11.3416***
0.00129***
0.7473***
0.01088***
T
1
0.01835***
0.00238***
7.1663***
0.03393***
15.0035***
0.01329***
V*T
17
0.00098***
0.00025***
12.1770***
0.00117**
0.9334***
0.01409***
E
70
0.00003
0.0001
0.5423
0.00006
0.918
0.00069
3.5 Total free amino acids (TFAAs)
The leaf total free amino acids (TFAAs) were significantly reduced (P ≤ 0.005) in YBS-13, YBS-17, YBS-95, YBS-98, YCMP-16, YCMP-19 and 14RBS-01 (3–88 %) under salt stress. The varieties YBS-10, YBS-18, YBS-83, YBS-92, YBS-93, YBS-94, YCMP-33, 14RBS-05 and YDR-8-1 showed significantly (P ≤ 0.005) increased level of leaf TFAAs under salt stress (Fig. 1A). Root TFAAs of varieties YBS-92, YBS-93, YBS-95, YBS-98, YCMP-16, YCMP-34, 14RBS-01 and YDR-8-1 was significantly increased (P ≤ 0.005) under salt stress condition when compared to control. While the other varieties exhibited decreased level (1.1 % to 23 %) of root TFAAs under salt stress. The varieties YBS-92, YBS-93 and YBS-95 exhibited highest level of increase (68 %, 45 % and 58 % respectively) in root TFAAs under salt stress (Fig. 2B).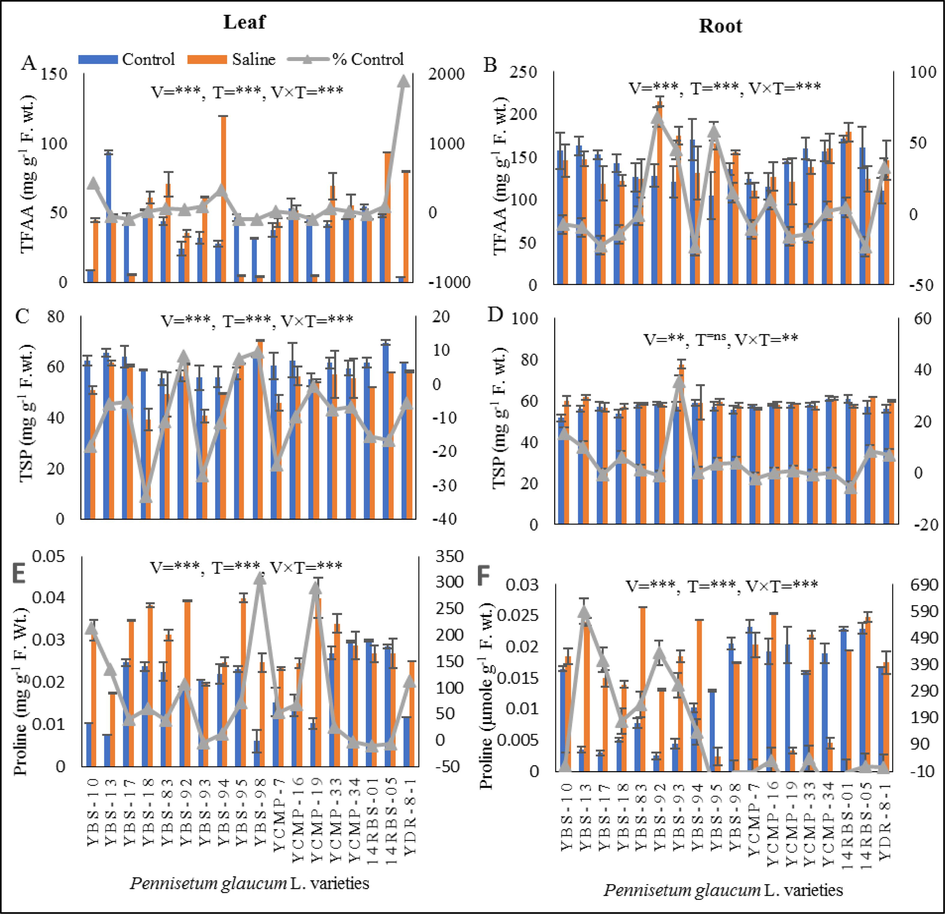
(A) leaf total free amino acids (mg g-1F. wt.), (B) root total free amino acids (mg g-1F. wt.), (C) leaf total soluble proteins (mg g-1F. wt.), (D) root total soluble proteins (mg g-1F. wt.), (E) leaf proline (mg g-1F. wt.) and (F) root proline (mg g-1F. wt.) of eighteen pearl millet varieties grown under control and saline conditions.
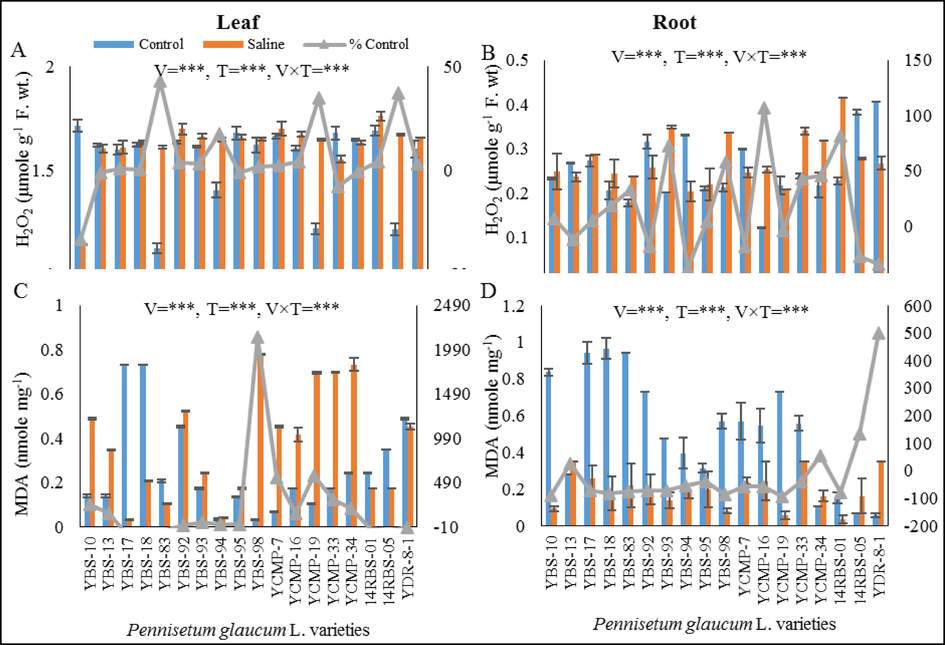
(A) leaf hydrogen peroxide (µmole g-1F. wt.), (B) root hydrogen peroxide (µmole g-1F. wt.), (C) leaf MDA (µmole mg−1) and (D) root MDA (µmole mg−1) of eighteen pearl millet varieties grown under control and saline conditions.
3.6 Total soluble proteins (TSPs)
The varieties YBS-92, YBS-95 and YBS-98 exhibited increase level (8 %, 7 % and 9 %) of leaf total soluble proteins (TSPs). While the other varieties had decreased level of leaf TSPs (08–33 %) under salt stress. The varieties YBS-18 and YBS-93 exhibited highest decreased (33 and 27 %) in leaf TSPs under saline stress (Fig. 1C) Under salinity stress, the varieties YBS-10, YBS-13, YBS-18, YBS-83, YBS-93, YBS-95, YBS-98, YCMP-19, 14RBS-05 and YDR-8-1 had increased level ranging from 0.6 % to 35 % of root TSPs in comparison to control. While the other varieties had decreased level (0.02–5.5 %) of root TSPs under salt stress. The varieties YBS-10, YBS-13, YBS-93 and YDR-8-1 showed highest increase (15 %, 9.9 %, 35 % and 6.9 % respectively) in root TSPs under salinity stress (Fig. 1D).
3.7 Proline
Leaf proline level was significantly increased (P ≤ 0.005) in all pearl millet varieties under saline stress when compared to control conditions with the exception of YBS-93, YCMP-34, 14RBS-01 and 14RBS-05 varieties (Fig. 1E). The root proline contents were significantly reduced (P ≤ 0.005) in YBS-95, YBS-98, YCMP-7, YCMP-19, YCMP-34 and 14RBS-01pearl millet varieties under saline stress. While the varieties YBS-10, YBS-13, YBS-17, YBS-18, YBS-83, YBS-92, YBS-93, YBS-94, YCMP-16, YCMP-33, 14RBS-05 and YDR-8-1 exhibited increased level of root proline contents under saline stress (Fig. 1F).
3.8 Hydrogen peroxide (H2O2)
Under salinity stress, the accumulation of leaf hydrogen peroxide (H2O2) was decreased (0.7–33 %) in varieties YBS-10, YBS-13, YBS-95, YCMP-33 and YCMP-34. While the other varieties had increased level (0.4–37 %) of leaf H2O2 under saline stress in evaluation to control condition. The varieties YCMP-19 and 14RBS-05 (35 % and 37 %) showed maximum increased level of H2O2 under salinity stress (Fig. 2A). The level of root H2O2 was significant (P ≤ 0.005) enhanced (3.9–82 %) in YBS-10, YBS-17, YBS-18, YBS-83, YBS-93, YBS-95, YBS-98, YCMP-16, YCMP-33, YCMP-34 and 14RBS-01 varieties under salt stress. The varieties YCMP-16 and 14RBS-01 showed highest increased (106 % and 82 % respectively) in root H2O2 under salt stress (Fig. 2B).
3.9 Malondialdehyde (MDA)
Leaf Malondialdehyde (MDA) was decreased (7–95 %) due salinity stress in varieties YBS-17, YBS-18, YBS-83, 14RBS-01, 14RBS-05 and YDR-8-1. The YBS-98 variety exhibited maximum increased in leaf MDA contents under salt stress (Fig. 2C). The level of root MDA was significantly (P ≤ 0.005) decreased in all varieties ranging from 37 % to 92 % of control under saline stress except the varieties YBS-13, YCMP-34, 14RBS-05 and YDR-8-1 and these varieties exhibited increased level of root MDA under saline condition. The varieties YBS-10, YBS-98 and YCMP-34 disclosed lowest increased (88 %, 85 % and 92 % respectively) in root MDA under salinity stress (Fig. 2D).
3.10 Catalase activity (CAT)
Saline stress significant (P ≤ 0.005) decreased the leaf CAT in YBS-10, YBS-13, YBS-18, YCMP-33, YCMP-34 and 14RBS-01 varieties from 10 to 43 %. While the other varieties exhibited increase level of CAT under salt stress. The varieties YBS-93 and YBS-95 exhibited highest (101 % and 91 % enhance) leaf CAT under salt stress (3A). The varieties YBS-10, YBS-13, YBS-17, YBS-18, YBS-83, YBS-93, YBS-95, YCMP-16, YCMP-34, 14RBS-05 and YDR-8-1 showed significantly (P ≤ 0.005) enhanced level (3–42 %) of root CAT, while other varieties showed decreased level of root CAT under saline stress. The varieties YBS-83, 14RBS-05 and YDR-8-1 showed highest (42.8, 27 and 26 % respectively) root CAT under salinity stress (Fig. 3B).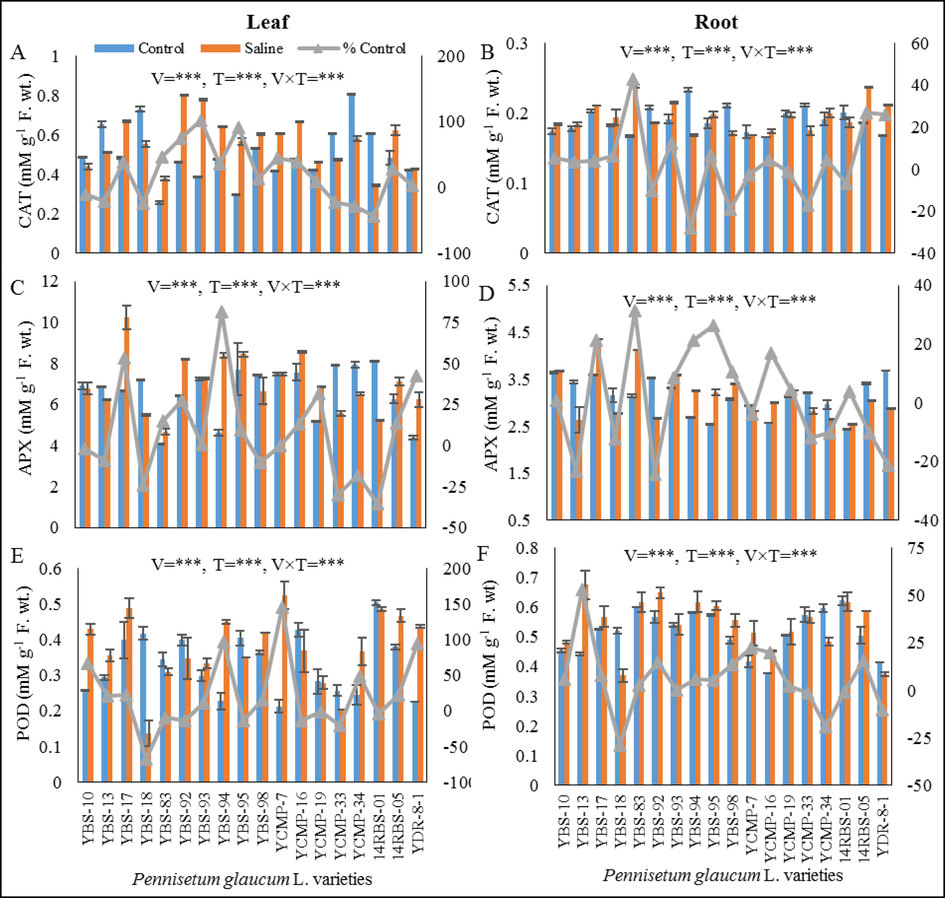
(A) leaf CAT (mM g-1F. wt.), (B) root CAT (mM g-1F. wt.), (C) leaf APX (mM g-1F. wt.), (D) root APX (mM g-1F. wt.), (E) leaf POD (mM g-1F. wt.) and (F) root POD (mM g-1F. wt.) of eighteen pearl millet varieties grown under control and saline conditions.
3.11 Ascorbate peroxidase activity (APX)
The pearl millet varieties YBS-10, YBS-13, YBS-18, YCMP-33, YCMP-34 and 14RBS-01 had decreased from 2 % to 35 % in leaf APX under saline stress. While the other varieties exhibited increase level from 0.26 % to 81 % in leaf APX under saline stress. The varieties YBS-17, YBS-94 and YDR-8-1 displayed highest (53 %, 81 % and 42 % increase respectively) leaf APX under saline stress. However, the varieties YCMP-7 showed equal level of leaf APX in both conditions (Fig. 3C). The root APX activity was significantly (P ≤ 0.005) increased in YBS-10, YBS-17, YBS-83, YBS-93, YBS-94, YBS-95, YBS-98, YCMP-16, YCMP-19, and 14RBS-01 due salinity stress. While the other varieties exhibited decreased level of root APX under salt stress. The varieties YBS-17, YBS-83, YBS-94 and YBS-95 showed highest increased (21.14 %, 31 %, 21.13 % and 26.4 % respectively) level of root APX under salinity stress (Fig. 3D).
3.12 Peroxidase activity (POD)
The activity of leaf peroxidase (POD) was increased in varieties YBS-10, YBS-13, YBS-17, YBS-93, YBS-94, YBS-98, YCMP-7, YCMP-34, 14RBS-05 and YDR-8-1 ranging from 11.43 % to 145 %. While the other varieties exhibited decreased level of leaf POD ranging from 1.4 % to 67 % under saline stress. The varieties YBS-94, YCMP-7 and YDR-8-1 exposed highest (97 %, 145 % and 93 % increase respectively) leaf POD activity under salinity stress (Fig. 3E). The root POD activity was increased in all varieties of pearl millet with the exception of varieties YBS-18, YCMP-33, YCMP-34, 14RBS-01 and YDR-8-1 (28, 1.19, 18, 0.5 and 9 % decreased respectively) under salt stress. The variety YBS-13 was exhibited highest (53 %) root POD under salt stress (Fig. 3F).
4 Discussion
Salinity stress is the most serious abiotic stress to plants. It has a negative impact on crop productivity in arid and semi-arid regions of the world (Ahanger et al., 2020). It alters physiological and biochemical processes in plants, impairing photosynthesis, protein synthesis, and lipid metabolism (Munns and Tester, 2008). In current study, four varieties YBS-93, YBS-94, YBS-95, and YDR-8-1 were classified as salt tolerant depending on morphological and physio-biochemical features, while the remaining four varietiesYBS-83, YBS-98, YCMP-19 and YCMP-34 were characterized as salt sensitive based on the same characteristics. Because it is suspected that such diversity in salt tolerance exists in pearl millet varieties as a result of variability of morphometric and physio-biochemical signatures, variety grouping or testing for salt tolerance could be performed using numerous morphological and physio-biochemical characteristics, as explained previously (Ashraf and Harris, 2004). Based on morphological parameters such as less reduction in shoot length, root length and biomass and physio-biochemical parameters such as increased level of total free amino acids and reduction in Na+ ions have greater contribution for salt tolerance in YBS-93, YBS-94, YBS-95 and YDR-8-1 varieties.
Based on such variations, the salt tolerance pearl millet varieties exhibited less decrease in shoot and root lengths. The reduction in growth (shoot and root lengths) under salt stress could be attributable to a reduction in cell size or an impairment of mitotic activity. The primary reason for decreased in development is a mineral deficiency induced by elevated Na+ ions in root rhizosphere (Khan et al., 2006). As a general result of salt stress, shoot length decreases while root length increases (Kapoor and Pande, 2015) as indicated by previous reports that the shoot length was reduced in wheat cultivars under saline stress (Khan et al., 2006).
Salinity stress can restrict plant growth in two forms: the first is physiological drought (a water stress situation in which the water availability to roots is reduced even water is present due to the high salt content of the water), and the second is salt-specific toxicity (in which the availability of water to roots is reduced even when water is present due to the high salt content of the water). Several studies have found that when exposed to salinity, biomass production decreases (Munns and Tester, 2008) as reported in Sorghum genotypes (Netondo et al., 2004). The diversity in biomass production among pearl millet varieties may be explained by differences in the accumulation of free amino acids, total soluble proteins, proline, and Na+ ions in plants developing under salinity stress. As previously suggested, these biochemicals are directly related to photosynthesis, ionic balance, nutritional absorption and cell mitotic activity (Ashraf and Harris, 2004).
The total soluble proteins are an important indication about the status of a plant. The plants may increase the level of proteins especially stress related proteins and peptides to reduce the adverse consequences of salinity stress in the cells (Doganlar et al., 2010). The increased level of proteins may help in osmotic regulation in plants cells. There could be either de novo synthesis of the proteins or constitutive expression to relatively lower levels (Singh et al., 1987). Degradation of intracellular proteins produce amino acids. The amount of free amino acids in plant cell is carefully regulated to meet the demand of proteins synthesis for cell functioning (Ashraf et al., 2008). Free amino acids play important role in cell metabolism in response to salinity stress such as synthesis, turnover and incorporation of N into high molecular compounds like proteins. This increased level of free amino acids indicates the active physiological response of plants to the stress resulting in reducing the water potential that plays important role in salt tolerance (Keutgen and Pawelzik, 2008). In current study, the salt tolerant varieties had increase levels of free amino acids under saline stress.
Proline is an amino acid with an exceptional conformational rigidity and is essential for primary metabolism (Szabados and Savouré, 2010). It is indicator of stress tolerance. Accumulated free proline is correlated with tissue Na+ ion concentration suggesting its role in osmoregulation under salt-stress (Ahanger et al., 2020). The salt tolerant plants increase their resistance by increasing the proline that increases the osmotic potential and turgor pressure of the cells and water potential under salinity stress (Ashraf et al., 2008). In pearl millet varieties the accumulation of leaf proline was increased in salt tolerant variety YDR-8-1 while the varieties YBS-93 and YBS-94 exhibited no change. However, increased level of root proline accumulation was observed in YBS-93 and YBS-94. Proline contents could be increased due to salinity stress as in wheat (Turan et al., 2007) or may remain unchanged as reported in sunflower by Golan-Goldhirsh et al. (1990).
The equilibrium of potassium and sodium ions holds great significance in maintaining the stability of plants as they play a crucial role in regulating subcellular pH, cellular stability, membrane potential, permeability, and various other biochemical processes within the cell. The capacity of plants to tolerate salt is controlled by the absorption and distribution of K+ and Na+ ions (Khan et al., 2006).
Increased levels of Na+ and Cl- ions hinder the accretion of important ions (K+ and Ca2+) through interfering with the plasma membrane's transport mechanism, K+ and Ca2+ ion channels (Munns and Tester, 2008). The growth inhibition is primarily due to Na+ absorption during saline stress. Additionally, sodium ions disrupt K+ absorption and a variety of enzymes involved in metabolism. Increased level of Na+ and K+ was observed in maize. However, rapeseed and maize accumulated more (Cui et al., 2015).
Salinity stress induces the reactive oxygen species (ROS) in plants. The ROS is identified by measuring the malondialdehyde (MDA) and hydrogen peroxide. Malondialdehyde (MDA) indicates the extent of membrane damage by lipid metabolism. Thus, the MDA is directly influenced the membrane stability (AbdElgawad et al., 2016). H2O2 are also marker for oxidative stress and membrane damage during the stress condition. The plants are not producing enough quantity of antioxidants in long term salinity. Therefore, membrane stability and organelles are destroyed in long term salinity stress. Thus, due to production of ROS the photosynthesis activity, biosynthesis and nutrient uptake is blocked (Huang et al., 2020).In our study, some varieties had increased level of MDA and hydrogen peroxide in both parts and vice versa. The H2O2 and MDA contents were increased in wheat (Mohsin et al., 2020) and maize (AbdElgawad et al., 2016).
Plants respond to saline stress by synthesising a variety of osmoprotectants and antioxidants. POD, CAT, GR, and SOD are all included in these enzymatic antioxidants (Kohli et al., 2021). The generation of APX and GR at a high level is required for the ASC/GSH cycle to capture H2O2 under salinity stress. While the synthesis of CAT and GPX is required for hydrogen peroxide detoxification under salt stress (Hasanuzzaman et al., 2020). In our investigation, we reported that saline stress boosted the CAT, APX and POD levels in some varieties in both parts (leaf and root) and vice versa. Desmostachya bipinnata exhibited an increased level of CAT, APX, and SOD during saline stress (Asrar et al., 2020). The level of CAT, SOD and POD level was also enhanced in Oenanthe javanica cultivars (Kumar et al., 2021).
5 Conclusion
From this study, it is concluded that the salt stress significantly reduced various morphological, physiological and biochemical attributes of the Pearl Millet (P. glaucum L.) varieties. However, YBS-83, YBS-98, YCMP-19 and YCMP-34 varieties which were screened as the most sensitive varieties to salt stress. The varieties YBS-10, YBS-17, YBS-18, YBS-10, YBS-13, YBS-17, YBS-18, YCMP-7, YCMP-16, YCMP-33, 14RBS-01, 14RBS-05 behaved as moderate pearl millet varieties under saline stress. While the YBS-93, YBS-94, YBS-95 and YDR-8-1 varieties were screened as the most tolerant varieties to salinity stress as they exhibited better shoot length, root length, plant biomass production and K+/Na+ along with higher level free amino acids and proline under salinity stress. Further genetic and molecular investigations are being carried out to reveal insights of the salt tolerance mechanism and signaling pathways in the screened salt tolerant varieties.
Availability of data and material
The data supporting the conclusions of this article are included within the article. Any queries regarding these data may be directed to the corresponding authors.
CRediT authorship contribution statement
Muhammad Rashid: Methodology, Investigation, Formal analysis, Writing – original draft. Sibgha Noreen: Writing – original draft, Resources, Formal analysis. Kausar Hussain Shah: Conceptualization, Supervision, Investigation, Formal analysis, Validation, Data curation, Writing – original draft, Writing – review & editing. Abdel-Rhman Z. Gaafar: Project administration, Funding acquisition, Writing – review & editing. Rooma Waqar: Writing – review & editing.
Acknowledgments
The authors extend their appreciation to the Researchers Supporting Project number RSPD2023R686, King Saud University, Riyadh, Saudi Arabia.
Declaration of competing interest
The authors declare that they have no known competing financial interests or personal relationships that could have appeared to influence the work reported in this paper.
References
- High salinity induces different oxidative stress and antioxidant responses in maize seedlings organs. Front. Plant Sci.. 2016;7:276.
- [Google Scholar]
- Influence of exogenous salicylic acid and nitric oxide on growth, photosynthesis, and ascorbate-glutathione cycle in salt stressed Vigna angularis. Biomolecules. 2020;10(1):42.
- [Google Scholar]
- Revisiting the role of ROS and RNS in plants under changing environment. Environ Exp Bot.. 2019;161:1-3.
- [Google Scholar]
- Early growth stage characterization and the biochemical responses for salinity stress in tomato. Plants.. 2021;10:712.
- [Google Scholar]
- Andrews, D.J., Kumar, K.A., 1992. Pearl Millet for Food, Feed, and Forage. In: L. S. Donald, (Ed.) Advances in Agronomy, Academic Press, pp. 89-139.
- Some prospective strategies for improving crop salt tolerance. Adv. Agron.. 2008;97:45-110.
- [Google Scholar]
- Potential biochemical indicators of salinity tolerance in plants. Plant Sci.. 2004;166:3-16.
- [Google Scholar]
- Salt induced modulations in antioxidative defense system of Desmostachya bipinnata. Plant Physiol. Biochem.. 2020;147:113-124.
- [Google Scholar]
- Rapid determination of free proline for water-stress studies. Plant Soil. 1973;39:205-207.
- [Google Scholar]
- A rapid and sensitive method for the quantitation of microgram quantities of protein utilizing the principle of protein-dye binding. Anal. Biochem.. 1976;72:248-254.
- [Google Scholar]
- Genome-wide identification and expression analysis of WRKY transcription factors in pearl millet (Pennisetum glaucum) under dehydration and salinity stress. BMC Genomics. 2020;21:231.
- [CrossRef] [Google Scholar]
- Proteomic analysis of seedling roots of two maize inbred lines that differ significantly in the salt stress response. PLoS One. 2015;10:0116697.
- [Google Scholar]
- Effects of salt stress on pigment and total soluble protein contents of three different tomato cultivars. Afr. J. Agric. Res.. 2010;5:2056-2065.
- [Google Scholar]
- Hydroxyproline and proline content of cell walls of sunflower, peanut and cotton grown under salt stress. Plant Sci.. 1990;69:27-32.
- [Google Scholar]
- Reactive oxygen species and antioxidant defense in plants under abiotic stress: revisiting the crucial role of a universal defense regulator. Antioxidants.. 2020;9
- [Google Scholar]
- Photoperoxidation in isolated chloroplasts: I. Kinetics and stoichiometry of fatty acid peroxidation. Arch. Biochem. Biophys.. 1968;125:189-198.
- [Google Scholar]
- Advances in studies on ion transporters involved in salt tolerance and breeding crop cultivars with high salt tolerance. J. Zhejiang Univ. Sci. b.. 2020;21:426-441.
- [Google Scholar]
- ICRISAT, 2021. Pearl millet. International Crops Research Institute for the Semi-arid Tropics.
- Effect of salt stress on growth parameters, moisture content, relative water content and photosynthetic pigments of fenugreek variety RMt-1. J. Plant Sci.. 2015;10:210-221.
- [Google Scholar]
- Contribution of amino acids to strawberry fruit quality and their relevance as stress indicators under NaCl salinity. Food Chem.. 2008;111:642-647.
- [Google Scholar]
- Comparative performance of some wheat genotypes growing under saline water. Pak. J. Bot.. 2006;38:1633-1639.
- [Google Scholar]
- Assessment of subcellular ROS and NO metabolism in higher plants: Multifunctional signallingmolecules. Antioxidants. 2019;8(12):641.
- [Google Scholar]
- Effect of salt stress on growth, physiological parameters, and ionic concentration of water dropwort (Oenanthe javanica) cultivars. Front. Plant Sci.. 2021;12
- [Google Scholar]
- Dynamics of salinity and land use in Punjab Province of Pakistan. Pak J Agric Res.. 2021;34:16-22.
- [Google Scholar]
- Reactive oxygen species in plants: from source to sink. Antioxidants (Basel). 2022;11(2):225.
- [Google Scholar]
- Tebuconazole and trifloxystrobin regulate the physiology, antioxidant defense and methylglyoxal detoxification systems in conferring salt stress tolerance in Triticum aestivum L. Physiol. Mol. Biol. Plants.. 2020;26:1139-1154.
- [Google Scholar]
- Munns, R., Wallace, P.A., Teakle, N.L., Colmer, T.D., 2010. Measuring soluble ion concentrations (Na+, K+, Cl−) in salt-treated plants. In: Plant Stress Tolerance: Methods and Protocols, pp: 371-382.
- Hydrogen peroxide is scavenged by ascorbate-specific peroxidase in spinach chloroplasts. Plant Cell Physiol.. 1981;22:867-880.
- [Google Scholar]
- Effects of salinity stress on some growth, physiological, biochemical parameters and nutrients in two pistachio (Pistacia vera L.) rootstocks. J. Plant Interact.. 2018;13:73-82.
- [Google Scholar]
- Characterization of osmotin: a thaumatin-like protein associated with osmotic adaptation in plant cells. Plant Physiol.. 1987;85:529-536.
- [Google Scholar]
- Variations in proline, chlorophyll and mineral elements contents of wheat plants grown under salinity stress. J. Agron.. 2007;6:137.
- [Google Scholar]
- RNAseq analysis reveals altered expression of key ion transporters causing differential uptake of selective ions in canola (Brassica napus L.) grown under NaCl Stress. Plants.. 2020;9:891.
- [Google Scholar]
Appendix A
Supplementary material
Supplementary data to this article can be found online at https://doi.org/10.1016/j.jksus.2023.102994.
Appendix A
Supplementary material
The following are the Supplementary data to this article:


