

Translate this page into:
Moringa oleifera leaves ethanolic extract ameliorates high fat diet-induced obesity in rats
⁎Corresponding author at: Professor of Biochemistry and Molecular Biology, Department of Biochemistry, Faculty of Veterinary Medicine, University of Sadat city, Sadat City 32865, Egypt. mohamed.mohamed@vet.usc.edu.eg (Mohamed M. Ahmed)
-
Received: ,
Accepted: ,
This article was originally published by Elsevier and was migrated to Scientific Scholar after the change of Publisher.
Peer review under responsibility of King Saud University.
Abstract
Abstract
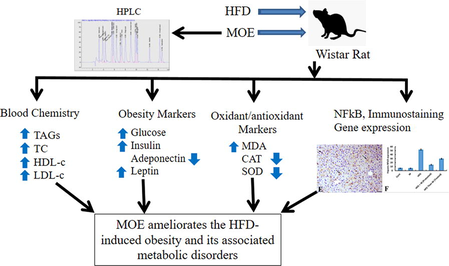
Obesity is one of the major health problems worldwide. This study aimed to evaluate anti-obesity potential of Moringa oleifera leaves ethanolic extract (MOE) in rats. Fifty male Wistar rats of 100–120 g body weight (BW) were randomly allocated to 5 groups (n = 10) as follows: Control (Cont group) was fed basal diet. Group II (M-group) was fed basal diet and orally given MOE (300 mg/kg BW) for 14 weeks. Group III (HFD-group) was fed a high fat diet (HFD) for 14 weeks. Group IV (HFD + M-group) was fed HFD and given MOE as in group II. Group V (HFD then M-group) was fed HFD for 8 weeks then basal diet and received MOE as group II for another 6 weeks. Phytochemical analysis of MOE revealed the presence of ferulic acid, kaempferol, cinnamic acid, ellagic acid, naringenin, rutin, caffeic acid, chlorogenic acid, methyl gallate gallic acid, catechin, vanillin, caffeic acid, coumaric acid, syringic acid, and pyrocatechol. Feeding HFD significantly elevated the serum level of total cholesterol, triacylglycerol, low density lipoprotein, glucose, insulin, leptin, malondialdehyde; elevated hepatic expression of nuclear factor-kappa β (NFκβ) and induced various histopathological changes in liver. Moreover, it lowered serum levels of high-density lipoprotein, adiponectin, serum superoxide dismutase activity and catalase activity compared to control group. Interestingly, administration of MOE to HFD-fed animals either concurrently (HFD + M group), or after induction of obesity (HFD then M group), significantly reversed the HFD-induced increase in BW and visceral fat mass, hyperglycemia, hyperleptinemia, hyperinsulinemia, hypoadiponectinemia, dyslipidemia; increased lipid peroxidation, hepatic NFκβ protein expression; restored normal hepatic tissue architecture and antioxidant activity. In conclusion, MOE ameliorated HFD-induced obesity, adiposity, serum biochemical and hepatic histopathological alterations. MOE accomplished these effects mostly through the anti-obesity, anti-inflammatory, anti-oxidant activities of its various bioactive identified compounds.
Keywords
Moringa oleifera
Extract
High Fat Diet
Obesity
Rats

1 Introduction
Obesity is a metabolic syndrome that is principally caused by an imbalance between energy intake and expenditure (Kanagasabapathy et al., 2013; Kim et al., 2018). However, multifactorial causes, including dietary choices, environmental factors, genetic predisposition, decreased physical activity, and the sedentary lifestyles, also take part in the development of obesity (Kanagasabapathy et al., 2013; Kim et al., 2018; Nam et al., 2020). Obesity is indicated by an excessive fat storage and elevated plasma lipid level. The total fat mass of the body is enhanced by increasing both number and size of fat cells (Kanagasabapathy et al., 2013). Obesity is one of the major public health threats worldwide because it is associated with metabolic diseases like type 2 diabetes, hypertension, cardiovascular diseases, liver diseases, kidney diseases, gallbladder diseases, dyslipidemia, and certain types of cancer (Matsuda and Shimomura, 2013; Laura Segal and Martin, 2016; Chang and Kim, 2019). The WHO has been recognized obesity as a global epidemic (Huang et al., 2016). Obesity increases the costs of healthcare systems in the countries. It accounts for 0.7–2.8% of the total health-care costs for a country. Moreover, it was estimated that, medical costs for the obese persons are 30% higher than those of normal weight (Withrow and Alter 2011). There are different approaches to treat/prevent obesity and its associated diseases. These include changing lifestyle or eating behavior, nutrition education, maintaining a regular physical exercise, and pharmacotherapy or surgical interference (Kiess et al., 2001). However, therapeutic treatments usually result in undesirable side effects of anti-obesity drugs (Cheung et al., 2013). In addition, more than 90% of persons losing weight by modifying their lifestyle, such as dieting, return to their initial weight usually within 2 to 5 years (Chang and Kim 2019). Moreover, surgical treatment of obesity increases the risk of micronutrients and macronutrients deficiencies (Xanthakos, 2009). Therefore, more concerns and attention have been paid to the natural products and their phytochemicals as promising candidate agents for preventing, and/or treating obesity with an outstanding efficacy, safety, cost effectiveness and long-term effects (Bessesen and Van Gaal, 2018). In this regard, natural bioactive compounds in plant materials such as phenols and flavonoids were reported to be effective in treating obesity (Pan et al., 2016; Abdul Rahman et al., 2017; Sayed et al., 2020).
Moringa oleifera (MO) belongs to the family Moringaceae which can be cultivated in any tropical or subtropical areas (Thurber and Fahey 2010). Leaves of MO have a high nutritive value as they are rich in minerals such as potassium, calcium, magnesium, iron, zinc and copper (Kasolo et al., 2010). They are also rich in vitamins like vitamin A, folic acid, vitamin B6 and vitamin B3, ascorbic acid, vitamin D and E (Mbikay 2012). In addition, MO leaves also contain proteins, fibers, phytochemicals like sterols, tannins, flavonoids, terpenoids, anthraquinones, saponins, alkaloids and glucosinolates, isothiocyanates, glycoside compounds (Berkovich et al., 2013). This renders MO leaves to have anticancer, anti-inflammatory, anti-ulcer, immunostimulatory properties (Mbikay, 2012; Ijarotimi et al., 2013; Jung, 2014). As Moringa leaves have a low calorific value, it was postulated to be involved in used in the diet of the obese (Oduro et al., 2008). To the best of authors' knowledge, studies addressing the anti-obesity activity of MO extract are still limited. Thus, this investigation was aimed to determine the preventive and curative potential of MO ethanolic extract (MOE) in HFD-induced obese rat
2 Material and methods
2.1 Materials
2.1.1 Preparation of Moringa oleifera alcoholic extract (MOE)
Leaves of Moringa oleifera were collected from the experimental farm at Sadat City, Menoufia governorate, Egypt. Moringa oleifera was identified and authenticated at the Department of Biochemistry, Faculty of Veterinary Medicine, University of Sadat City, Egypt. Preparation of MOE was performed as previously described by Sinha et al. (2012). Briefly, the fresh leaves of MO were washed with distilled water, shade-dried at room temperature and ground into powder. The powder was socked 70% ethanol, shaken intermittently for 48 h at room temperature. The extract was then filtered using Whatmann filter paper (size No. 1). The filtrate was air-dried at room temperature. To determine the phytochemical constituents of this extract, was subjected to screening using Liquid chromatography-mass spectrometry (LC-MS), Shimadzu LC-10 HPLC with a Grace Vydac Everest Narrowbore C18 column (100 mm × × 2.1 mm I.D.,5 μm, 300 Å) connected to an LCQ electrospray ion trap MS (Thermo Finnigan, San Jose, CA).
2.1.2 High-performance liquid chromatography (HPLC) analysis of MOE
The analysis of HPLC was done using an Agilent 1260 series. The separation was done using Kromasil C18 column (4.6 mm × 250 mm I.D., 5 μm). The mobile phase consisted of water (A) and 0.05% trifluoroacetic acid in acetonitrile (B) at a flow rate of 1 ml/min. This phase was programmed in a linear gradient as follows: 0 min (82% A); 0–5 min (80% A); 5–8 min (60% A); 8–12 min (60% A); 12–15 min (85% A) and 15–16 min (82% A). The multi-wavelength detectors were monitored at 280 nm. The volume of injection was 10 μl for the sample solution. The temperature of the column was maintained at 35 °C.
2.1.3 Assay kits
Serum glucose determination Kit (REF 10121) was purchased from HUMAN Diagnostics company (HUMAN Gesellschaftfür Biochemica und Diagnostica mbH, Wiesbaden, Germany). Assay Kits used to determine the serum levels of triacylglycerol (TAG, Cat. No. TR 2030), total cholesterol (TC, Cat. No. CH 1220), high density lipoprotein (HDL-C, Cat. No. CH 1230), low density lipoprotein (LDL-C, Cat. No. CH 1231), malondialdehyde (MDA, Cat. No. MD 2529); activities of catalase (Cat. No. CA 2517) and superoxide dismutase (SOD, Cat. No. SD 2521) were purchased from Bio-diagnostic Company (Giza, Egypt). Specific enzyme linked immunosorbent assay (ELISA) kits for determination of serum leptin (Cat. #: MBS774908), adiponectin (Cat. #: MBS177263) insulin (Cat #: MBS045315) were purchased from MyBioSource, Inc (San Diego, CA, USA).
2.1.4 Animals
Fifty adult male Wister albino rats of six weeks old and weighing 110–130 g were used in the experiment. Animals were housed in wide plastic cages at 21 ± 2 °Ċ and 30–60% R.H. with natural ventilation and 12:12 h light/dark. Rats were provided with balanced basal ration and tap water ad libitum and kept for 2 weeks for acclimatization before the onset of the experiment. All procedures used were approved by the Research Ethical Committee of the Faculty of Veterinary Medicine, University of Sadat City with approval #: Vusc-003-2-20
2.1.5 Diet
Basal Diet: The basal ration was obtained from Al-Wady Company (Cairo, Egypt). This diet was composed of soybean seeds, soybean oil, yellow corn, limestones, sodium bicarbonate, monocalcium phosphate, sodium chloride, lecithin and mixture of vitamins and minerals. The chemical composition of this basal diet was as follows: 17% protein, 68.16% carbohydrate, 4.9% fat, 3.44% fiber, 2% Choline chloride, 1%Vitamin mixture, and 3.5% Salt mixture.
High-fat diet (HFD): This was prepared as previously described (Abd Eldaim et al., 2018). This HFD was prepared basically from standard basal diet (66%), 18.7% sucrose, 8.3% yolk, 7% beef tallow.
2.2 Experimental design
Fifty male albino rats were assigned randomly into 5 groups (n = 10) as follows:
Group I (Cont group): Rats were fed a basal diet for fourteen weeks, served as a control group.
Group II (M group): animals were fed a basal diet and orally administrated administered by Gastric gavage at a dose of 300 mg/kg body weight (Mousa et al., 2019) for fourteen weeks.
Group III (HFD group): Rats were fed HFD for fourteen weeks.
Group IV (HFD + M group): animals were fed HFD and orally administered with MOE at a dose of 300 mg/kg for fourteen weeks.
Group V (HFD then M group): animals were fed HFD for eight weeks then fed a basal diet and administered MOE orally at a dose of 300 mg/kg body weight for another six weeks. Body weight of the rats in all experimental groups was measured weekly during the experimental period.
2.3 Sampling
At time points of eight and fourteen weeks from onset of the experiment, rats were fasted 10–12 h, anesthetized by using phenobarbital at a dose of 45 mg/kg BW intraperitoneally. Then, from each rat, blood sample was collected from the orbital sinus with a capillary tube onto plain tubes and were left at room temperature to clot. Then, Serum samples were prepared and kept at -80 Ċ till used for biochemical analysis.
2.3.1 Tissue sampling
Animals were anesthetized by phenobarbital (45 mg/kg BW i.p.) and sacrificed by decapitation. Then, visceral fat was collected and weighed. The liver was removed, washed with saline and a liver specimen was immediately kept in formalin (10%) for investigations of histopathology and immunohistochemistry.
2.3.2 Biochemical assays of serum metabolites, oxidant/antioxidant biomarkers:
Specific commercial assay kits were used to assay serum level of triacylglycerol according to Fassati and Prencipe (1982); total cholesterol according to Richmond (1973); HDL-cholesterol according to Burstein et al. (1970); LDL-cholesterol according to Wieland and Seidel (1983); MDA according to Kei (1978) using enzymatic colorimetric methods and following instructions of the manufacturer. The activity of blood superoxide dismutase (SOD) was examined according to Nishikimi et al., (1972), and serum catalase activity was determined according to Fossati et al. (1980) using commercial specific kits following instructions of the manufacturers.
2.3.3 Analysis of serum glucose, insulin, adiponectin, and leptin levels
Serum glucose levels were analyzed by enzymatic colorimetric method according to Caraway and Watts (1987) using specific assay kit. Serum levels of leptin and adiponectin and insulin were examined by the corresponding specific ELISA assay kits following instructions of the manufacturers. Standard curves were generated by plotting the average optical density O.D. (450 nm) obtained for each of the standard concentrations (of either leptin, adiponectin and/or insulin) on the vertical (Y) axis versus the corresponding standard concentration on the horizontal (X) axis. These standard curves were used for determination of the concentration of either leptin, adiponectin /or insulin in the serum samples.
2.4 Histopathological examination
Each liver tissue sample was fixed in neutral buffered formalin (10%). Fixed sample was processed and stained with hematoxylin and eosin as described by Bancroft et al. (1996).
2.5 Immunohistochemical study
The immunohistochemical staining was carried out as described by Saber et al. (2019). Briefly, sections from hepatic tissues were dewaxed and immersed in 0.05 M citrate buffer, pH 6.8 for antigen retrieval. Following treatment with 0.3% H2O2 and protein block, sections were incubated with polyclonal rabbit anti-NFκβ P65 antibodies (Santa Cruz, Cat# (F-6): sc-8008) at 1:100 dilution rate for 1 h at room temperature. Then, sections were rinsed with phosphate buffered saline, and incubated with a goat anti-rabbit secondary antibody (Cat# K4003, EnVision+™ System Horseradish Peroxidase Labelled Polymer; Dako) for 30 min at room temperature. Slides were visualized with DAB kit and eventually stained with Mayer's hematoxylin as a counter stain. The immunolabelling index of NF-κB P65 was presented as a percentage of positive expression in a total of 1000 cells per 8 HPF.
2.5.1 Statistical Analysis:
Statistical analysis was performed by SPSS program version 23 using one-way analysis of variance (ANOVA) followed by Duncan’s test with P values < 0.05. Data are expressed as means ± SE.
3 Results
3.1 HPLC- analysis of Moringa oleifera leaves ethanolic extract (MOE)
Analysis of MOE using HPLC indicated the presence of ferulic acid, kaempferol, cinnamic acid, ellagic acid, naringenin, rutin, caffeic acid, chlorogenic acid, methyl gallate gallic acid, catechin, vanillin, caffeic acid, coumaric acid, syringic acid, and pyrocatechol (Fig. 1 & Table1). *R.T. Retention time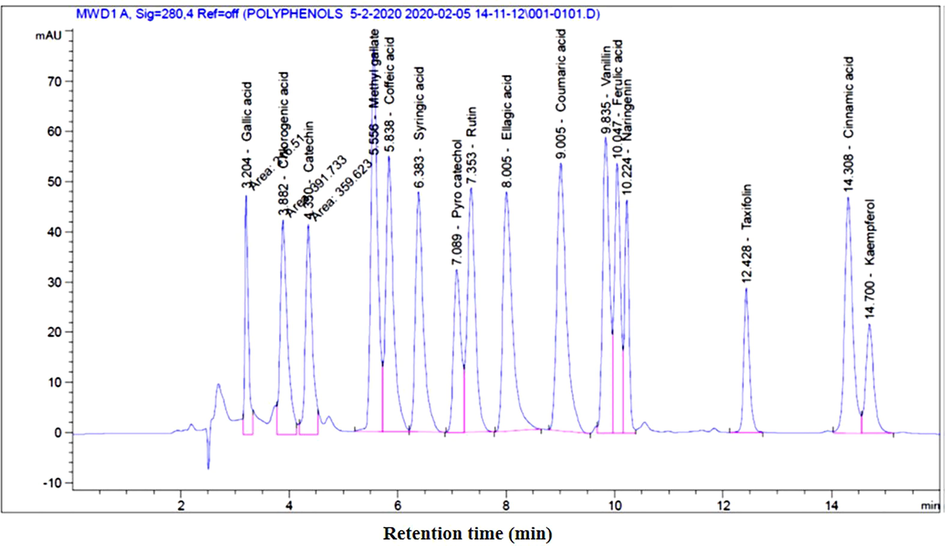
The spectrum of compounds from ethanolic extract of Moringa olifera leaves resin using HPLC.
Peak No.
R.T.* [min]
Name of the Compound
Width
[min]
Area
[mAU**s]Area (%)
1
3.204
Gallic acid
0.0749
216.51033
3.1773
2
3.882
Chlorogenic acid
0.1523
391.73346
5.7487
3
4.350
Catechin
0.1424
359.62329
5.2775
4
5.556
Methyl gallate
0.1315
663.65112
9.7391
5
5.838
Caffeic acid
0.1434
543.92767
7.9821
6
6.383
Syringic acid
0.1482
485.60019
7.1262
7
7.089
Pyrocatechol
0.1440
305.87259
4.4887
8
7.353
Rutin
0.1539
500.49432
7.3448
9
8.005
Ellagic acid
0.1828
584.67731
8.5801
10
9.005
Coumaric acid
0.1789
645.03357
9.4659
11
9.835
Vanillin
0.1308
509.96573
7.4838
12
10.047
Ferulic acid
0.1191
419.82379
6.1609
13
10.224
Naringenin
0.0897
270.10461
3.9638
14
12.428
Taxifolin
0.1100
207.46573
3.0446
15
14.308
Cinnamic acid
0.1539
484.55072
7.1108
16
14.700
Kaempferol
0.1544
225.27167
3.3059
3.2 Effect of HFD and MOE on rats' body weight
Feeding rats on HFD for 8 weeks, significanly increased body weight (Fig. 2A) which was accompaned with a significant increase in serum TAG (224.5 ± 5.5a) compared to control (127.3 ± 4.9c). Interstingly, treating the rats with MOE significantly decresed the HFD-induced increase of body weight. This effect of MOE was shown in either HFD + M group (protected group) or in HFD then M group (treated group) as shown in Fig. 2B.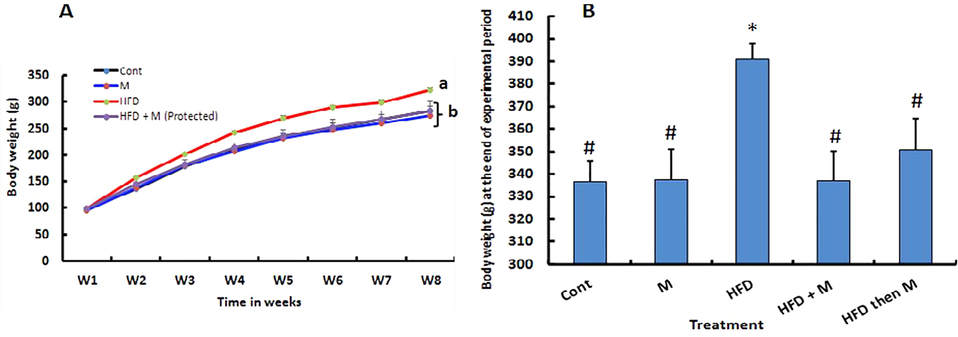
Effect of high fat diet and/or Moringa olifera leaves ethanolic extract (MOE) on body weight. Rats were fed either basal diet (Cont. group); basal diet along with MOE (300 mg/kg BW, M-group) oral administration for 14 weeks; high fat diet (HFD-group) for 14 weeks; HFD + MOE administration (300 mg/kg BW, HFD + M-group) for 14 weeks or HFD for 8 weeks then basal diet + MOE administration (300 mg/kg BW, HFD then M-group) for additional 6 weeks. Weekly live BW of rats of different group were recorded. Weekly BW for the first 8 weeks (A) and final BW (B) at the end of the experiment (14 weeks) are shown. p*<0.05 Vs Cont, p#<0.05 Vs HFD group are statistically significant different.
3.3 Effect of HFD/or MOE on the blood chemistry in different experimental groups
High fat diet significantly increased the serum level of TC, TAG, and LDL-c, meanwhile, decreased serum HDL-c level compared to the control group. Administration of MOE to HFD-fed animals either concurrently (HFD + M group), or after induction of obesity (HFD then M group), significantly ameliorated the HFD-induced alterations in lipid profile. Concurrent treatment with MOE and HFD (HFD + M group) had a more powerful effect in correction of the HFD-induced alterations than the later treatment after induction of obesity (HFD then M group). No significant difference was obtained in all tested parameters between control group and that treated with MOE alone (M group) (Table 2). Shown data are mean values ± standard errors (SE) of means, the mean difference is significant at p < 0.05. Means bearing different letters in the same column are statically different. Cont, control group; M, Moringa-treated group; HFD, high fat diet group; HFD + M, group simultaneously received HFD and moringa extract (protected); HFD then M (treated) group, group received HFD for 8 weeks then treated with moringa extract for 6 weeks. TC, total cholesterol; TAG, triacylglycerol; HDL-C, high-density lipoprotein cholesterol; LDL-C: low-density lipoprotein cholesterol.
Group
TC (mg/dL)
TAG (mg/dL)
HDL-C (mg/dL)
LDL-C (mg/dL)
Cont
185.5 ± 2.9 d
130.7 ± 3.7 d
56.8 ± 2 a
102.5 ± 4 d
M
182.3 ± 4.1 d
128.5 ± 4.4 d
61.4 ± 2.3 a
95.2 ± 3.9 d
HFD
272.6 ± 2.4 a
207 ± 4.3 a
26.4 ± 1.6 d
204.7 ± 3 a
HFD + M (Protected)
221.4 ± 4.3c
158 ± 9c
49.3 ± 2.1b
140.5 ± 5.6c
HFD then M (Treated)
252.8 ± 2b
183.5 ± 3.4b
39.7 ± 2c
176.5 ± 3.5b
3.4 Effect of HFD/or MOE on serum level of glucose, insulin, leptin and adiponectin hormones and visceral fat mass in different experimental groups
As shown in Table 3, feeding HFD (HFD group) significantly increased visceral fat mass, and serum level of glucose, insulin, leptin while the serum adiponectin level was decreased compared to control group. In HFD + M-group and HFD then M-group, serum level of glucose, leptin, insulin, and visceral fat mass were significantly reduced while serum adiponectin level was significantly increased compared to HFD-group. There was a significant difference between these tested parameters between HFD + M-group (protected group) and HFD then M-group (treated group) where these tested parameters were closer to those of control group in case of HFD + M-group (protected group). There was no difference between control group and M group in all these measured parameters Shown data are mean values ± standard errors (SE) of means, the mean difference is significant at p < 0.05. Means bearing different letters in the same column are significantly different at p < 0.05. Cont, control group; M, Moringa-treated group; HFD, high fat diet group; HFD + M, group simultaneously received HFD and moringa extract (protected); HFD then M (treated) group, group received HFD for 8 weeks then treated with moringa extract for 6 weeks.
Group
Glucose
(mg/dL)Insulin
(mU/L)Adiponectin
(pg/mL)Leptin
(ng/mL)Visceral fat (g)
Cont
102.3 ± 3.9d
38.2 ± 1.5d
525.2 ± 5.3a
269 ± 10.1d
6.1 ± 0.7c
Mk
101.5 ± 4.2d
36. 8 ± 1.7d
522.4 ± 5.9a
236.1 ± 16.6d
6.3 ± 1.3c
HFD
182 ± 3.71a
67.31 ± 2.1a
439.6 ± 6d
450.4 ± 24.5a
14.2 ± 1.2a
HFD + M (Protected)
119.6 ± 2.9c
49.4 ± 1.7c
489.71 ± 7b
277.9 ± 3.4c
8.6 ± 1.5b
HFD then M (Treated)
141.8 ± 3.5b
58.9 ± 1.7b
472.3 ± 3.1c
355.9 ± 2.2b
8.5 ± 0.5b
3.5 Effect of MOE on the oxidant/antioxidant markers in serum of different experimental groups
High fat diet-induced obesity (in HFD group) significantly increased the serum concentration of MDA while decreased serum SOD and catalase activities compared to control group. Administration of MOE to HFD-fed rats either concurrently (HFD + M group), or after induction of obesity (HFD then M group), significantly reversed the HFD-induced alterations in oxidants/antioxidant balance. In this regard, MOE significantly decreased the serum concentration of MDA while increased the serum SOD and catalase activities compared to HFD group. Moreover, concurrent treatment with MOE and HFD (HFD + M group) had a more powerful effect in correction of the HFD-induced alterations than later treatment after induction of obesity (HFD then M group). No significant difference was observed in serum MDA concentration or SOD and catalase activities between control group and that treated with MOE alone (M group), (Table 4). Shown data are mean values ± standard errors (SE) of means, the mean difference is significant at p < 0.05. The values carrying different letters in the same column are significantly different at p < 0.05. MDA, malondialdehyde; SOD, superoxide dismutase, CAT, catalase. The mean difference is significant at p < 0.05. Cont, control group; M, Moringa-treated group; HFD, high fat diet group; HFD + M, group simultaneously received HFD and moringa extract (protected); HFD then M (treated) group, group received HFD for 8 weeks then treated with moringa extract for 6 weeks.
Group
MDA
(nmol/mL)SOD
(U/mL)CAT
(U/L)
Cont
10.95 ± 0.4d
3.83 ± 0.09a
235.5 ± 5.7a
M
11.16 ± 0.5d
3.72 ± 0.15a
233.38 ± 4.7a
HFD
37.89 ± 1.5a
0.96 ± 0.0d
179.29 ± 3.9c
HFD + M (Protected)
19.67 ± 2.4c
2.38 ± 0.14b
213.57 ± 6.4b
HFD then M (Treated)
27.73 ± 1.5b
1.68 ± 0.05c
201 ± 6.8b
3.6 Histopathological findings
Histopathological examination of H & E-stained section of rat liver revealed that, liver of control animal (Cont group) indicated normal hepatocytes arranged in cords around the central vein (arrows) (Fig. 3A). Liver of animals treated with MOE alone (M group) showed normal hepatic tissues (arrow), (Fig. 3B). Liver of HFD-induced obese animal (HFD group) showed a marked diffuse steatosis (arrows), granular hepatic vacuolation and apoptosis within hepatocytes (arrowhead) (Fig. 3C). At the meantime, liver of animal concurrently fed HFD and administered MOE (HFD + M group), showed a marked decrease the hepatic steatosis and along with degenerative changes within the hepatic tissues (arrow indicates single fat vacuole) (Fig. 3D). Finally, Liver of animals treated with MOE after induction of obesity by HFD feeding (HFD Then M-group) showed mild granular degenerative changes within the hepatocytes with tiny fat vacuoles (arrows) (Fig. 3E).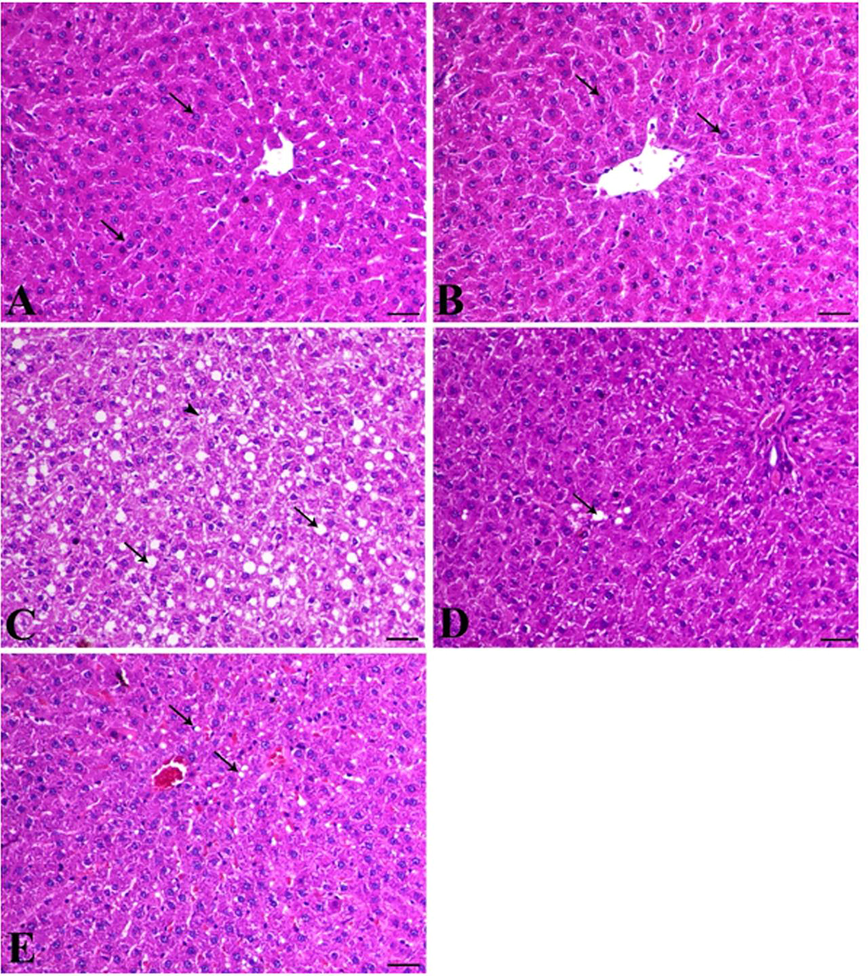
Photomicrographs of H & E-stained section of rat liver. Rats were, fed and treated as mentioned in Fig. 1 and as detailed in materials and methods section. (A) Liver of control group animals (Cont group) showing normal hepatocytes arranged in cords around the central vein (arrows); (B), Liver from MOE-treated rats (M-group) showing normal hepatic tissues (arrow); (C), Liver of HFD-fed animals (HFD-group) shows a marked diffuse steatosis (arrows), granular hepatic vacuolation and apoptosis within hepatocytes (arrowhead); (D), Liver of animal co-treated with MOE along with HFD-feeding showing a marked decrease in the hepatic steatosis and also degenerative changes within the hepatic tissues (arrow indicates single fat vacuole); (E), Liver of HFD-fed animals for 8 weeks then received MOE treatment (HFD then MOE) showing a mild granular degenerative changes within the hepatocytes with tiny fat vacuoles (arrows), bar = 50 µm, X200.
3.7 Immunohistochemical findings
Immunohistochemical analysis of NFκβ P65 protein expression in hepatic tissue revealed that liver samples from both control animals (Cont group) and MOE-treated animals (M group) exhibited a scanty NFκβ expression within hepatocytes (Fig. 4 A&B). However, liver of HFD group indicated an increase of NFκβ P65 antibody immunostaining within hepatic tissues (Fig. 4C). Interestingly, concurrent administration of MOE and feeding HFD to rats (HFD + M group), resulted in a decrease in the expression of NFκβ within the hepatic parenchyma (Fig. 4D). At the meantime, treating of HFD-induced obese rats (HFD Then M-group) caused a significant reduction of NFκβ expression within the hepatocytes compared to HFD group despite the reducing effect on NFκβ expression was more potent in HFD + M group than HFD Then M-group (Fig. 4E). There was a significant increase in the immunolabelling index of NF-κβ P65 in HFD-induced obese rats (HFD-group) compared to control group (Cont. group). This increased NF-κβ P65 expression index was significantly inhibited in response to MOE in both HFD + M-group and HFD then M-group while there was no significant difference between both these groups (Fig. 4F).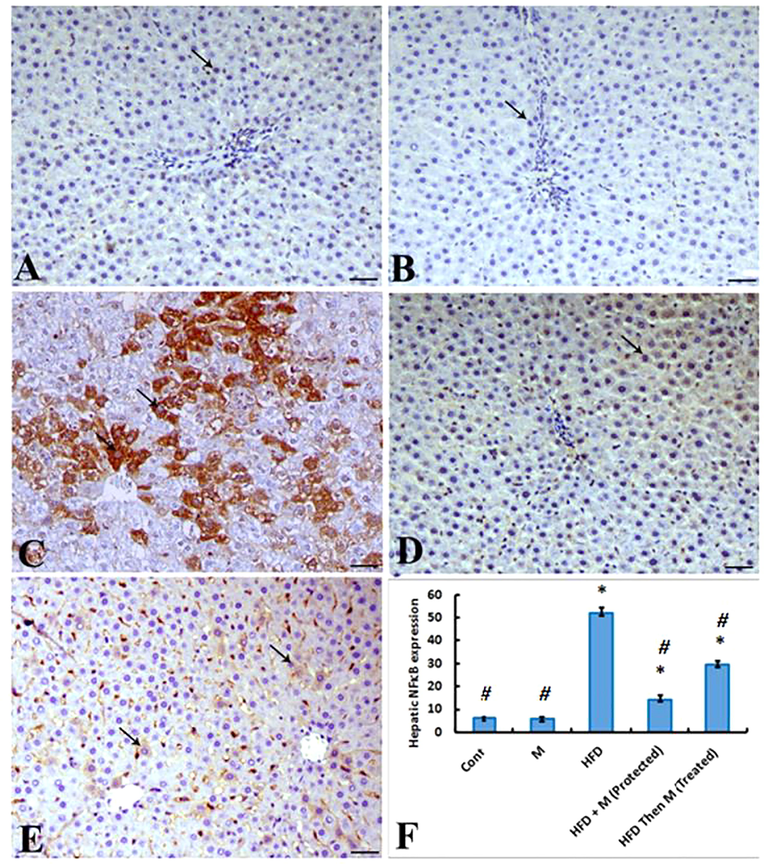
Photomicrographs of a hepatic sections immunostained with NFκβ P65 antibody. (A) and (B), livers of animals from control (Cont. group) and MOE-treated (M-group) showing a scanty NFκβ P65 antibody expression within hepatocytes (arrow); (C), liver of HFD-fed animals (HFD group) showing a marked increase of NFκβ P65 antibody immunostaing within hepatic tissues (arrows); (D), liver of HFD-fed animals co-retreated with MOE (HFD + M group) showing a marked decrease the expression of NFκβ P65 within the hepatic parenchyma (arrow), NFκβP65 antibody IHC; (E), livers from animals fed HFD for 8 weeks then treated with MOE (HFD then M-group) showing marked decrease of NFκβ P65 within the hepatocytes (arrows), bar = 50 µm, X200; F) Graph showing the expression level of NFκβ. The immunolabelling index of NF-κβ P65 is presented as a percentage of positive expression in a total 1000 cells per 8 HPF. p*<0.05 Vs Cont group; p#<0.05 Vs HFD group are statistically different.
4 Discussion
Obesity is considered one of the major public health problems worldwide (Matsuda and Shimomura, 2013; Laura Segal and Martin, 2016; Chang and Kim, 2019). Although, obesity is a multifactorial disorder, the consumption of a HFD, is considered an important predisposing factor for its development (Kim et al. 2000). In the current study, feeding rats on HFD for 8 weeks, significantly increased body weight compared to control group fed on normal diet. There was a clear difference in the body weight between the HFD fed group (HFD group) and normal diet fed group (Cont group) starting from the fourth week of experiment. This result agrees with those of the previous studies (Amin and Nagy, 2009; Ahmed et al., 2015). Development of obesity in response to HFD feeding could be attributed to the ability of HFD to induce a state of a positive energy balance which results in an increase of visceral fat deposition and agrees to our finding of increased visceral fat mass in HFD group compared to control. Moreover, a previous study showed that feeding of HFD was accompanied by molecular mechanisms that favor fat storage in muscle rather than oxidation (Schrauwen-Hinderling et al. 2005). Interestingly, administration MOE counteracted the effects of feeding HFD in inducing obesity. In this regard, MOE prevented HFD-induced obesity in group that concurrently received HFD feeding and MOE treatment and, also reduced BW in group that treated with MOE after induction of obesity by HFD feeding compared to HFD group.
The current results also demonstrated that feeding rats HFD induced hyperglycemia, hyperinsulinemia, hypoadiponectinemia dyslipidemia, represented by increased serum TAG, TC, LDL-c levels while decreased serum level of HDL-c, and increased oxidative stress along with alterations of liver structures that were accompanied with increased hepatic expression of NF-κβ protein expression respectively. The other explanation of HFD-induced obesity, hyperglycemia and dyslipidemia, hyperinsulinemia, hypoadiponectinemia in the present study is the development of leptin resistance and insulin resistance. Leptin is an adipocytokine produced by the adipose tissue in proportion to adipose mass. Serum leptin level increases and decreases with weight gain and weight loss respectively (Zhang et al., 1994; Maffei et al., 1995). It is a key player in a wide range of functions including decreasing appetite and thereby food intake, increasing energy expenditure and consequently body weight. Thus, Leptin acts primarily as an anti-obesity hormone. Its serum levels in healthy individuals positively correlates with body fat content (Considine et al., 1996; Trayhurn et al., 1999). The observed hyperleptinemia in HFD group in the present study could be attributed to the increased BW and visceral fat mass in response to HFD feeding. This agrees to the previous reports (Zhang et al., 1994; Maffei et al., 1995; Considine et al., 1996). The failure of increased circulating leptin to stimulate energy expenditure and consequently to decease BW in HFD group can be explained by development of state of leptin resistance in such group which goes parallel to the finding of the previous studies showed that rodents fed a high-fat diet develop resistance to peripherally administered leptin before development of resistance to leptin that centrally injected (Van Heek et al., 1997; Halaas et al., 1997). Adiponectin is an adipose tissue derived protein hormone with a potential antidiabetic, antiinflammatory, and antiatherogenic activities (Wabu et al., 2010; Maeda et al., 2002). Plasma adiponectin concentrations are inversely proportional to adiposity and decreased in insulin resistance, Type 2 Diabetes Mellitus and obesity, (T2DM) (Hotta et al., 2000; Halleux et al., 2001). Maeda et al. (2002) reported that over nutrition causes hypoadiponectinemia and increased TNF-α level which results in insulin resistance. It also decreases glucose release from hepatocyte. In the current study, HFD induced hyperglycemia could be caused by the hypoadipnectinemia that resulted from HFD-induced obesity (Berg et al., 2001). This effect of adiponectin on glucose level could be independent from insulin (Berg et al., 2001). Moreover, this hypoadipnectinemia in the HFD-group could be responsible for the decreased insulin sensitivity and subsequent hyperinsulinemia observed in these results as adiponectin was known as a potent insulin sensitizing factor, and hypoadiponectinemia was shown to be associated with obesity, T2DM, insulin resistance (Weyer et al., 2001; Hotta et al., 2000; Maeda et al., 2002). In addition, the current study indicated a significant increase in NFκβ hepatic expression in HFD group. Nuclear factor-κβ (NF-κβ) is a multifunctional transcription factor that can be activated by numerous types of extracellular stimuli including physical stress, oxidative stress, bacterial products, numerous inflammatory stimuli such as TNF-α (Boyce et al., 2010). NF-κβ regulates expression of genes involved in a variety of cellular activities (Boyce et al., 2010; Novack, 2011). When NF-κβ is activated, it translocates into the nucleus, binds to its cognate DNA sequence, and regulates the expression of target cytokines (Liou and Baltimore, 1993; Wang et al., 2002; Boyce et al., 2010; Novack, 2011). The increased expression of NF-κβ in HFD group could be mediated by the increased oxidative stress in that group (Sho and Xu 2019). Furthermore, obesity is known to be related to a state of chronic, sterile, low grade, systemic inflammation which has been termed “meta-inflammation”. This contributes to development of insulin resistance (Yang et al, 2006; Yudkin et al., 2000). Additionally, obesity was shown to be associated with elevated levels of circulating TNFα, and IL-6 (Bastard et al., 2000; Pickup et al., 2000) which could be responsible for this increased hepatic expression of NF-κβ in HFD group and its associated histopathological alterations in hepatic tissue in this group. Moreover, the increased oxidative stress in HFD induced obesity in this study agrees to the previous results of Orabi et al., (2018). This increased oxidative stress could explain and takes part in mediating the increased NFκβ expression and the associated inflammatory condition indicated in histopatholoical findings in hepatic tissue in HFD group.
The present findings revealed the ability of MOE to counteract the HFD-induced oxidative stress and upregulation of proinflammatory marker NF-κβ and its associated hepatic tissue alterations. These effects of MOE can be attributed to its phytochemical ingredients that shown to have antioxidant and anti-inflammatory activities including Caffeic acid and Methyl gallate and Catechin (Gülçin, 2006; Rahman et al., 2016; Hyun et al., 2019; Oliveira-Marques et al., 2009). It also contains Gallic acid that was reported to have antioxidant, anti-inflammatory activities downregulating the release of inflammatory mediators including TNF-α, NF-κβ (Dludla et al., 2018; Hyun et al., 2019; Badavi et al., 2019). The results of this study also revealed the ability of MOE to reverse HFD-induced increase of body weight, visceral fat mass, dyslipidemia, hyperglycemia, hyperinsulinemia, hyperleptinemia and hypodiponectinemia. The detected anti-obesity of MOE could be attributed to its revealed content of a variety of bioactive chemical compounds with anti-obesity potentials. Of these compounds are ferulic acid, kaempferol, cinnamic acid, ellagic acid, naringenin, rutin, caffeic acid, chlorogenic acid, methyl gallate, and catechin. In this regard, ferulic acid was demonstrated to reverse the HFD-induced increase in visceral fat mass, and body weight in HFD-induced obese mice model. It also significantly decreased the HFD-induced rises in serum lipid profiles, and the serum levels of glucose, insulin hormone. In addition, ferulic acid significantly suppressed the HFD-induced upregulation of serum leptin level in HFD-fed mice (de Melo et al., 2017). These effects agree to our present findings.
Serum leptin levels positively correlate with body fat content (Trayhurn et al., 1999), as leptin is known to produced mainly by adipocyte (Margetic et al., 2002). However, there is a negative correlation between adiponectin level and adiposity, insulin resistance and T2DM (Hotta et al., 2000; Halleux et al., 2001). Therefore, the decreased leptin level and increased serum adiponectin in response to MOE administration, could be resulted from the decreased visceral fat mass in these groups. Thus the ability of MOE to ameliorate the HFD-induced dyslipidemia, hyperglycemia and hyperinsulinemia can be explained by its body weight lowering effect in HFD-induced obesity, with subsequent increased adiponectin level witch is known as an insulin sensitizing factor (Hotta et al, 2000; Weyer et al, 2001; Maeda et al., 2002), it also was found to enhance FFA oxidation in muscle, clear plasma FFA in HFD-fed mice (Fruebis et al., 2001), reduce glucose production from hepatocyte. Therefore, it was considered an insulin sensitizing factor linking adipose tissue and whole-body glucose metabolism. (Berg et al., 2001). The bioactive compounds of the MOE involved also Kaempferol which was shown in a recent study (Wang et al., 2020) to reduce HFD-induced increase in BW, serum glucose, cholesterol and triglyceride levels and insulin resistance in HFD-induced obese mice. Therefore, Kaempferol could be responsible in part for the MOE effect in ameliorating HFD-induced alterations in BW and blood chemistry in our current results. In the same context, Cinnamic acid showed an anti-obesity effect in HFD-induced obese rats. This was demonstrated by reduction of BW, serum level of leptin and ameliorating the HFD-induced dyslipidemia in response to cinnamic acid treatment (Mnafgui et al., 2015). The results that agree to our present findings and can explain the anti-obesity effect exhibited by MOE in the present study. Ellagic acid revealed an anti-diabetic effect through improving hepatic insulin sensitivity and lipid metabolism and to have a potent antioxidant effect (Polce et al., 2018). Therefore, ellagic acid could take part in the ability of MOE able to improve the HFD-induced alterations in the tested serum chemistries and NFκβ hepatic expression along with hepatic histopathological alterations. Similarly, Naringenin, a bioactive compound of MOE is a flavonoid compound with an antioxidant (Renugadevi and Prabu 2009), anti-inflammatory (inhibited the production and expression of IL-1β, IL-6, and MCP-1, NFκβ) hypoglycemic and antidiabetic effects (Annadurai et al., 2012; Alam et al., 2014). In addition, Cho et al. (2011) have demonstrated the hypolipidemic and anti-obesity activities of naringenin in rat and referred these activities to ability of naringin to induce hepatic expression of PPARα, carnitine palmitoyltransferase 1, and uncoupling protein 2 expression. Furthermore, naringin and naringenin were proven to be effective for treating metabolic syndrome and obesity in animal models (Mulvihill et al., 2010). This can take part in explanation of the findings of the current studies concerning the effect of MOE efficacy to reverse HFD-induced biochemical and histopathological alterations in rats. Both chlorogenic acid and caffeic acid were shown to significantly decrease body weight, visceral fat mass and plasma levels of leptin and insulin compared in HFD-fed mice. In addition, they decreased plasma concentrations of TAG, TC, whereas increased the plasma adiponectin level in the HFD-fed mice. Body weight was significantly correlated with plasma leptin and insulin. Caffeic acid was also reported to have anti-inflammatory, anti-cancer, anti-oxidative activities (Touaibia et al., 2011; Yucel et al., 2012). These results completely agree to our present results and can explain the findings obtained by MOE administration to HFD-fed rats. Similarly, rutin, another bioactive constituent of MOE was shown to have anti-obesity, anti-inflammatory and hypoglycemic effect (Hsu et al., 2009; Choi et al., 2006). Catechins, as well as methyl gallate are phenolic compounds having diverse biological activities. Of these activities are anti-obesity, anti-atherosclerotic, anti-diabetic, anti-inflammatory and the anti-cancer effects (Suzuki et al, 2016; Dludla et al., 2019). These activities render them to take part in exhibiting the antiobesity, antihyperglycemic, antioxidative, and anti-inflammatory properties of MOE.
In conclusion, the present study, clearly established HFD-induced obesity in rat model and its associated dyslipidemia, hyperglycemia, hyperleptinemia, hypoadiponectinemia, increased oxidative stress, upregulated expression of inflammatory marker as well as various histopathological alterations in hepatic tissue. At the meantime, the results also showed a significant amelioration of these adverse effects of HFD-induced obesity by MOE treatment. This ameliorative effect is mostly occurring through the antioxidative, anti-inflammatory, antidiabetic, anti-obesity properties of the various bioactive compounds detected in the MOE.
Acknowledgement
This research was financed by Taif University, Saudi Arabia [Project Number 1-440-6145].
Declaration of Competing Interest
The authors declare that they have no known competing financial interests or personal relationships that could have appeared to influence the work reported in this paper.
References
- L-Carnitine-induced amelioration of HFD-induced hepatic dysfunction is accompanied by a reduction in hepatic TNF-α and TGF-β1. Biochem. Cell Biol.. 2018;96(6):713-725.
- [Google Scholar]
- Anti-obesity and antioxidant activities of selected medicinal plants and phytochemical profiling of bioactive compounds. Int. J. Food Prop.. 2017;20(11):2616-2629.
- [Google Scholar]
- Anti-obesity effects of Taif and Egyptian pomegranates: molecular study. Biosci. Biotechnol. Biochem.. 2015;79(4):598-609.
- [Google Scholar]
- Effect of citrus flavonoids, Naringin and Naringenin, on metabolic syndrome and their mechanisms of action. Adv. Nutrition. 2014;5(4):404-417.
- [Google Scholar]
- Effect of Carnitine and herbal mixture extract on obesity induced by high fat diet in rats. Diabetol. Metab. Syndr.. 2009;1(1):17.
- [Google Scholar]
- Antihyperglycemic and antioxidant effects of a flavanone, naringenin, in streptozotocin–nicotinamide-induced experimental diabetic rats. J. Physiol. Biochem.. 2012;68(3):307-318.
- [Google Scholar]
- In vivo and in vitro evidence for the involvement of Nrf2-antioxidant response element signaling pathway in the inflammation and oxidative stress induced by particulate matter (PM10): the effective role of gallic acid. Free Radical Res.. 2019;53(2):210-225.
- [Google Scholar]
- Theory and Practice of Histological Techniques (4th edition). Edinburgh, London, Melbourne: Churchill Livingstone; 1996.
- Elevated levels of interleukin 6 are reduced in serum and subcutaneous adipose tissue of obese women after weight loss. J. Clin. Endocrinol. Metab.. 2000;5(9):3338-3342.
- [Google Scholar]
- The adipocyte secreted protein Acrp30 enhances hepatic insulin action. Nat. Med.. 2001;7:947-953.
- [Google Scholar]
- Moringa oleifera aqueous leaf extract down-regulates nuclear factor-kappa B and increases cytotoxic effect of chemotherapy in pancreatic cancer cells. BMC Complement Altern. Med.. 2013;13:212-219.
- [Google Scholar]
- Progress and challenges in anti-obesity pharmacotherapy. Lancet Diabetes Endocrinol.. 2018;6:237-248.
- [Google Scholar]
- Functions of nuclear factor kappaB in bone. Ann. N. Y. Acad. Sci.. 2010;1192:367-375.
- [Google Scholar]
- Rapid method for the isolation of lipoproteins from human serum by precipitation with polyanions. J. Lipid Res.. 1970;11(6):583-595.
- [Google Scholar]
- Carbohydrates. In: Tietz N.W., ed. Fundamentals of Clinical Chemistry (3ry ed). Philadephia: WB saunde-rs; 1987. p. :422-447.
- [Google Scholar]
- Natural products and obesity: a focus on the regulation of mitotic clonal expansion during Adipogenesis. Molecules. 2019;24(6):1157.
- [Google Scholar]
- Dietary naringenin increases hepatic peroxisome proliferators-activated receptor alpha protein expression and decreases plasma triglyceride and adiposity in rats. Eur. J. Nutr.. 2011;50:81-88.
- [Google Scholar]
- Anti-adipogenic activity of rutin in 3T3-L1 cells and mice fed with high-fat diet. BioFactors. 2006;26(4):273-281.
- [Google Scholar]
- Serum immunoreactive-leptin concentrations in normal-weight and obese humans. New England J. Med.. 1996;334(5):292-295.
- [Google Scholar]
- Ferulic acid lowers body weight and visceral fat accumulation via modulation of enzymatic, hormonal and inflammatory changes in a mouse model of high-fat diet-induced obesity. Brazilian J. Med. Biol. Res.. 2017;50(1):e5630
- [Google Scholar]
- Inflammation and oxidative stress in an obese state and the protective effects of gallic acid. Nutrients. 2018;11(1):23.
- [Google Scholar]
- Serum triglycerides determined colorimetrically with an enzyme that produces hydrogen peroxide. Clin. Chem.. 1982;28(10):2077-2080.
- [Google Scholar]
- Use of 3,5-dichloro-2-hydroxybenzenesulfonic acid/4-aminophenazone chromogenic system in direct enzymic assay of uric acid in serum and urine. Clin. Chem.. 1980;26(2):227-231.
- [Google Scholar]
- Proteolytic cleavage product of 30-kDa adipocyte complement-related protein increases fatty acid oxidation in muscle and causes weight loss in mice. Proc. Natl. Acad. Sci.. 2001;98(4):2005-2010.
- [Google Scholar]
- Antioxidant activity of caffeic acid (3,4-dihydroxycinnamic acid) Toxicology. 2006;217(2–3):213-320.
- [Google Scholar]
- Physiological response to long-term peripheral and central leptin infusion in lean and obese mice. Proc. Natl. Acad. Sci. USA. 1997;94(16):8878-8883.
- [Google Scholar]
- Secretion of adiponectin and regulation of apM1 gene expression in human visceral adipose tissue. Biochem. Biophys. Res. Commun.. 2001;288:1102-1107.
- [Google Scholar]
- Plasma concentrations of a novel, adipose-specific protein, adiponectin, in type 2 diabetic patients. Arterioscler. Thromb. Vasc. Biol.. 2000;20(6):1595-1599.
- [Google Scholar]
- Phenolic compounds rutin and O-coumaric acid ameliorate obesity induced by high-fat diet in rats. J. Agric. Food Chemistry. 2009;57(2):425-431.
- [Google Scholar]
- Delphinidin chloride and its hydrolytic metabolite gallic acid promote differentiation of regulatory T cells and have an anti-inflammatory effect on the allograft model. J. Food Sci.. 2019;84(4):920-930.
- [Google Scholar]
- Comparative study on nutrient compo-sition, phytochemical, and functional characteristics of raw, germinated, and fermented Moringa oleifera seed flour. Food Sci. Nutr.. 2013;1(6):452-463.
- [Google Scholar]
- Soluble extract from Moringa oleifera leaves with a new anti-cancer activity. PLoS ONE. 2014;9:1-10.
- [Google Scholar]
- Beta-glucan-rich extract from Pleurotus sajor-caju (Fr.) Singer prevents obesity and oxidative stress in C57BL/6J Mice fed on a high-fat diet. Evid. Based Complement. Altern. Med. 2013:185259.
- [Google Scholar]
- Phytochemicals and uses of Moringa oleifera leaves in Ugandan rural communities. J. Med. Plants Res.. 2010;4:753-757.
- [Google Scholar]
- Serum lipid peroxide in cerebrovascular disorders determined by a new colorimetric method. Clin. Chim. Acta. 1978;90(1):37-43.
- [Google Scholar]
- Clinical aspects of obesity in childhood and adolescence-Diagnosis, treatment and prevention. Int. J. Obesity. 2001;25(1):S75-S79.
- [Google Scholar]
- High-fat diet-induced muscle insulin resistance: relationship to visceral fat mass. Am. J. Physiol. Regul. Integr. Comp. Physiol.. 2000;279(6):R2057-R2065.
- [Google Scholar]
- Impaired lipolysis diminished fat oxidation and metabolic inflexibility in obese girls with polycystic ovary syndrome. J. Clin. Endocrinol. Metab.. 2018;103(2):546-554.
- [Google Scholar]
- The State of Obesity: Better Policies for a Healthier America. Princeton, NJ: Robert Wood Johnson Foundation; 2016.
- Regulation of the NF-kappa B/rel transcription factor and I kappa B inhibitor system. Curr. Opin. Cell. Biol.. 1993;5(3):477-487.
- [Google Scholar]
- Diet-induced insulin resistance in mice lacking adiponectin/ACRP30. Nat. Med.. 2002;8(7):731-737.
- [Google Scholar]
- Leptin levels in human and rodent; measurement of plasma leptin and ob RNA in obese and weight-reduced subjects. Nat. Med.. 1995;1(11):1155-1161.
- [Google Scholar]
- Leptin: a review of its peripheral actions and interactions. Int. J. Obesity. 2002;26(11):1407-1433.
- [Google Scholar]
- Increased oxidative stress in obesity: implications for metabolic syndrome, diabetes, hypertension, dyslipidemia, atherosclerosis, and cancer. Obesity Res. Clin. Pract.. 2013;7:e330-e341.
- [Google Scholar]
- Therapeutic potential of Moringa oleifera leaves in chronic hyperglycemia and dyslipidemia: a review. Front. Pharmacol.. 2012;3:1-12.
- [Google Scholar]
- Anti-obesity and cardioprotective effects of cinnamic acid in high fat diet- induced obese rats. J. Food Sci. Technol.. 2015;52(7):4369-4377.
- [Google Scholar]
- Protective effect of Moringa oleifera leaves ethanolic extract against thioacetamide-induced hepatotoxicity in rats via modulation of cellular antioxidant, apoptotic and inflammatory markers. Environ. Sci. Pollut. Res.. 2019;26(31):32488-32504.
- [Google Scholar]
- Naringenin decreases progression of atherosclerosis by improving dyslipidemia in high-fat–fed low-density lipoprotein receptor–null mice. Arterioscler. Thromb. Vasc. Biol.. 2010;30(4):742-748.
- [Google Scholar]
- Obesity fact sheet in Korea, 2019: Prevalence of obesity and abdominal obesity from 2009 to 2018 and social factors. J. Obesity Metab. Syndr.. 2020;29:124.
- [Google Scholar]
- The occurrence of superoxide anion in the reaction of reduced phenazine methosulfate and molecular oxygen. Biochem. Biophys. Res. Commun.. 1972;46(2):849-854.
- [Google Scholar]
- Nutritional potential of two leafy vegetables: Moringa oleifera and Ipomoea batatas leaves. Sci Res. Essays. 2008;3:57-60.
- [Google Scholar]
- Modulation of NF-kappaB-dependent gene expression by H2O2: a major role for a simple chemical process in a complex biological response. Antioxid. Redox Signal.. 2009;11(9):2043-2053.
- [Google Scholar]
- Commiphora myrrha resin alcoholic extract ameliorates high fat diet induced obesity via regulation of UCP1 and adiponectin proteins expression in rats. Nutrients. 2018;12(3):803.
- [CrossRef] [Google Scholar]
- Molecular mechanisms of the anti-obesity effect of bioactive compounds in tea and coffee. Food Function. 2016;7:4481-4491.
- [Google Scholar]
- Inflammation and oxidative stress in an obese state and the protective effects of gallic acid. Nutrients. 2019;11(1):23.
- [Google Scholar]
- Plasma interleukin-6, tumour necrosis factor alpha and blood cytokine production in type 2 diabetes. Life Sci.. 2000;67(3):291-300.
- [Google Scholar]
- Ellagic acid alleviates hepatic oxidative stress and insulin resistance in diabetic female rats. Nutrients. 2018;10(5):531.
- [Google Scholar]
- Methyl gallate, a potent antioxidant inhibits mouse and human adipocyte differentiation and oxidative stress in adipocytes through impairment of mitotic clonal expansion. BioFactors. 2016;42(6):716-726.
- [Google Scholar]
- Naringenin protects against cadmium-induced oxidative renal dysfunction in rats. Toxicology. 2009;256(1-2):128-134.
- [Google Scholar]
- Preparation and properties of a cholesterol oxidase from Nocardia sp. and its application to the enzymatic assay of total cholesterol in serum. Clin. Chem.. 1973;19(12):1350-1356.
- [Google Scholar]
- Olmesartan ameliorates chemically-induced ulcerative colitis in rats via modulating NFκB and Nrf-2/HO-1 signaling crosstalk. Toxicol. Appl. Pharmacol.. 2019;364:120-132.
- [Google Scholar]
- Ginger water reduces body weight gain and improves energy expenditure in rats. Foods.. 2020;9(1):38.
- [Google Scholar]
- Intramyocellular lipid content molecular adaptations in response to a 1-week high-fat diet. Obes. Res.. 2005;13(12):2088-2094.
- [Google Scholar]
- Role and mechanism of ROS scavengers in alleviating NLRP3-mediated inflammation. Biotechnol. Appl. Biochem.. 2019;66(1):4-13.
- [Google Scholar]
- Amelioration of ionizing radiation induced lipid peroxidation in mouse liver by Moringa oleifera Lam. leaf extract. Indian J. Exp. Biol.. 2012;50(3):209-215.
- [Google Scholar]
- Beneficial effects of tea and the green tea Catechin Epigallocatechin-3-gallate on obesity. Molecules. 2016;21(10):1305.
- [Google Scholar]
- Adoption of Moringa oleifera to combat under-nutrition viewed through the lens of the “Diffusion of Innovations” theory. Food Sci. Nutr.. 2010;48:1-13.
- [Google Scholar]
- Caffeic acid, a versatile pharmacophore: an overview. Mini-Rev. Med. Chem.. 2011;11(8):695-713.
- [Google Scholar]
- Leptin: fundamental aspects. Int. J. Obes. Relat Metab Disord.. 1999;23(S1):S22-S28.
- [Google Scholar]
- Diet-induced obese mice develop peripheral, but not central, resistance to leptin. J. Clin. Investig.. 1997;99(3):385-390.
- [Google Scholar]
- Adiponectin and AdipoR1 regulate PGC-1alpha and mitochondria by Ca (2+) and AMPK/SIRT1. Nature. 2010;464:1313-1319.
- [Google Scholar]
- Preventive effects of Kaempferol on high-fat diet-induced obesity complications in C57BL/6 Mice. Biomed Res. Int. 2020:4532482.
- [Google Scholar]
- The role of NF-kappaB in the regulation of cell stress responses. Int. Immunopharmacol.. 2002;2:1509-1520.
- [Google Scholar]
- Hypoadiponectinemia in obesity and type 2 diabetes: close association with insulin resistance and hyperinsulinemia. J. Clin. Endocrinol. Metab.. 2001;86(5):1930-1935.
- [Google Scholar]
- A simple specific method for precipitation of low density lipoproteins. J. Lipid Res.. 1983;24(7):904-909.
- [Google Scholar]
- The economic burden of obesity worldwide: a systematic review of the direct costs of obesity. Obes. Rev.. 2011;12:131-141.
- [Google Scholar]
- Nutritional deficiencies in obesity and after bariatric surgery. Pediatr. Clin. North Am.. 2009;56(5):1105-1121.
- [Google Scholar]
- Acute-phase serum amyloid a: an inflammatory adipokine and potential link between obesity and its metabolic complications. PLoS Med.. 2006;3(6):e287.
- [Google Scholar]
- Protective effect of caffeic acid phenethyl ester on oxidative stress in diabetic rat sciatic nerve. Int. J. Pharmacol.. 2012;8(6):577-581.
- [Google Scholar]
- Inflammation, obesity, stress and coronary heart disease: is interleukin-6 the link? Atherosclerosis. 2000;148(2):209-214.
- [Google Scholar]
- Positional cloning of mouse ob gene and its human homologue. Nature. 1994;737:425-432.
- [Google Scholar]


