

Translate this page into:
Molecular structure, drug likeness and QSAR modeling of 1,2-diazole derivatives as inhibitors of enoyl-acyl carrier protein reductase
⁎Corresponding author. s.belaidi@univ-biskra.dz (Salah Belaidi)
-
Received: ,
Accepted: ,
This article was originally published by Elsevier and was migrated to Scientific Scholar after the change of Publisher.
Peer review under responsibility of King Saud University.
Abstract
Abstract
Quantitative structure-activity relationships and drug-likeness evaluations were investigated for 33 compounds of 1,2-diazole derivatives as anti-mycobacterium tuberculosis. MLR procedures were used to obtain QSAR models. The predictivity of the models was estimated using cross-validation with the leave-one-out method. The results show a high correlation between the experimental and predicted activity values, indicating the good quality of the QSAR model.
Keywords
1,2-Diazole
DFT
MPO
Drug-likeness
QSAR

1 Introduction
Pyrazole (1,2-diazole) is a five-membered heterocyclic ring that is a lead compound for the design of potent bioactive agents. Given data represents that pyrazole being heterocyclic planar five-membered rings have various pharmacological actions (Jamwal et al., 2013). Pyrazole derivatives have also been reported to show a wide spectrum of biological activities, including antimicrobial (Menozzi et al., 2004), anti-inflammatory (Gomez et al., 2007), anti-tumor (Lin et al., 2007).
QSAR is a predictive tool that uses computer-aided models for the preliminary evaluation of the activity of chemical compounds (Belaidi et al., 2000; Boudergua et al., 2019). Drug-likeness is a qualitative concept used in drug design; this parameter is estimated from the molecular structure before the substance is even synthesized and tested (Alloui et al., 2018; Zerroug et al., 2019).
The main objective of this work is to build a reliable QSAR model and to predict the activity of anti-mycobacterium tuberculosis for other molecules whose activity is not known.
2 Computational methods
All calculations were performed using the HyperChem software 8.0.6 (Hyperchem, 2008) and the Gaussian 09 program package The geometries of the 1,2-diazole derivatives were fully optimized using PM3, DFT/B3LYP with the 6-31G and 6-31G++ (d, p) basis sets in Gaussian 09 (Frisch et al., 2009). The calculation of properties QSAR was performed using the QSAR Properties module (version 8.0.6), implanted in HyperChem. The software MarvinSketch (Marvinsketch, 2017) was used to calculate logD values.
MLR analysis of the molecular descriptors was carried out using the stepwise strategy in SPSS Version 20 for Windows (SPSS, 2018). The study of MLR (descendant) based on the elimination of descriptors until a valid model was obtained and the MLR procedures based on the forward selection and backward elimination methods were employed to determine the best regression models. MLR statistical techniques used to study the relationship between one dependent variable (pIC50) of 33 molecules and several independent variables (descriptors).
3 Results and discussion
3.1 Geometric and electronic structure of 1,2-diazole
In this section, we report the structural and electronic parameters (distance, valence angle and charge) of the conformation of the 1,2-diazole core in detail (Fig. 1).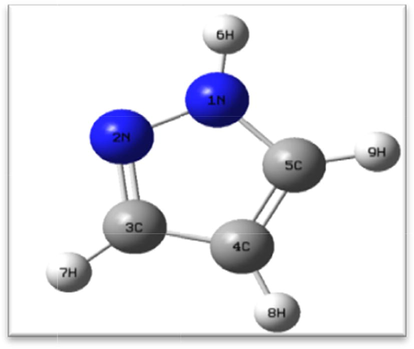
3D structure of 1,2-diazole (GaussView 5.0).
The purpose of this study was to calculate the structural and electronic characteristics using different calculation methods and determine the similarity between the calculated and experimental results (Belaidi et al., 2015). The optimized geometric and electronic parameters of imidazolidine-2,4-diazole obtained using PM3, Ab initio/HF and DFT are listed in Table 1. The atoms numbering in the tables is the same as that in Fig. 1.
Semi-empirical
Ab initio/HF
DFT/B3LYP
EXP. (Nygaard et al., 1974)
PM3
6-31G
6-31G++(d, p)
6-31G
6-31G++(d, p)
Bond length (Å)
N1–N2
1.35
1.35
1.32
1.37
1.35
1.35
N2–C3
1.35
1.31
1.30
1.34
1.33
1.33
C3–C4
1.41
1.41
1.41
1.41
1.41
1.41
C4–C5
1.39
1.36
1.36
1.38
1.38
1.37
C5–N1
1.39
1.35
1.34
1.36
1.35
1.36
Valence angle (°)
N1–N2–C3
107.18
105.25
105.14
103.83
104.18
104.10
N2–C3–C4
109.00
111.09
111.54
111.81
111.90
111.90
C3–C4–C5
106.74
104.88
103.91
105.30
104.53
104.50
C4–C5–C1
105.88
106.59
106.61
106.27
106.15
106.40
C5–N1–N2
111.18
112.15
112.77
112.76
113.21
113.00
Mulliken atomic charge
Ab initio/HF
DFT/B3LYP
6-31G
6-31G++ (d, p)
6-31G
6-31G++ (d, p)
N1
−0.6542
−0.2629
−0.5087
−0.1580
N2
−0.2627
−0.2222
−0.2187
−0.1580
C3
0.0262
−0.0784
0.0183
−0.2123
C4
−0.3540
−0.1608
−0.2232
0.0874
C5
0.1465
−0.0741
0.1293
−0.2567
For the bond lengths, the difference between the theoretical results and the experimental values varies from 0.02 Å to 0.07 Å. For the valence angles, the differences range from 0.57° to 10.56°. The results obtained by the DFT method using the 6-31G++ (d, p) basis set were most similar to the experimental results (Nygaard et al., 1974); thus, the DFT method was concluded to be the best method for further study of the structural and electronic properties of 1,2-diazole and its derivatives.
From DFT/6-31G++ (d, p), N1, N2 and C3 and C5 atoms (Table 1) have negative Mulliken charges that lead to electrophilic substitution; while the C4 atom has a positive charge that leads to a preferential nucleophilic site attack.
3.2 Study of the QSAR properties of the 1,2-diazole derivative series
Using the software HyperChem 8.03, we determined seven physicochemical properties for a series of 33 1,2-diazole derivatives (Table 2) (Monga et al., 2014; Valarmathy et al., 2010; Ali et al., 2007). The properties evaluated were surface area (SAG), molar volume (V), hydration energy (HE), octanol/water partition coefficient (log P), molar refractivity (MR), polarizability (Pol), and molecular weight (MW) (Table 3). The polarizability values were generally proportional to the surface area and volume values. The polarizability and molar refractivity increased with the size and molecular weight of the pyrazole derivative. This result was consistent with the Lorentz–Lorenz formula, which relates Pol, MR, and molecular size (Mignani, et al., 2014). As shown in Table 4, compound 21, which is functionalized with a bulky radical, has high Pol (53.09 Å3) and MR (148.35 Å3) values, along with a high volume and area (1252.18 Å3 and 688.33 Å2) respectively. In contrast, compound 1 is the smallest molecule in the series, and shows low Pol (33.93 Å3) and MR (95.31 Å3) values. NBA: number of hydrogen bond acceptors; NBD: number of hydrogen bond donors; NBR: number of rotatable bonds; TPSA: total polar surface area; pIC50: −log (IC50), where IC50 is the half maximal inhibitory concentration; N: number of heavy atoms.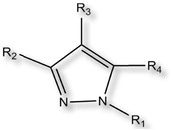
Compound
R1
R2
R3
R4
1
H


2
CH3


3
CH3


4


5


6


7


8

H

9

H

10

H

11

H

12


H

13


H

14


H

15


H
16


H

17
H

H

18

H

19
H

20

H

21

H

22

H

23

H

24


H

25

H

26


H

27

H

28


H

29


H

30

H

31


H

32

H

33


H
Compound
Molecular surface area (Å2)
Molar volume (Å3)
Molecular weight (amu)
Polarizability (Å3)
Hydration energy (kcal/mol)
Refractivity (Å3)
Log P
Log D
1
502.30
840.79
288.35
33.93
−7.63
95.31
1.99
3.02
2
588.54
1003.20
330.43
39.44
−2.82
108.77
2.21
3.99
3
631.42
1106.90
433.34
47.45
−4.81
134.22
1.95
6.45
4
599.44
1074.39
417.89
45.82
−5.00
131.05
2.43
5.38
5
652.84
1171.25
520.22
51.22
−3.93
143.78
0.90
7.80
6
585.49
1001.2
362.43
43.40
−6.12
127.15
1.03
5.41
7
561.27
963.07
371.27
39.63
−3.56
109.64
1.46
4.17
8
595.68
1038.93
397.45
42.47
−15.31
118.71
0.69
2.02
9
558.46
976.94
383.43
40.64
−18.92
113.95
0.66
1.87
10
546.75
960.19
367.43
40.00
−13.76
112.34
1.68
2.18
11
594.05
1037.61
396.47
43.19
−16.80
120.17
0.12
1.86
12
602.13
1054.53
413.45
43.11
−21.24
120.32
−0.33
1.72
13
568.02
940.99
339.35
35.18
−8.89
98.48
−3.13
2.57
14
607.41
1015.79
369.38
37.65
−9.25
104.85
−4.13
2.41
15
645.81
1091.11
399.40
40.12
−9.84
111.23
−5.12
2.25
16
574.40
970.95
359.38
38.89
−7.65
110.30
−−2.06
3.72
17
527.96
869.54
317.35
35.13
−10.38
100.73
–1.73
4.01
18
620.28
1127.96
435.97
49.44
−10.53
138.22
3.19
7.02
19
602.591
1094.48
419.52
47.42
−10.59
133.63
2.81
6.56
20
671.11
1192.79
447.55
50.62
−12.73
141.97
1.27
5.59
21
688.33
1252.18
447.58
53.09
−13.35
148.35
0.28
5.43
22
642.49
1188.04
485.43
52.49
−9.03
145.43
1.96
6.88
23
615.61
1050.98
371.44
42.51
−10.18
121.40
0.36
4.32
24
638.70
1094.50
405.88
44.44
−9.90
126.12
0.14
4.93
25
618.28
1068.27
387.44
43.15
−11.84
123.01
−0.66
4.02
26
648.45
1107.98
416.48
44.36
−15.02
126.62
−4.32
4.17
27
660.25
1129.85
401.46
44.99
−11.33
127.78
−0.63
2.45
28
644.81
1103.65
401.44
44.17
−13.52
123.12
−0.75
3.05
29
669.76
1146.93
435.89
46.10
−13.21
127.84
−0.97
3.05
30
692.54
1187.84
470.33
48.03
−12.95
132.56
−1.20
3.56
31
653.57
1120.47
417.44
44.81
−17.44
124.73
−1.78
2.14
32
679.45
1160.63
446.44
46.01
−18.40
128.34
−5.43
3.22
33
691.95
1181.43
431.47
46.65
−14.96
129.50
−1.74
2.29
Comp.
Lipinski rule
Veber rule
Lipophilicity Indices
MW
log P
NHD
NHA
Violations of rule
NBR
TPSA
LE
LLE
pIC50
N
<500
<5
<5
<10
<10
<140
1
288.35
1.99
1
4
0
3
42.22
0.309
2.8
4.79
22
2
330.43
2.21
0
4
0
3
33.43
0.268
2.58
4.79
25
3
433.34
1.95
0
4
0
4
33.43
0.251
3.44
5.39
30
4
417.89
2.43
0
4
0
4
33.43
0.245
2.66
5.09
29
5
520.22
0.90
0
4
1
4
33.43
0.203
3.89
4.79
33
6
362.43
1.03
0
4
0
4
33.43
0.254
4.06
5.09
28
7
371.27
1.46
0
4
0
3
33.43
0.285
3.63
5.09
25
8
397.45
0.69
3
9
0
7
117.58
0.280
4.91
5.60
28
9
383.43
0.66
4
9
0
6
128.57
0.281
4.76
5.42
27
10
367.43
1.68
3
8
0
6
108.34
0.317
4.22
5.90
26
11
396.47
0.12
5
9
0
6
134.37
0.260
5.08
5.20
28
12
413.45
−0.33
4
10
0
7
137.81
0.270
5.93
5.60
29
13
339.35
−3.13
0
7
0
4
87.73
0.201
6.73
3.60
25
14
369.38
−4.13
0
8
0
5
96.97
0.171
7.43
3.30
27
15
399.40
−5.12
0
9
0
6
106.20
0.236
10.02
4.90
29
16
359.38
−2.06
0
6
0
3
78.20
0.168
5.06
3.00
25
17
317.35
−1.73
1
5
0
3
70.22
0.267
5.93
4.20
22
18
435.97
3.19
2
4
0
5
47.86
0.242
2.01
5.20
30
19
419.52
2.81
2
4
0
5
47.86
0.242
2.93
5.20
30
20
447.55
1.27
2
6
0
7
66.33
0.235
4.11
5.38
32
21
447.58
0.28
2
7
0
8
75.56
0.215
4.96
5.24
34
22
485.43
1.96
1
4
0
6
45.06
0.252
3.82
5.78
32
23
371.44
0.36
2
5
0
4
64.93
0.230
4.24
4.60
28
24
405.88
0.14
2
5
0
4
64.93
0.202
4.76
4.90
29
25
387.44
−0.66
3
6
0
4
85.16
0.222
5.26
4.60
29
26
416.48
−4.32
2
8
0
5
110.75
0.234
9.52
5.20
31
27
401.46
−0.63
2
6
0
5
74.16
0.228
5.53
4.90
30
28
401.44
−0.75
2
7
0
4
94.89
0.200
5.05
4.30
30
29
435.89
−0.97
2
7
0
4
94.89
0.248
6.47
5.50
31
30
470.33
−1.20
2
7
0
4
94.89
0.240
6.7
5.50
32
31
417.44
−1.78
3
8
0
4
115.12
0.221
6.68
4.90
31
32
446.44
−5.43
2
10
0
5
140.12
0.233
10.93
5.50
33
33
431.47
−1.74
2
8
0
5
104.12
0.227
6.94
5.20
32
Lipophilicity is a property that has a major effect on the solubility, absorption, distribution, metabolism, and excretion of a molecule, as well as its pharmacological activity. For good oral bioavailability, log P should be greater than zero and less than 3 (0 < log P < 3). Drugs with excessively high log P values have low solubility, while those with low log P values have difficulty penetrating lipid membranes (Gargadennec et al., 2005). The log P values of the compounds in the studied series range from −5.43 to 3.19. Compound 32 has the lowest log P value (−5.43), followed by compound 15 (−5.12). However, low partition coefficient values correspond to better gastric tolerance. Compounds 4 and 19, which have the highest values of 2.43 and 2.81, respectively, could depend on plasma proteins.
3.3 Drug-likeness filters and multi-parameter optimization (MPO)
3.3.1 Rules of thumb
We used various ‘rules of thumb’ in MPO methods, namely, the Lipinski (Lipinski et al., 1997), Veber rules (Veber et al., 2002), to study the oral bioavailability of the series of diazole derivatives. We also considered the oldest and most commonly used metrics, which are the ligand efficiency (LE) and the lipophilic efficiency of the ligand (LLE) (Segall, 2012) (Table 4).
The Lipinski and Veber rules are used to identify compounds that could pose absorption and permeability problems, with the Lipinski rule being used most often to characterize drug-like compounds. Compounds that do not exhibit at least two of the criteria of the Lipinski rules are very likely to present absorption or permeability issues. Lipinski's rules are: Molecular Weight (MW) < 500 Da, water partition coefficient (log P) < 5, Number of Hydrogen Bond Donors (NHD) < 5, number of Hydrogen Bond Acceptors (NHA) < 10. Veber rules: Rotatable bonds (NBR) < 10 and Polar surface area (TPSA) < 140 Ǻ2.
The parameters relevant to the Lipinski rule are shown in Table 4. All the studied compounds had lipophilicity values of log P less than 5 (−5.43 to 3.19); therefore, they should present acceptable solubility in aqueous and lipid solutions. A negative value of log P indicates that a compound is very hydrophilic, and should have good solubility in water, gastric tolerance, and elimination by the kidneys. Conversely, a positive value of log P indicates that the compound is highly lipophilic, and should exhibit good permeability across the biological membrane, binding to plasma proteins, and elimination by metabolism, but low aqueous solubility and gastric tolerance (Ertl et al., 2000). Among the pyrazole derivatives in our series, compounds 15, 26, and 32 have log P values of −5.12, −4.32, and −5.43, respectively, suggesting that these compounds would have good solubility and gastric tolerance. Compound 18, which has the maximum log P value among the series (3.19), would be assumed to have good permeability across biological membranes. All the studied compounds had less than 10 hydrogen acceptors (O) and less than 5 hydrogen donors (OH, NH). Some compounds had molecular weights of less than 500 Da, indicating that they could easily cross cell membranes. The total number of violations of the Lipinski rule was tabulated for each compound; all compounds have either zero or one violation. Thus, all the compounds meet the Lipinski rule (rule of five), suggesting that theoretically, they would not present oral bioavailability issues.
In terms of Veber’s rule, the number of rotational bonds is less than 10 for all the compounds. The low number of rotational bonds (reduced flexibility) in the test compounds indicates that these ligands would change confirmation only slightly during binding to a protein. All compounds except for 32 have a PSA value lower than 140 Å2, which predicts good oral bioavailability and the transport through membranes.
The LE and LLG values are also collected in Table 5. The ligand (LE) efficiency decreases with increasing number of heavy atoms. Obtaining high ligand efficiency requires compounds with few heavy atoms; this can be explained by the correlation between the size of the compound and its physicochemical properties. It has been suggested that one typical factor contributing to the decreased LE in larger ligands could be the less favorable binding entropies for larger and more flexible ligands (Loving et al., 2012). For example, Table 5 clearly shows that the compounds 1, 10, and 17, which have few heavy atoms, showed efficiencies of 0.309, 0.317, and 0.267, respectively, while compound 21, which has the greatest number of heavy atoms (34), exhibited a low ligand efficiency value of 0.215, and may have poor physicochemical and ADME (adsorption, distribution, metabolism, and excretion) properties. On the other hand, the efficiency varied proportionally with the values of the lipophilicity index pIC50.
Model
PRESS
SSY
PRESS/SSY
SPRESS
r2 cv
r2 adj
6PE
1
2.540
11.888
0.213
0.311
0.773
0.746
0.169
LLE provides a means of assessing the affinity of a compound for its target relative to its lipophilicity. The aim is to increase the affinity without increasing lipophilicity at the same time. Since lipophilicity is the main promissory factor for compounds, LLE-optimized compounds should be more selective. It has been suggested that LLEs in the range 5–7 or even higher should be targeted (Hopkins et al., 2004). If LipE is between 5 and 7 or more than 7, the optimized compounds will be more selective (Pliska et al., 1996). The LLE values of the compound in this series were found to range between 2.01 and 10.93. For example, compounds 11, 13, and 33have LLE values of 5–7 (5.08, 6.73, and 6.94, respectively), indicating that these compounds have been successfully optimized. On the other hand, the LLE values of the compounds 2, 7, and 18are all less than 5 (2.58, 3.63, and 2.01, respectively). In these cases, the affinity gain was accompanied by an increase in lipophilicity, making them less optimal than the compounds above.
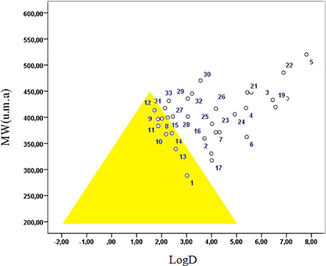
3.3.2 Golden Triangle
The Golden Triangle is a visualization tool that was developed using in vitro permeability, in vitro clearance, and computational data to aid medicinal chemists in achieving metabolically stable, permeable, and potent drug candidates. Analysis of two or more orthogonal trends, such as permeability and clearance, is known to be an extremely effective strategy for balancing and optimizing multiple properties. In particular, molecular weight and log D impact potency-efficiency calculations, allowing potency, clearance, and permeability to be optimized simultaneously (Johnson et al., 2009).
Log D and molecular weight (MW) have been identified as properties that show correlations with permeability and stability. Using large data sets, compounds with good in vitro permeability and low clearance have been found to concentrate in the area with a baseline from log D = −2.0 to log D = 5.0 at MW = 200, and a vertex between log D = 1.0 and 2.0 at MW = 450. These trends lead to a triangle-shaped area known as the Golden Triangle; molecules within this area are low clearance and good permeability (Fig. 2).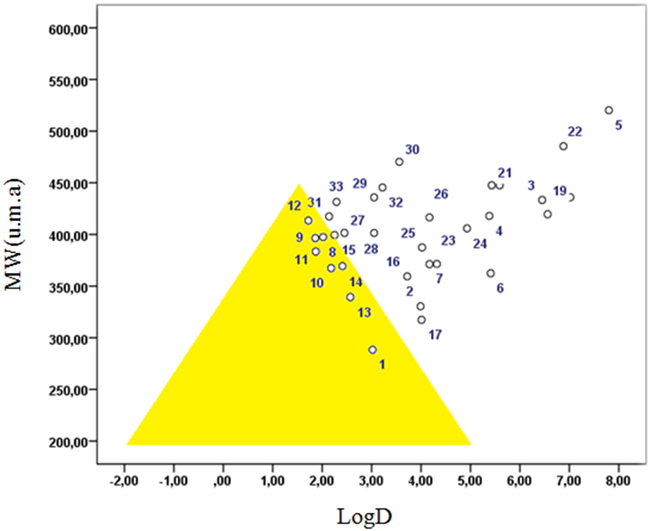
Golden triangle: In vitro permeability and clearance trends across MW and log D.
Johnson and co-workers reported that molecular weight (MW) and lipophilicity (log D at pH 7.4) can be used as surrogates of many different molecular descriptors; this fact has been used to develop the useful Golden Triangle visualization tool. Compounds that reside inside the Golden Triangle are more likely to be both metabolically stable and to possess good membrane permeability than those outside. The Golden Triangle (Fig. 2) shows that compounds 1, 4, 8, 10, 11, 12, 13, and 14 lie inside the triangle, and thus should show good permeability and clearance (Beale et al., 2010). In general, compounds with lower log D and higher molecular weight molecules fail due to low permeability, while higher log D and higher MW compounds fail due to elevated in vitro clearance (Johnson et al., 2009).
3.4 Quantitative studies of structure–activity relationships
3.4.1 Construction of the QSAR model
The best QSAR model was develop to explain the correlations between the physicochemical parameters and the biological activities (pIC50 values) of the 1,2-diazole derivatives. Various physical and chemical properties, known as physicochemical descriptors, as well as the Lipinski and Veber parameters were used as independent variables, and were correlated with the biological activities of pyrazole derivatives using multiple linear regression analyzes (MLR) to generate the QSAR model. Several QSAR equations were tested, and the best QSAR models were selected on the basis of various statistical parameters, namely, the correlation coefficient R, which measures the degree of linear association between two variables; the squared correlation coefficient (R2 > 0.6), which is a relative measure of quality of fit; the standard error of the estimate, which represents an absolute measure of the quality of fit; and Fischer’s value (F). F is the Fisher ratio, which reflects the ratio of the variance explained by the model to the variance due to the error in the regression. High F values indicate that the model is statistically significant (Sanmati et al., 2012). The most statistically significant correlation generated after multiple regression analysis using the software SPSS is given below, along with the relevant statistical parameters:
The values of the variance of the fractions can range between 0 and 1 Only QSAR models with R2 > 0.6 were considered for validation. For example, in the correlation above, the values R = 0.887 and R2 = 0.786 indicated a strong correlation between the different parameters (independent variables) and the inhibitory activity of the compound towards enoyl acyl carrier protein reeducates. The calculated F value of the generated QSAR model exceeded the F value tabulated by a large margin, indicating the significance of the regression. In addition, the F-value was found to be statistically significant at the 95% level for this model. The positive value of the quality factor (Q) for this OSAR model suggested its high predictive power and its lack of adaptation. The low standard deviation also demonstrated the accuracy of this model.
In the model in Eqn (1) the positive coefficient of log P indicates that increased lipophilicity (hydrophobicity) of the molecules correlates with increased biological activity, while the negative coefficient of the log D term indicates that more positive molar refractivity values lead to a decrease in the biological activity; i.e., the pyrazole nucleus should be functionalized with one or the other electron or free electronic pairs.
3.4.2 Model validation
The predictive powers of the equations were validated using the “leave-one-out” (LOO) (Tetko et al., 2001) cross-validation method. Cross-validation is a convenient and reliable way to test the significance of a model. Therefore, to validate the final models individually generated for different activities properties, a one-out method was used to perform cross-validation In order to test the validity of the predictive power of the selected MLR model (eq. log (l/IC50)), the LOO technique was used.
The developed model was validated by calculating the following statistical parameters: PRESS (sum of predicted residual squares), SSY (sum of squares of response value), and R2CV (global predictive ability), adjusted R2, PE (predictive error correlation coefficient), and SPRESS (prediction uncertainty); the values of these parameters are given in (Table 5).
PRESS is an important cross validation parameter because it provides a good approximation of the actual predictive error of the model. A PRESS value that is lower than the SSY value indicates that the predictions of the model are better than chance, and can be considered statistically significant. The obtained PRESS value of 2.540 indicates that the model is statistically significant. In addition, for a reliable QSAR model, the PRESS/SSY ratio should be less than 0.4 (Podunavac-Kuzmanovi et al., 2009). As shown in Table 5, the ratio for the developed model is 0.213. An indication of the performance of the model can be obtained from its R2CV value (the overall prediction capability). To ensure good performance of the QSAR model, high R2CV and R2adj values are essential; values of 0.773 and 0.746 were obtained for the present QSAR model, respectively. SPRESS (predictive uncertainty) is another important parameter for the determination of the uncertainty in the prediction. Lower SPRESS values indicate better predictive power. The low value of 0.311 indicates the predictive ability of this model is good. The predictive error of the correlation coefficient (PE) also evaluates the predictive power of a model. The present model satisfies the condition R > 6PE, and can therefore be said to have good predictive power. The experimental, predicted, and residual ENR inhibitory activity of 1,2-diazole and its derivatives were determined using the software SPSS, and are listed in Table 6.
Number
pIC50/Exp.
pIC50/Predict.
Resid.
1
4.79
4.8208
−0.30780
2
4.79
5.0518
−0.28178
3
5.39
5.1205
0.26955
4
5.09
5.4460
−0.35599
5
4.79
4.7457
0.44340
6
5.09
4.8911
0.19886
7
5.09
4.8033
0.28666
8
5.60
5.4046
0.19540
9
5.42
5.2875
0.13247
10
5.20
5.3172
−0.11723
11
5.60
5.2209
0.37911
12
3.60
3.4739
0.12609
13
3.30
3.4068
−0.10680
14
3.00
3.8669
−0.86692
15
4.20
3.5975
0.60254
16
5.20
5.4743
−0.27432
17
5.20
5.3360
−0.13600
18
5.38
5.3746
0.00539
19
5.24
5.3109
−0.07086
20
5.78
5.3578
0.44219
21
4.60
4.7917
−0.19169
22
4.90
4.7123
0.18774
23
4.90
5.1705
−0.27048
24
4.30
4.8350
−0.53495
25
4.90
4.8061
0.09395
26
5.20
4.9265
0.38431
Fig. 3 shows a plot of the linear regression between the predicted and experimental values of biological activity of the 1,2-diazole derivatives. The plot shows a good correlation of R2 = 0.786. The evaluation set has a good distribution along the range of values of the training set. Thus, the QSAR model developed in the current study can be successfully applied to predict the inhibitory activities of this series of molecules against mycobacterium tuberculosis.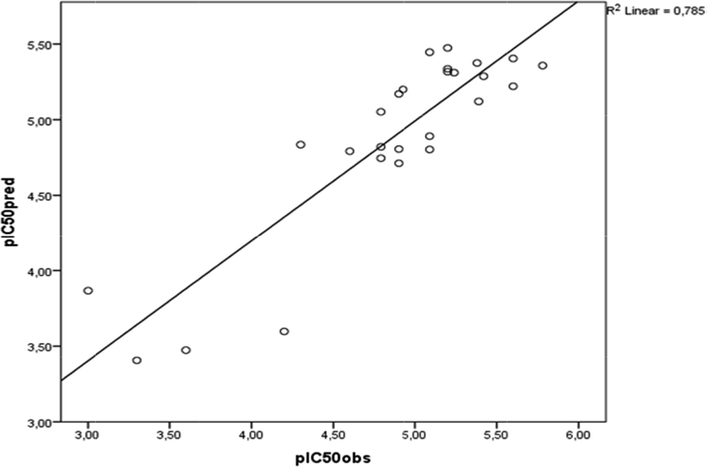
Linear regression of the plot of the predicted values against the experimental values of log (I/IC50).
To investigate the presence of systematic error in the developed QSAR model, the residuals of the predicted values of the biological activity (log(I/IC50))were plotted against the experimental values, as shown in Fig. 4. The propagation of the residuals on both sides of zero indicates that no systemic error exists.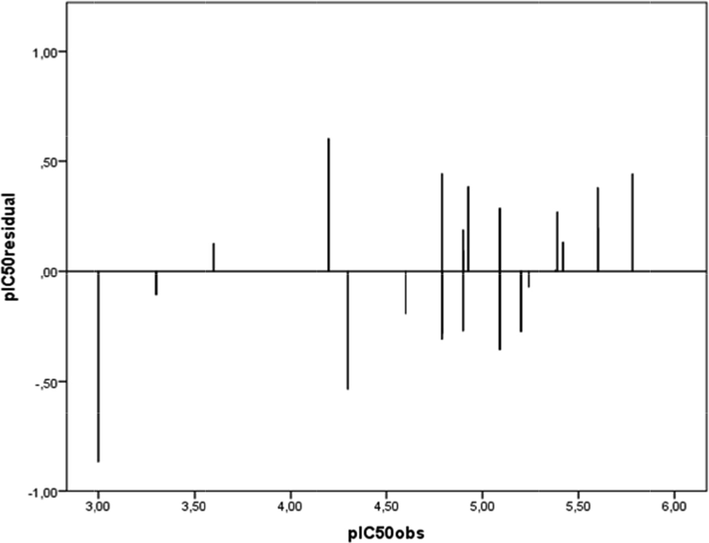
Plot of the residual values relative to the experimentally observed values.
3.5 Identification of leads
First, it is necessary to identify which of the compounds obtained at the end of a screening campaign represent lead compounds relevant to the pathology to be treated (Corinne, 2008). A “lead” molecule is a molecule that will interact with the target to inhibit, activate, or modify its activity in some way. In order for a molecule to become a drug candidate, it must additionally possess ADME-T (absorption, distribution, metabolism, excretion, and toxicity) properties suitable for use in humans or animals. The best leads will then be optimized, taking care to preserve their activity and drug-likeness while trying to improve their affinity, selectivity, and permeability. In our case, compounds 11 and 12 were identified as lead molecules. These compounds present both significant activity and optimal physico-chemical and biological properties, which suggests that these molecules will act as effective drugs with low toxicity.
4 Conclusion
The present study was performed QSAR analysis to the activity of a series of 1,2-diazole derivatives. Evaluation of the Lipinski rule criteria of the 1,2-diazole derivatives indicated that, theoretically, they should not present oral bioavailability issues. All compounds of the series except compound 32 also satisfy the first rule of Veber, i.e., they contain less than 10 rotatable bonds. Compound 10 has the highest LE (ligand efficiency) value of 0.317, which suggests that it has good physico-chemical and ADME properties. Compound 15 had the most optimal LipE value in the dataset (10.02). Compounds 1, 4, 8, 10, 11, 12, 13, and 14 were located in the Golden Triangle, suggesting that these derivatives should have good permeability and clearance. Different physicochemical parameters investigate the biological were evaluated, and it was found that the partition coefficient (log P), molar refractivity (MR), and distribution coefficient(logD) can be used to successfully model anti-tubercular activities of the derivatives. Based on the different selection methods applied to the studied compounds, two molecules in the series with good ADME properties were identified as potential drug candidates.
Declaration of Competing Interest
The authors declare that they have no known competing financial interests or personal relationships that could have appeared to influence the work reported in this paper.
References
- Synthesis, structural activity relationship and anti-tubercular activity of novel pyrazoline derivatives. Eur. J. Med. Chem.. 2007;42:268-327.
- [Google Scholar]
- Imidazole derivatives as angiotensin II AT1 receptor blockers: benchmarks, drug-like calculations and quantitative structure-activity relationships modeling. Chem. Phys. Lett.. 2018;696:70-78.
- [Google Scholar]
- Organic Medicinal and Pharmaceutical Chemistry. New York, USA: Lippincott Williams and Wilkins; 2010.
- Computational methods applied in physical-chemistry property relationships of thiophene derivatives. J. Comput. Theor. Nanosci.. 2015;12:1737-1745.
- [Google Scholar]
- Contribution à l’étude du contrôle stéréochimique dans les macrolides a 16 chaînons par la mécanique moléculaire. J. Soc. Alg. Chim.. 2000;10:221-232.
- [Google Scholar]
- QSAR modeling and drug-likeness screening for antioxidant activity of benzofuran derivatives. J. Mol. Struct.. 2019;1189:307-314.
- [Google Scholar]
- Recherche d’inhibiteurs de haute affinité de l’ADN polymérase bêta par criblage virtuel et RMN. Université Toulouse III-Paul Sabatier; 2008. (Ph.D. Thesis)
- Fast Calculation of molecular polar surface area as a sum of fragment-based contributions and its application to the prediction of drug transport properties. J. Med. Chem.. 2000;43(20):3714-3717.
- [Google Scholar]
- Gaussian 09, Revision B.01. Gaussian Inc.; 2009.
- log P estimation of 1,2-Dithiole-3-thiones and 1,2-dithiole-3-ones: a comparison of experimental and calculative approaches. Pharma. Res.. 2005;22(6):875-882.
- [Google Scholar]
- SAR studies of 1,5-diarylpyrazole-based CCK1 receptor antagonists. Bioorg. Med. Chem. Lett.. 2007;17:6493.
- [Google Scholar]
- Ligand efficiency: a useful metric for lead selection. Drug Discov. Today. 2004;9:430.
- [Google Scholar]
- Hyperchem (Molecular Modeling System). Hypercube, 2008. Inc, Gainesville, FL, USA.
- A review on pyrazole derivatives of pharmacological potential. J. Pharm. BioSci.. 2013;3:114-123.
- [Google Scholar]
- Using the golden triangle to optimize clearance and oral absorption. Bioorg. Med. Chem. Lett.. 2009;19:5560-5564.
- [Google Scholar]
- Design, synthesis, and evaluation of 3,4-disubstituted pyrazole analogues as anti-tumor CDK inhibitors. Bioorg. Med. Chem. Lett.. 2007;17:4557.
- [Google Scholar]
- Experimental and computational approaches to estimate solubility and permeability in drug discovery and development settings. Adv. Drug Deliv. Rev.. 1997;23:3-25.
- [Google Scholar]
- Computational approaches for fragment-based and de novo design. Curr. Top. Med. Chem.. 2012;10:14-32.
- [Google Scholar]
- Marvinsketch, 20107. DISPLAYING and characterizing chemical structures, substructures, and reactions, Marvin 17.1.2. ChemAxon (http://www.chemaxon.com).
- Synthesis, antimicrobial activity and molecular modeling studies of halogenated 4-[1H-imidazol-1-yl(phenyl)methyl]-1,5-diphenyl-1H-pyrazoles. Bioorg. Med. Chem.. 2004;12:5465.
- [Google Scholar]
- Geometrical Lorentz violation and quantum mechanical physics. Quantum Matter. 2014;3:219.
- [Google Scholar]
- Synthesis and evaluation of new chalcones, derived pyrazoline and cyclohexenone derivatives as potent antimicrobial, antitubercular and antileishmanial agents. Med. Chem. Res.. 2014;23:2019-2032.
- [Google Scholar]
- Microwave spectra of isotopic pyrazoles and molecular structure of pyrazole. J. Mol. Struct.. 1974;22:401-413.
- [Google Scholar]
- Lipophilicity in Drug Action and Toxicology. Germany: Wiley-VCH; 1996.
- QSAR analysis of 2-amino or 2-methyl-1-substituted benzimidazoles against Pseudomonas aeruginosa. Int. J. Mol. Sci.. 2009;10:1670.
- [Google Scholar]
- QSAR analysis on 5-disubstituted-4,5-dihydropyrazole-1-carbothioamides as epidermal growth factor receptor (EGFR) kinase inhibitors. J. Chem. Pharm. Res.. 2012;4:3215-3223.
- [Google Scholar]
- Multi-parameter optimization: identifying high quality compounds with a balance of properties. J Curr. Pharm. Des.. 2012;18:1292.
- [Google Scholar]
- SPSS Inc., 444 North Michigan Avenue, Suite 3000, Chicago, Illinoi, 60611, USA. 2018
- Estimation of aqueous solubility of chemical compounds using E-state indices. Chem. Inf. Comput. Sci.. 2001;41:1407-1421.
- [Google Scholar]
- Synthesis, antitubercular, anticonvulsant and antiinflammatory activities of some novel 2-pyrazoline derivatives. Orient. J. Chem.. 2010;26:1049-1054.
- [Google Scholar]
- Molecular properties that influence the oral bioavailability of drug candidates. J. Med. Chem.. 2002;45:2615-2623.
- [Google Scholar]
- Virtual screening in drug-likeness and structure/activity relationship of pyridazine derivatives as anti-Alzheimer drugs. J. King Saud Univ. Sci.. 2019;31:595-601.
- [Google Scholar]


