

Translate this page into:
Molecular identification of herbal species belonging to genus Piper within family Piperaceae from northern Peninsular Malaysia
⁎Corresponding author. darlinamdn@usm.my (Darlina Md. Naim)
-
Received: ,
Accepted: ,
This article was originally published by Elsevier and was migrated to Scientific Scholar after the change of Publisher.
Peer review under responsibility of King Saud University.
Abstract
Species identification technology (i.e. DNA barcoding) has been recognized as an important and reliable tools, although the effectiveness of using a single universal barcode marker for plants is still questionable. The present study reports a molecular identification method to discriminate 11 plant species within genus Piper that extensively utilized in traditional healing practices in Malaysia. The plants were sampled from six locations that represents three states in northern Peninsular of Malaysia, namely Perlis, Kedah and Penang. Species discrimination was conducted using BLASTn analysis and phylogenetic inference based on Maximum Likelihood and Neighbour-Joining method for two target genes, rbcL and rpoC1. The reliability of phylogenetic tree regenerations was assessed using Disparity Index analysis. Estimation of evolutionary divergence between all samples was employed based on Maximum Composite Likelihood with Kimura 2-parameter model. The present study revealed that the DNA identification method has successfully discriminated all samples to species level and that the rbcL is the reliable marker for identification. The outcome of the present study gives a significant information on the DNA barcoding of plants within genus Piper.
Keywords
Piper
Genetic distance
rbcL
rpoC1
Phylogenetic
DNA barcode

1 Introduction
Existing taxonomic identification of plants group is mainly morphological based. Nevertheless, this technique has many restrictions when trying to discriminate plants during various stages of their development or when determining processed or fragmentary remains. The rapidly evolving mitochondrial genes, intersperse with highly conserved regions can be retrieved through Polymerase Chain Reaction (PCR, Mullis, 1990). Hebert et al. (2003) signified that the 5′ end region of mtDNA cytochrome c oxidase subunit I (COI) is eminently suitable for distinguishing complex species across diverse taxa in the animal kingdom, inaugurating it as the “DNA barcode” for animal identifications (Ward et al., 2005). However, the utilization of COI as a universal plant barcode does not declare any success story due to the commonly low nucleotide substitution’s proportion in the mitochondrial DNA of plants (Hollingsworth et al., 2011, Hollingsworth, 2011). Additionally, the structure of mitochondrial genome in plants has changed rapidly, thus the existence of a universal intergenic spacer at the species level will be precluded (Kress et al., 2005). Based on many valid studies done on plastid sequences in plants, several genes have been recommended as a feasible barcode marker (Pennisi, 2007; Maloukh et al., 2017). Such recommended genes are ribulose-1, 5-biphosphate carboxylase/oxygenase large subunit (rbcL) and rpoC1. The rbcL region of the plastid genome is the highly sequenced locus for molecular taxonomic study at a species level in plants (Maloukh et al., 2017). Several chloroplast gene regions, for example, maturase K (matK) and internal transcribed spacer (ITS) of a ribosomal nuclear DNA were also widely used and considered as a core barcodes for plants (Schori and Showalter, 2011).
Piper are important medicinal plants used in various systems of medicine (Kumar et al., 2011). They are distributed pantropically, however, their exact distribution is not easy to ascertain particularly due to the high number of taxa (Palchetti et al., 2018). The crucial contributions of medicinal plants in traditional healing systems have largely recorded in the literature, and it is not surprising that many people from developing country have remained to depend on medicinal plants for principal health care and home medication. Throughout Malaysia, medicinal plants are widely used in the form of packaged herbal products prepared and manufactured by small and medium-sized industry as well as the pharmaceutical industry. (Ahmad and Othman, 2015; Aziz et al., 2015). Specifically, most of the traditional healers in Malaysia frequently formulate variety of herbal and/or medicinal plants in an unprocessed/raw form for diseases such as skin disease, high cholesterol level, malaria, diarrhoea; high blood pressure, respiratory system and cancer (Duñg and Loi, 1991; Brinkhaus et al., 2000; Gul et al., 2012; Kadir et al., 2014). Consequently, the herbal fabrication has been selected by Malaysia as the primary Entry Point Project (EPP1), intend for a development of a high-value products (Ahmad and Othman, 2015).
Presently, taking into considerations of scientific concern, consumer demands encourages the expansion of dietary supplements and new herbal/plant-based medications. The utilization of herbal/plant-based dietary supplements and/or drugs is speedily extending in the 21st century’s health care division (Abe et al., 2013; Siew et al., 2014). There were opportunities for substitution or adulteration of the raw ingredients of the herbal products due to misidentification of plants, lack of cultivation and the long supply chain from harvesting site to market (Schori and Showalter, 2011). Using barcoding technique, the raw material used to produce herbal products can be ascertained because the substitution within certain plant families (especially Apiaceae and Piperaceae) would give a very bad effect and could be fatal. For that reason, the correct recognition of plants used for medicinal purposes in association to their naturalness and adulteration-free as well as a secure application has now progressively focused (Pang and Chen, 2014). The present study was designed to identify 11 selected plants within genus Piper commonly found in northern Peninsular Malaysia.
2 Materials and methods
2.1 Plant collections
Plant samples from genus Piper were collected randomly from natural locations that represents three states in northern Peninsular Malaysia (Fig. 1). Sampling activities were conducted for consecutively three days every month during January 2014-February 2015. The leaves of a plant were excised using scissors and then stored in a sterile polyethylene bag. All samples were labelled to avoid misidentifications before transporting to School of Biological Sciences, Universiti Sains Malaysia (USM) for storage. All plant samples were identified based on morphological and taxonomical characteristics by local taxonomist from USM. The book titled Photographic Atlas of Botany and Guide to Plant Identification authored by Castner (2005) was also used to identify all plants collected in this study (Table 1). The vernacular name of all plant samples collected were identified by local people. All the document and preserved specimens were stored in the USM’s herbarium for record and references.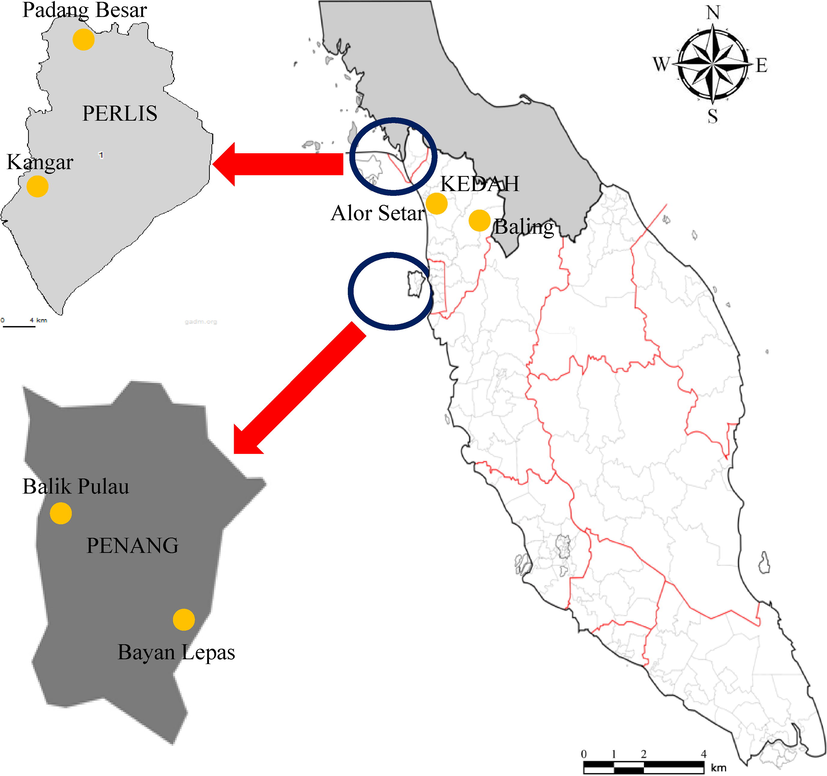
Sampling locations of all samples collected.
State
Sampling sites
Code
N
Coordinates (Lat, Long)
Alor Setar
AS1
1
6.158691,100.416365
Kedah
Alor Setar
AS2
1
6.122614,100.504717
Baling
BA1
1
5.718114,100.975084
Baling
BA2
1
5.837666,100.978502
Padang Besar
PB
1
6.664654,100.304702
Perlis
Kangar
KA1
1
6.436797,100.183371
Kangar
KA2
1
6.445838,100.174989
Balik Pulau
BP1
1
5.362395,100.208318
Penang
Balik Pulau
BP2
1
5.344791,100.233037
Bayan Lepas
BL1
1
5.293510,100.282849
Bayan Lepas
BL2
1
5.301886,100.263854
Total
11
2.2 DNA isolation and amplification
The leaves were dried in silica gel prior to DNA extraction. Approximately 300–400 mg fresh leaves were ground to a fine paste and homogenized in a DNA extraction buffer [(50 mM Tris HCL pH 8.0, 25 mM EDTA pH 8.0, 150 mM NaCl, 40.0 ml H2O) and 1 g PVP 40 mw 40 000]. Distilled water was added to the mixture up to 150 ml and HCl was used to accustom the pH to 5.0. The paste was subsequently conveyed to another sterile tube. The modified cetyl trimethylammonium bromide (CTAB) method (Cota-Sánchez et al., 2006) has been utilized for the plants total genomic DNA extraction. The purified DNA in all samples analysed was quantified using ethidium bromide (EtBr) stained band intensities against λ DNA in order to acquire a high quality DNA. This method was also used to confirm that the extracted DNA is clear from metabolites that might impede the Polymerase Chain Reaction (PCR) amplification process. The PCR method was used to amplify the target region of the gene in the nuclear or the plastid genome of plants depending on the primer pairs used. The set of primers used in the present study are 1) rpoC1-F, 5′- GGCAAAGAGGGAAGATTTCG- 3′, rpoC1-R, 5′- CCATAAGCATATCTTGAGTTGG- 3′ (Hollingsworth et al., 2009a) and 2) rbcL-F, 5′-ATGTCACCACAAACAGAGACTAAAGC-3′ (Levin et al., 2003), rbcL-R, 5′-GTAAAATCAAGTCCACCRCG-3′ (Kress et al., 2009).
The PCR reaction consisted of 10X PCR reaction buffer, 25 mM MgCl2, 1.25 mM of each dNTPs, 1 unit of Taq polymerase, 10 μM of each primer, 20 ng genomic DNA and 30 μl Milli-Q water. Thermal cycling conditions (on a T100TM Thermal Cycler; BioRad, Singapore) were 35 × [94 °C for 45 s, 40 °C − 50 °C (depends on the primer used) for 45 s, 72 °C for 1 min] and a final incubation at 72 °C for 10 min. Additional purification was performed on all samples utilizing the Qiagen DNA Mini Kit (Germany) in order to ensure the end products free from contaminants and/or other PCR suppressor). Purified PCR products were then forwarded to NHK Laboratory Inc. (Malaysia) for sequencing purposes. At NHK Laboratory, DNA sequencing was implemented using a BigDyeTM Terminator v3.1 Cycle Sequencing Kit (Applied Biosystems) and used around 20–30 ng of purified and cleaned PCR mixtures with the set of specific primer in the analysis. The end mixtures were cleaned up prior electrophoresed on an ABI PRISM 3130xl Genetic Analyzer according to the standard protocols.
2.3 Sequence alignments and analyses
The amplified sequence of rbcL and rpoC1 were blast in GenBank utilizing BLASTn analysis and implemented in the GenBank web interface (http://blast.ncbi.nlm.nih.gov). The previously published sequence of the genus Piper in GenBank was also used as a reference in this study. The sequences were selected based on the availability of voucher specimens deposited in GenBank and the length of the sequences (>300 bp). All sequences were collapsed in haplotypes implementing the Collapse software version 1.2 (Provan et al., 2005). All haplotypes were then aligned with MUSCLE (Edgar, 2004) with default parameters and all aligned sequences was then manually synchronized and trimmed in Mega X version 10.1 (Kumar et al., 2018). Alignments were then manually revised in an attempt to minimize the positional dissimilarity. All missing data and gaps within the sequences were removed.
2.4 Species partitioning and analysis of genetic divergence
Each sample was determined for correct identification and employed in the Automatic Barcode Gap Discovery method (ABGD, Puillandre et al., 2012) in an effort to analyse the species accurately. ABGD is an automatic procedure that is based on the genetic distance method to determine a pause/gap for barcode that will partitions a putative species in the dataset by confirming that intra and inter specific genetic distance do not overlap. This tool quantifies all pairwise distances and arranges the values in rank. ABGD engages a two-stage approaches which primarily fraction DNA segment into Operational Taxonomic Units (OTUs) according to a statistically deduced barcode gap (e.g. primary partitioning), and afterwards employs a second cycle of partitioning (for e.g. recursive partitioning). There are three crucial parameters in ABGD namely (1) X , relative gap width estimate, (2) minimum and (3) maximum values of prior intraspecific divergence, P that are important to determine barcode gap. In this research, the values for the prior P (prior maximum divergence of intraspecific diversity) has been setup ranging from 0.001 to 0.1 and X = 1.0. The whole data set will be interpreted as one species if the P value was set too high (Puillandre et al., 2012). The genetic distance examination was quantified based on Jukes-Cantor 69 (Jukes and Cantor, 1969) analysis and performed at the web interface (https://bioinfo.mnhn.fr/abi/public/abgd/abgdweb.html).
To retrieve the constructiveness of marker discriminatory capability, the emergence of monophyletic succession and inheritance was determined utilizing a phylogenetic tree analysis. For likelihood based analysis, the best model of substitution was resolved following the Akaike Information Criterion (AIC) and employed in MrModeltest 2.4 (Nylander, 2004). For both genes (rbcL and rpoC1), MrModelTest found the best model is the Kimura 2-parameter (Kimura, 1980). On the basis of the model, the Maximum Likelihood (ML) tree was adopted utilizing the MEGA X version 10.1 (Kumar et al., 2018) software with a Maximum Composite Likelihood (MCL) approach. The MCL is a total of related log-likelihoods in which this method was used to accurately determine the pairwise distance and related substitution parameters (Tamura et al., 2004). The evolutionary relationships of all samples were also performed employing the Neighbour Joining (NJ) approach with the same model as in ML analysis. In order to make the phylogenetic tree more comprehensive and informative, other sequences from different genera namely Peperomia tetraphylla, Zippelia begoniifolia and Verhuellia lunaria were included in the analysis for rbcL gene. However, only a single sequence (Peperomia pellucida) was included in the rpoC1 phylogenetic analysis as no reference sequences found for the genus Zippelia and Verhuellia in GenBank. Asarum caudigerum (Genebank accession no.:JF940914.1) and Asarum forbesii (Genebank accession no.:GQ436063.1) are low-growing herbs distributed mainly in Asia and were used to root the NJ and MP tree regenerations in this study. The estimate of evolutionary divergence (genetic distance, Ds) between and within samples was computed based on Maximum Composite Likelihood and implemented in MEGA X version 10.1 (Kumar et al., 2018).
In order to test the validity of phylogenetic deduction and examinations of evolutionary postulate, we conduct a Disparity Index (DI) analysis. This was implemented for all samples collected (not includes sequence retrieved from GenBank). A greater variances in base structure bias than expected will be indicated by a value more than 0 and this will be quantified on the basis of the evolutionary deviation between sequences and by chance alone. The analysis was employed in MEGA X version 10.1 (Kumar et al., 2018).
3 Results and discussion
3.1 Sampling data and sequence information
A total of 11 fresh plants from genus Piper were successfully collected from six different locations in northern Peninsular Malaysia (Fig. 1). Samples were collected from Alor Setar (n = 2) and Baling (n = 2) in Kedah, Padang Besar (n = 1) and Kangar (n = 2) in Perlis, Balik Pulau (n = 2) and Bayan Lepas (n = 2) from Penang (Table 1). Additionally, based on the selection criteria mentioned earlier, a total of 22 (rbcL) and 10 (rpoC1) sequences of the genus Piper (including outgroup sequences) were also retrieved from GenBank. The aligned sequence length varied from 488 bp (rbcL) to 418 bp for rpoC1. The rbcL gene performed a full outcome (100%) in amplification reactions, but rpoC1 gene shows only 91% successful amplification and exhibited lower reaction efficiency compared to rbcL gene. This is as expected because one sample needs approximately two trials to confirm the volume of PCR reagents (i.e., DNA template, dNTPs, Taq DNA Polymerase), which exhibited a notable variability in rpoC1 amplification success among different plant samples. All the amplified sequences obtained from rbcL gene show high efficiency and quality sequences (100% sequencing success) while rpoC1 showed only 80% success.
The chloroplast region of rpoC1 was notably utilized as a genetic marker to discriminate many plants (Rydberg, 2010). However, in the present study, the rpoC1 region showed lower sequencing success when compared to rbcL region. An identical outcome was also reported by other researchers that recorded a low sequencing success for rpoC1 (see e.g., Sass et al., 2007; Rydberg, 2010; Hollingsworth, 2011; Tripathi et al., 2013). The interspecific variation for this locus is too low in some plant groups and the difficulty in amplifying and sequence has been identified as the main limitation for rpoC1 locus (Sass et al., 2007). This pitfall consequently has led to a disputation for contemplating rpoC1 as not an effective and favourable standard gene marker for plants (Sass et al., 2007).
3.2 Species identification
BLASTn analysis for all sequences showed that all samples have been correctly identified up to a species level, demonstrating that all plant samples preliminary identified based on their morphological characteristic matched with the scientific names retrieved from the conspecific sequences deposited in GenBank (Table 2). Likewise, rbcL gene consistently shows the highest rate of success for species identification (99.8%) based on BLASTn analysis. Conversely, the identification for rpoC1 was notably low at both levels (genus and species) which is only 66.7% of all the collected samples. Based on these results, the present study reveals that rbcL is the reliable DNA marker for the Piper sp. collected from northern Peninsular Malaysia (Table 2).
Vernacular name
Gene markers
rbcL
rpoC1
Scientific name
Max Id (%)
Scientific name
Max Id (%)
Sirih
P. betle
99
P. betle
99
Sirih
P. auritum
99
P. auritum
99
Sirih hutan
P. caninum
98
P. nigrum
85
Kaduk
P. sarmentosum
99
P. protrusum
88
Lemba
P. umbellatum
97
P. umbellatum
99
Lada hitam
P. nigrum
99
P. nigrum
96
The variation of names used for the same plants throughout different races, ethnics and geographic range is likely the most important reason for the mismatch in species identification by BLASTn analysis. (Mankga et al., 2013). For example, in Malaysia, the medicinal plant named ‘sirih’ or ‘sireh’ is mostly referred as Piper betle and/or Piper sarmentosum. The plant was also called ‘sirih’ in Indonesia while in the Philippines it was called ‘Ikmo’. Nagori et al. (2011) showed that P. betle exhibit high antioxidant activity and possessed antifungal, antiseptic and anthelmintic properties to serve as a contraceptive for humans. Moreover, consumption of food products contained P. betle could contribute to the additional antioxidant needed in the body to enhance defence system, as well as an additional nutraceutical supplement in patients diagnosed with rheumatism and leucorrhoea (Nagori et al., 2011). However, inaccurate identification of plants will compromise the therapeutic value of medicinal plants, thus would endanger human health. For example, adulterant Bunium cylindricum that has been homogenated with B. persicum and trade in the retail outlet in Iran have resulted in the deterioration of the superiority and effectuality of the products (Joharchi and Amiri, 2012). Many cases of toxicity have been reported and mostly due to species misidentification (Viljoen, 2013). The situation, where a proliferation of herbal remedies that have been adulterated or substituted with other plant materials, has stressed the need for a quality control (Raterta et al., 2014).
3.3 Species partitioning and discrimination
The interspecific genetic distances (Ds) were significantly higher (0.00–0.095) for samples amplified by rpoC1 gene as compare to rbcL (Ds = 0.000–0.023), manifesting that all samples analysed in this study were genetically unrelated (Table 3). In contrast, intraspecific genetic distances (Ds) were significantly low, ranging from 0.000 to 0.033 (rbcL) and 0.000–0.095 (rpoC1), signifying the exclusion of a cryptic species (Table 3). The validity of rbcL gene as the reliable barcode marker for Piper sp. was further supported by the ABGD analysis. The number of species defined by ABGD ranged with the change prior thresholds from 0.001 to 0.050 prior intraspecific divergences (P) for rbcL marker (Fig. 2A) and within the range of 0.000 to 0.470 for rpoC1 (Fig. 2B). For rbcL, the lowest threshold values varied from 0.00 to 0.03 and grouped all haplotypes as a different species (11 species). However, this is not the case for rpoC1 where the lowest threshold values (0.00–0.91) clustered all haplotypes into eight groups only. This has resulted in the same grouping as shown by the Maximum Likelihood (ML) and Neighbour-Joining (NJ) phylogenetic tree model of all species. Thus, the 11 and eight species clusters that were demarcated by the ABGD approach via the high prior threshold for rbcL and rpoC1 genes, respectively are corroborated by the outcome of ML and NJ analysis. The NJ tree shows a same topology as in ML analysis, thus only the ML phylogenetic tree was represented for both genes (Figs. 3 and 4).
Sample
PB
AS1
BA2
KA1
BL1
BL2
BA1
KA2
AS2
BP1
BP2
PB
0.0273
0.0772
0.0802
0.0802
0.0788
0.0788
0.0772
0.0861
0.0861
0.0299
AS1
0.0104
0.0024
0.0248
0.0248
0.0273
0.0273
0.0024
0.0646
0.0646
0.0589
BA2
0.0104
0.0041
0.0273
0.0273
0.0298
0.0298
0.0000
0.0618
0.0618
0.0273
KA1
0.0103
0.0083
0.0082
0.0000
0.0299
0.0299
0.0273
0.0922
0.0922
0.0861
BL1
0.0125
0.0145
0.0124
0.0187
0.0299
0.0299
0.0273
0.0922
0.0922
0.0922
BL2
0.0125
0.0145
0.0124
0.0187
0.0000
0.0000
0.0298
0.0949
0.0949
0.0861
BA1
0.0000
0.0104
0.0104
0.0103
0.0125
0.0125
0.0298
0.0949
0.0949
0.0273
KA2
0.0104
0.0083
0.0083
0.0082
0.0187
0.0187
0.0104
0.0618
0.0618
0.0665
AS2
0.0104
0.0083
0.0083
0.0082
0.0187
0.0187
0.0104
0.0000
0.0000
0.0299
BP1
0.0167
0.0187
0.0187
0.0329
0.0166
0.0166
0.0167
0.0329
0.0329
0.0646
BP2
0.0167
0.0187
0.0187
0.0229
0.0166
0.0166
0.0167
0.0229
0.0329
0.0000
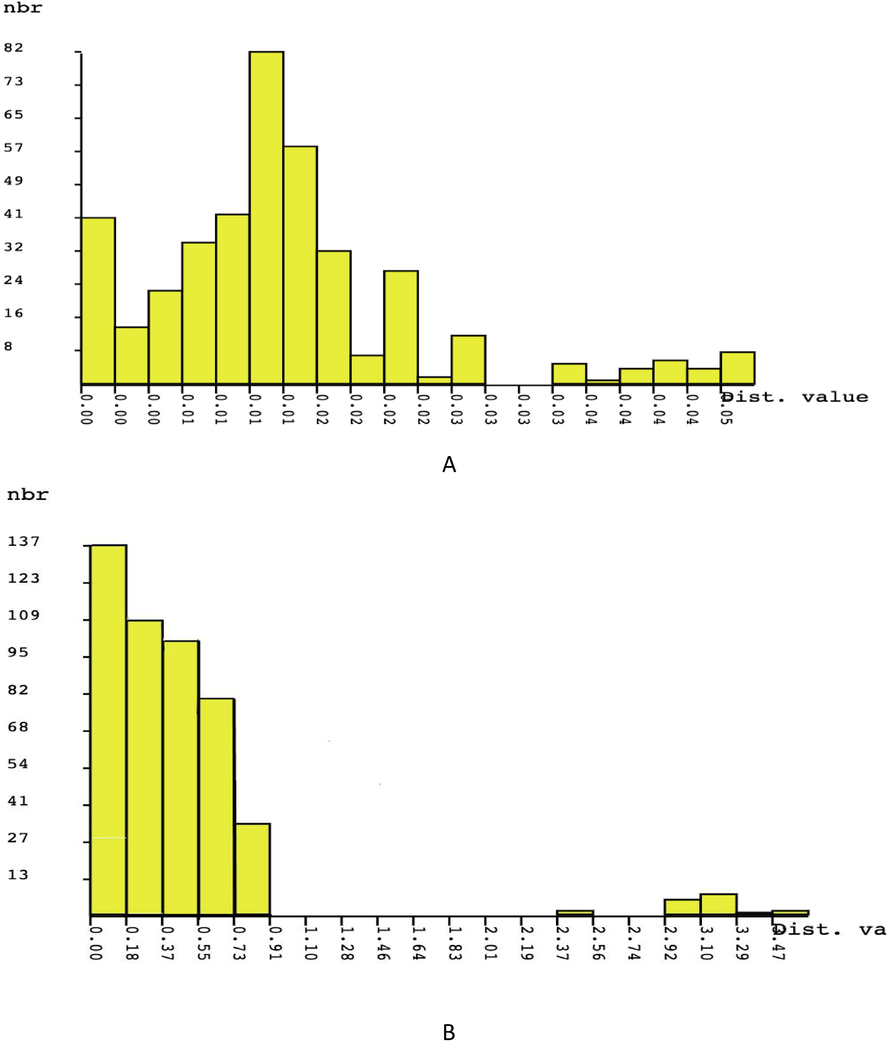
Distribution of rbcL (A) and rpoC1 (B) pair-wise JC69 distance values performed by ABGD, showing the barcode gap between the putative maximum co-specific divergence and the minimum congeneric divergence.
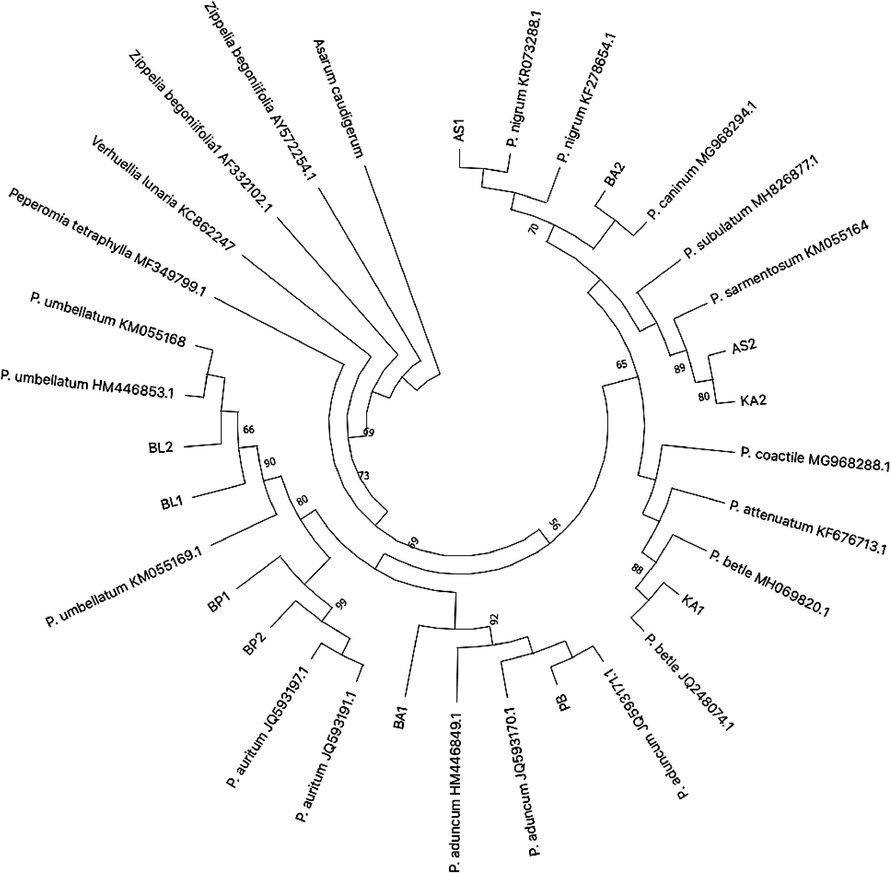
The evolutionary history of Piper sp. collected from northern Peninsular Malaysia (including sequences retrieved from GenBank) inferred by using the Maximum Likelihood method and Kimura 2-parameter model for rbcL gene. The tree with the highest log likelihood (-974.05) is shown. The percentage of trees in which the associated taxa clustered together is shown next to the branches.
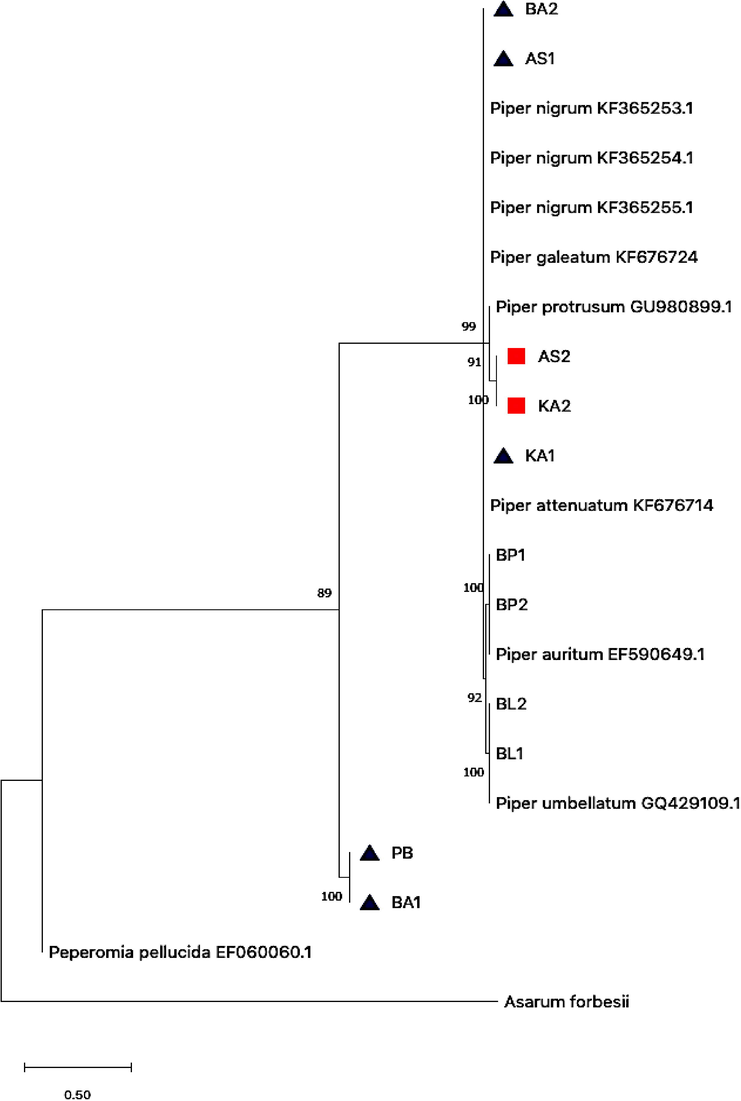
The evolutionary history of Piper sp. collected from northern Peninsular Malaysia (including sequences retrieved from GenBank) inferred by using the Neighbour-Joining method and Kimura 2-parameter model for rpoC1 gene. The tree with the highest log likelihood (-1840.11) is shown. The percentage of trees in which the associated taxa clustered together is shown next to the branches.
 shows sample with missing corresponds sequence from GenBank.
  indicate samples with ambigous identification.
The ML and NJ phylogenetic trees for each barcode marker used in this study were diverged each species by delineating a monophyletic clade, where all clades revealed evidence separate from other clades with a high bootstrap value (Figs. 3 and 4). For example, the clade containing P. auritum and P. umbellatum as displayed by rbcL (Fig. 3) and rpoC1 (Fig. 4) NJ phylogenetic trees were well supported. The rbcL genes demonstrated successful identification both at all levels. Nevertheless, the verification rate of rpoC1 barcode is only 66.7% (Table 2, Fig. 4). In this case, some of the species’ positions are paradoxical in which they were grouped within a different species and/or genus. For example, two samples namely AS2 and KA2 that were confirmed as Piper sarmentosum (based on BLASTn and rbcL gene) was largely diverged from its ancestor in which it was positioned with Piper protrusum (sequence retrieved from GenBank) (Fig. 4). Several samples, namely BA2, AS1, KA1, PB and BA1 were successfully amplified, but the identity of the samples was not resolved as no correspond sequence available from GenBank.
In phylogenetic reconstruction, one of the most notable difficulties that can generate unreliable in regards to the accurate evolutionary history of the organism or genes analysed is the extensive existence of inconsistency among approaches. This was also corroborated by the incompatibility of genes or genomic regions used to infer the phylogenetic output. Accordingly, such drawback hindered the principal aims of evolutionary research (Som, 2014). This is further exacerbated by the advancement of genomic and molecular approaches that has escalated the variation of categorizations instead of lessening the issues or complications. Consequently, many important nodes remain unresolved. Thus, the fact that some samples were misidentified in this study may not be due to a misidentification or phylogenetic approaches used, but probably due to unidentified node.
The disparity index (DI) analysis of both markers shows in Table 4 was further corroborated the above analysis in which it indicates that the rbcL gene has lower range of disparity index than rpoC1. The lowest DI value was found between the PB (Perlis) and AS1 (Kedah) samples with the value of 0.0082 for rbcL gene. However, the highest value was between PB (Perlis) and BP2 (Penang) for rpoC1 gene, demonstrating the greatest variations in the composition of bases in each sequence. This might be the consequences of a high heterogeneous substitution structures constructed within the samples as amplified by rpoC1 gene.
Sample
PB
AS1
BA2
KA1
BL1
BL2
BA1
KA2
AS2
BP1
BP2
PB
3.1238
3.1091
3.0584
3.0584
0.0000
2.1215
2.1215
3.3122
3.3122
3.3122
AS1
0.0104
0.0000
0.0000
0.0000
0.0273
3.2538
0.1271
0.1271
0.0000
0.0000
BA2
0.0104
0.0041
0.0000
0.0000
0.0298
3.2538
0.1271
0.1271
0.0000
0.0000
KA1
0.0103
0.0083
0.0082
0.0000
0.0299
3.1091
0.0080
0.0880
0.0000
0.0000
BL1
0.0125
0.0145
0.0124
0.0187
0.0299
3.0584
0.1149
0.1149
0.0195
0.0195
BL2
0.0125
0.0145
0.0124
0.0187
0.0000
3.0584
0.1149
0.1149
0.0195
0.0195
BA1
0.000
0.0104
0.0104
0.0103
0.0125
0.0125
2.1215
2.1215
3.3122
3.3122
KA2
0.0104
0.0083
0.0083
0.0082
0.0187
0.0187
0.0104
0.0000
0.1076
0.1076
AS2
0.0104
0.0083
0.0083
0.0082
0.0187
0.0187
0.0104
0.0000
0.1076
0.1076
BP1
0.0167
0.0187
0.0187
0.0329
0.0166
0.0166
0.0167
0.0329
0.0329
0.0000
BP2
0.0167
0.0187
0.0187
0.0229
0.0166
0.0166
0.0167
0.0229
0.0329
0.0000
A perfect barcode of DNA should possess sufficient conserved segment to design a universal primer and should have high variations to be utilized for discrimination of a species and must able to distinguish between complex species. This can be attained if a species has remarkably high genetic distance compared to the other intraspecific individual within the group (Hebert et al., 2004; Mankga et al., 2013). The phylogenetic tree-based approaches have been substantially used in DNA barcode studies in order to assign a species to its respective taxa and the widely utilized phylogenetic tree is NJ, where the essence of evaluation was relied on morphological distance and the species’ documentation of evolution (Liu et al., 2014).
Traditionally, approach on molecular systematic have depended on contrasting a restricted number of the orthologous sequence in order to acquire evaluation of species relationships across the tree of life (Edger et al., 2014). Additionally, a supposition of tree-based analysis of nucleic acid sequences is that each position is unconnected with the other positions was always made in analysing phylogenetic relationship of a species (Alvarez and Wendel, 2003). The outcomes of this research demonstrated that the majority of sequence sites for rpoC1 are not evolving independently, but more precisely are surviving in another position/site in order to conserve the secondary composition of a molecule. Thus, in future studies, effort should be made to determine all coevolving positions and relevant adaptations are needed before utilizing rpoC1 region as a barcode marker.
Nowadays, there are various DNA marker accessible for researchers in the plant sciences field. However, many researchers have disputed that it is very strenuous to find a universal barcode for the identification of all plant species due to morphological and geographical variations as well as reticulate evolution ( Mosa et al., 2019). A review on the role of DNA barcoding as a powerful tool for plant biodiversity analysis by Mosa et al. (2019) revealed that the ITS and rbcl gene have been recognized as core barcode markers. For example, Asterella could be distinguished by the rbcL gene alone with 90% successful rate (Table 5), while approximately 70% of angiosperm and only 32% of gymnosperm species (especially Araucaria) were successfully identified by the association of several chloroplast DNA regions (Hollingsworth et al., 2009a,b; Ran et al., 2010). This further support our conclusion on the reliability of rbcL as a DNA barcode marker. However, there is no universal barcode method for plants and researchers are utilizing several different gene markers for improving success in species identification.
Gene(s)
Specimens
Refs.
ITS
Medicinal plants (5905 species from 1010 diverse genera (219 families) in seven phyla. Arid plants.
Feliner and Rossell, 2007; Chen et al., 2010; Mosa et al., 2019
rbcL
Osmunda and Arid plants
Schneider and Schuettpelz, 2006; Mosa et al., 2019
rbcL or rpoC1
49 moss, 9 liverwort species
Liu et al., 2010
Three-locus combinations (rpoC1 + rbcL + matK + trnh-psbA)
Asterella, Araucaria, Inga
Hollingsworth et al., 2009b
matK + one chloroplast region
Carex, Kobresia
Le Clerc-Blain et al. 2010
rbcL + matK
907 samples from 550 species representing the major lineages of land plants
CBOL Plant Working Group 2009
trnH-psbA + matK
Myristicaceae, Crocus, Tripogon, Parthenium
Newmaster et al., 2008; Seberg and Petersen, 2009; Ragupathy et al., 2009; Kumar et al., 2009
Another important point has raised in this study is that some species (for e.g. P. umbellatum and P. auritum) were region-specific, in which they can be found specifically in Penang and absent in other sampling locations (Fig. 3). This is probably due to the habitat conditions that are suitable for both of the species. They usually occurs in the undergrowth of evergreen rainforest, but also in clearings and on river banks in which they always occurs in damp localities. That some of the species were not region-specific (for e.g. P. sarmentosum) probably due to the fact that they are easy to grow and therefore are easily available. Additionally, P. sarmentosum is an invasive species and easily colonized areas where they were found.
4 Conclusion
Eight species from genus Piper from northern Peninsular Malaysia (P. betle, P. nigrum, P. galeatum, P. sarmentosum, P. auritum, P. aduncum, P. caninum and P. umbellatum) were successfully identified based on DNA characterization at two target genes namely rbcL and rpoC1. Using the BLAST analysis and genetic distance method as inferred by ABGD and a phylogenetic tree, the present study suggests that rbcL is the reliable marker for identification of Piper sp. from northern Peninsular Malaysia. The results were further corroborated by the disparity index analysis for both genes analysed. Further research on the use of other target regions for species discrimination of plants within genus Piper will assist in initiating a fundamental data and give insights into the molecular taxonomy of the genus.
Acknowledgments
The authors wish to convey their heartfelt gratitude to all individuals involved in collection of samples. The research was supported by the Ministry of Education Malaysia under the TRGS Grant (203/PBIO/67611003) and Research University Grant (1001/PBIOLOGI/8011068) through Universiti Sains Malaysia, Penang, Malaysia. The author (Shahid Mahboob) also want to express their sincere appreciation to the Researchers Supporting Project (RSP-2019-93), King Saud University, Riyadh, Saudi Arabia.
Author contribution statement
DMN established the theoretical formalism, performed the analytic calculations and numerical simulations. SM contributed to the final version of the manuscript.
Declaration of Competing Interest
The authors declare that they have no known competing financial interests or personal relationships that could have appeared to influence the work reported in this paper.
References
- Ribosomal ITS sequences and plant phylogenetic inference. Mol. Phylogen Evol.. 2003;29:417-434.
- [Google Scholar]
- Molecular DNA identification of medicinal plants used by traditional healers in Malaysia. Genet. Mol. Res.. 2015;14:15937-15947.
- [Google Scholar]
- Chemical, pharmacological and clinical profile of the East Asian medical plant. Centella asiatica Phytomed.. 2000;7:427-448.
- [Google Scholar]
- Photographic atlas of botany and guide to plant identification. Florida: Feline Press; 2005.
- Validation of the ITS2 region as a novel DNA barcode for identifying medicinal plant species. PLoS One. 2010;5 e8613
- [Google Scholar]
- Ready-to-use DNA extracted with a CTAB method adapted for herbarium specimens and mucilaginous plant tissue. Plant Mol. Biol. Rep.. 2006;24:161-167.
- [Google Scholar]
- MUSCLE: multiple sequence alignment with high accuracy and high throughput. Nucl. Acids Res.. 2004;32:1792-1797.
- [Google Scholar]
- Secondary Structure analyses of the nuclear rRNA internal transcribed spacers and assessment of its phylogenetic utility across the Brassicaceae (Mustards) PLoS ONE. 2014;9 e101341
- [Google Scholar]
- Better the devil you know? Guidelines for insightful utilization of nrDNA ITS in species-level evolutionary studies in plants. Mol. Phylogenet. Evol.. 2007;44:911-919.
- [Google Scholar]
- Antioxidant and α-glucosidase inhibitory activities of Murraya koenigii leaf extracts. Pharmacog. J.. 2012;4:65-72.
- [Google Scholar]
- Biological identifications through DNA barcodes. Proc. R. Soc. Lond. B.. 2003;270:313-322.
- [Google Scholar]
- Ten species in one: DNA barcoding reveals cryptic species in the Neotropical skipper butterfly Astraptes fulgerator. Proc. Natl. Acad. Sci. U.S.A.. 2004;101:14812-14817.
- [Google Scholar]
- Selecting barcoding loci for plants: evaluation of seven candidate loci with species-level sampling in three divergent groups of land plants. Mol. Ecol. Res.. 2009;9:439-457.
- [Google Scholar]
- Refining the DNA barcode for land plants. Proc. Natl. Acad. Sci. U.S.A.. 2011;108:19451-19452.
- [Google Scholar]
- Taxonomic evaluation of misidentification of crude herbal drugs marketed in Iran. Avicenna J. Phytomed.. 2012;2:105-112.
- [Google Scholar]
- Evolution of Protein Molecules. New York: Academic Press; 1969. p. :21-132.
- Ethnopharmacological survey of medicinal plants used by traditional health practitioners in Thanchi, Bandarban Hill Tracts, Bangladesh. J. Ethnopharm.. 2014;155:495-508.
- [Google Scholar]
- A simple method for estimating evolutionary rate of base substitutions through comparative studies of nucleotide sequences. J. Mol. Evol.. 1980;16:111-120.
- [Google Scholar]
- Plant DNA barcodes and a community phylogeny of a tropical forest dynamic plot in Panama. Proc. Nat. Acad. Sci. U.S.A.. 2009;106:18621-18626.
- [Google Scholar]
- Comparative analysis of the complete sequence of the plastid genome of Parthenium argentatum and identification of DNA barcodes to differentiate Parthenium species and lines. BMC Plant Biol.. 2009;9:131.
- [Google Scholar]
- S. Kumar J. Kamboj Suman S. Sharma 2011 Overview for varius aspects of the health benefits of Piper longus Linn Fruit J. Acupunct. Meridian Stud. 4 134 140
- MEGA X: Molecular Evolutionary Genetics Analysis across computing platforms. Mol. Biol. Evol.. 2018;35:1547-1549.
- [Google Scholar]
- A regionalapproach to plant DNA barcoding provides high species resolution of sedges (Carex and Kobresia, Cyperaceae) in the Canadian Arctic Archipelago. Mol. Ecol. Resour.. 2010;10:69-91.
- [Google Scholar]
- Family-level relationships of Onagraceae based on chloroplast rbcL and ndhF data. Am. J. Bot.. 2003;90:107-115.
- [Google Scholar]
- Identifying species of moths (Lepidoptera) from Baihua Mountain, Beijing, China, using DNA barcodes. Ecol. Evol.. 2014;4:2472-2487.
- [Google Scholar]
- Evaluation of 10 plant barcodes in Bryophyta (Mosses) J. Syst. Evol.. 2010;48:36-46.
- [Google Scholar]
- Discriminatory power of rbcL barcode locus for authentication of some of United Arab Emirates (UAE) native plants. 3 Biotech.. 2017;7:144.
- [Google Scholar]
- Efficacy of the core DNA barcodes in identifying processed and poorly conserved plant materials commonly used in South African traditional medicine. Zookeys. 2013;365:215-233.
- [Google Scholar]
- The Promise of molecular and genomic techniques for biodiversity research and DNA barcoding of the Arabian Peninsula flora. Front. Plant Sci.. 2019;9(1929)
- [CrossRef] [Google Scholar]
- The unusual origin of the polymerase chain reaction. Sci. Am.. 1990;262(56–61):64-65.
- [Google Scholar]
- Piper betle L.: a review on its ethnobotany, phytochemistry, pharmacological profile and profiling by new hyphenated technique DART-MS (Direct Analysis in Real Time Mass Spectrometry) J. Pharm. Res.. 2011;4:2991-2997.
- [Google Scholar]
- Testing candidate plant barcode regions in the Myristicaceae. Mol. Ecol. Resour.. 2008;8:480-490.
- [Google Scholar]
- MrModeltest v2. Program distributed by the author. Evolutionary Biology Centre, Uppsala University; 2004.
- Two new Malagasy species of genus Piper L. (Piperaceae), Piper malgassicum and Piper tsarasotrae, and their phylogenetic position. Turk. J. Bot.. 2018;42:610-622.
- [Google Scholar]
- Identification of medicinal plants using DNA barcoding technique. Encyc. Anal. Chem. 2014:1-4.
- [Google Scholar]
- Phylogeographic analysis of the red seaweed Palmaria palmata reveals a Pleistocene marine glacial refugium in the English Channel. Mol. Ecol.. 2005;14:793-803.
- [Google Scholar]
- ABGD, Automatic Barcode Gap Discovery for primary species delimitation. Mol. Ecol.. 2012;21:1864-1877.
- [Google Scholar]
- DNA barcoding discriminates a new cryptic grass species revealed in an ethnobotany study by the hill tribes of the Western Ghats in southern India. Mol. Ecol. Resour.. 2009;9(Suppl. 1):164-171.
- [Google Scholar]
- A test of seven candidate barcode regions from the Plastome in Picea (Pinaceae) J. Int. Plant Biol.. 2010;52:1109-1126.
- [Google Scholar]
- Molecular authentication of selected commercially sold medicinal plants in Quiapo, Manila. Philippines. Int. J. Sci. Tech. Res.. 2014;3:22-26.
- [Google Scholar]
- DNA barcoding as a tool for the identification of unknown plant material. Biology Education Centre and Department of Systematic Biology. Uppsala University; 2010.
- DNA Barcoding in the Cycadales: Testing the potential of proposed barcoding markers for species identification of cycads. PLoS ONE.. 2007;2 e1154
- [Google Scholar]
- Identifying fern gametophytes using DNA sequences. Mol. Ecol. Not.. 2006;6:989-991.
- [Google Scholar]
- DNA Barcoding as a means for identifying medicinal plants of Pakistan. Pak. J. Bot.. 2011;43:1-4.
- [Google Scholar]
- Ethnobotanical survey of usage of fresh medicinal plants in Singapore. J Ethnopharm.. 2014;155:1450-1466.
- [Google Scholar]
- Causes, consequences and solutions of phylogenetic incongruence. Briefings in Bioinfor.. 2014;16:536-548.
- [Google Scholar]
- Prospects for inferring very large phylogenies by using the neighbor-joining method. Pro. Nat. Acad. Sci.. 2004;101:11030-11035.
- [Google Scholar]
- The Internal Transcribed Spacer (ITS) region and trnhH- psbA are suitable candidate loci for DNA barcoding of tropical tree species of India. PLoS ONE. 2013;8 e57934
- [Google Scholar]
- Standardization and quality control of herbal medicinal products-does vibrational spectroscopy offer the solution? J. Med. Plant. Nat. Prod. Res.. 2013;79:369-421.
- [Google Scholar]
- DNA barcoding Australia’s fish species. Philos. Trans. R. Soc. Lond. B Biol. Sci.. 2005;360:1847-1857.
- [Google Scholar]


