

Translate this page into:
Molecular docking and quantitative structure-activity relationship study of anti-ulcer activity of quinazolinone derivatives
⁎Corresponding author. mmbaba247@gmail.com (Muhammad baba Muh'd),
-
Received: ,
Accepted: ,
This article was originally published by Elsevier and was migrated to Scientific Scholar after the change of Publisher.
Peer review under responsibility of King Saud University.
Abstract
Proton pump inhibitors portray the first choice for treating various ulcer diseases because it inhibits H+/K+-ATPase enzyme, by covalently binding to a cysteine residue of either potassium or proton pump, therefore this enzyme is a validated target for anti-ulcer drugs. A Quantitative structure-affinity relationship (QSAR) and molecular docking analysis were carryout on 30 quinazolinone derivatives as H+/K+-ATPase inhibitors. QSAR study was performed using Material studio software version 8.0, while molecular docking analysis of all the novel quinazolinone derivatives was performed using Autodock vina version 4.0 of Pyrx software. The QSAR result reveal a strong correlation value of R2 = 0.9131, R2adj = 0.8914, Q2LOO = 0.8038 and R2 pred = 0.8946 which showed a highly predictive and statistically significant model. Molecular docking analysis revealed that the ligand 25 bind tightly deep to H+/K+-ATPase (protein target). Because of the high binding affinity of −9.3 kcal/mol. This research has revealed a significant correlation between binding score and biological activities of the molecules, and the results are even better than the one proposed by other authors, more also, both results of quantitative structure-affinity relationship (QSAR) and docking studies agree with each other which give chance for design and synthesis of novel anti-ulcer agents exhibiting good action against the receptor (H+/K+-ATPase) Furthermore, the present study prove more potent drugs than the ones already marketed.
Keywords
K+/H+-ATPase
GFA
PUD QSAR
DFT
(B3LYP/6-31G∗)

1 Introduction
An ulcer can be referred to a surface/region in the digestive system where the tissue has been ruined or damaged by the gastric juice or other digestive enzymes that are produced by the stomach (Chaudhary et al., 2015; Shamsuddeen et al., 2009). The common major type of ulcer that mostly affects the global population is the peptic ulcer diseases, which occurs in the stomach or small intestine, the secreted gastric acid by the stomach compartment destroy the protective cover of the small intestine or the stomach (duodenum) giving rise to acid-related disorders (Utzeri and Usai, 2017). Peptic ulcer disease can also be regarded as a malfunction that occurs in the protective cover of the gastrointestinal tissue, with perceptible deep or involvement of the submucosa (Konturek and Konturek, 2014). In another term, Peptic ulceration is due to an imbalance between the petulant factors, such as pepsin and gastric acid, and local mucosal defenses such as prostaglandins, mucus, and bicarbonate. Other main causes of the disease are Helicobacter pylori infection, use of pain killer’s drugs, smoking, exposure to stress and alcoholic drinking (Wang et al., 2016; Konturek and Konturek, 2014). The most common signs of peptic ulcer diseases include abdominal pain, hematemesis (vomiting of blood), chest pain, episodic gnawing and loss of appetite. Pain is usually alleviated during the night hours when the pH of gastric juice in the stomach has increased (due to circadian changes), the pain is locally attributed to empty stomach about 2---5hrs (Wang et al., 2017; Anand and Wakode, 2017) (See Table 1). The letter a = training set while b = test set.
S/NO
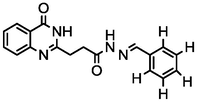
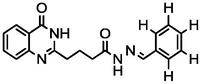
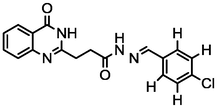
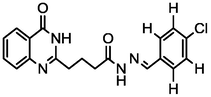
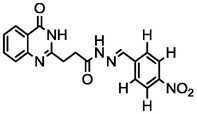
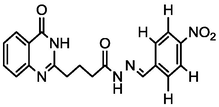
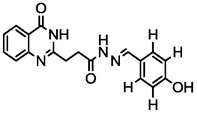
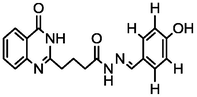
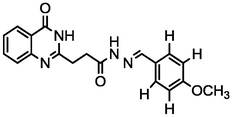
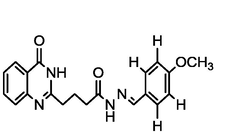
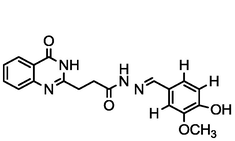
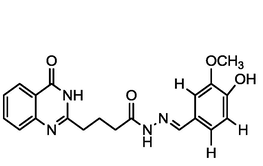
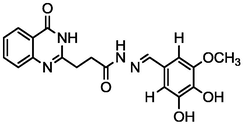
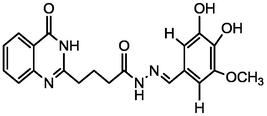
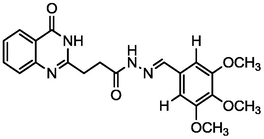
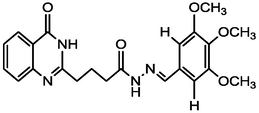
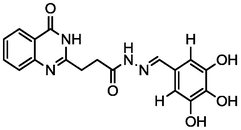
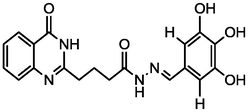
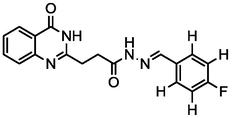
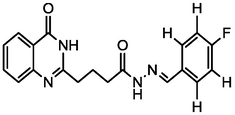
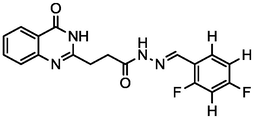
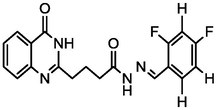
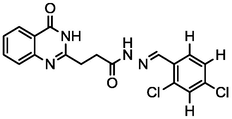
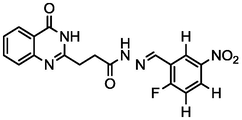
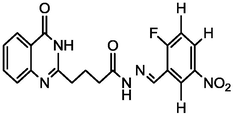
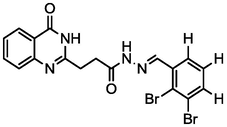
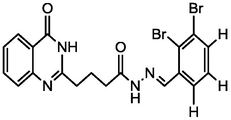
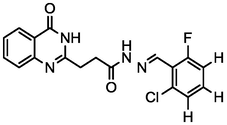
Structures
pIC50
1a
3.67
2a
3.70
3b
3.81
4a
3.87
5a
3.85
6b
3.89
7a
4.22
8a
4.29
9b
4.26
10a
4.38
11a
4.43
12b
4.49
13a
4.53
14a
4.61
15b
4.65
16a
4.85
17a
4.82
18b
4.99
19a
3.76
20a
3.79
21b
3.74
22a
3.77
23a
3.83
24b

3.88
25a
3.88
26a
3.84
27b
3.82
28a
3.85
29a
3.79
30a
3.84
Peptic ulcer disease is one of the life-threatening diseases that affect a large population of the world, over the past two centuries with high morbidity as well death rate (Ya-Li et al., 2015; Rajesh et al., 2017). Approximately 500,000 people are affected by the diseases in the United States, new 4million cases of peptic ulcer complications, 1.8% lifetime prevalence (8–14%) with annual costs of $4.82 billion in the develop countries (Noor et al., 2017). Gastric proton/potassium pump (H+/K+-ATPase) is a phosphoenzyme resting and concentrated in the parietal cells, is responsible for the excess secretion of gastric acid into the stomach lumen, leading to acid-related disorders (Agarwal et al., 2013). Therefore, this enzyme is unique to the parietal cells, it is considered as a good validated hit for anti-ulcer agents (Agarwal et al., 2013) because the proton pump inhibitors reduce acid secreted by the stomach via restraining the function of the enzyme.
There are currently many anti-ulcer drugs in the markets, such as raperazole, lansoprazole, and omeprazole (Drini, 2017; Agarwal et al., 2013). But these drugs are associated with side effects such as renal failure, relapses, kidney/liver dysfunction etc. More also the antibiotic resistance of H. pylori. Blockage of prostaglandins by anti-inflammatory drugs are all serious problems. Therefore, Demand in search and design of potent molecules having anti-inflammatory, and anti-ulcer action with an improved profile is still a necessity (Rakesh et al., 2016). The Schiff’s base family is made up of natural products, possessing diverse biological functions, which include: development of agrochemicals, medicines, fungicide bactericide, antivirals antioxidants, antiproliferative and antimicrobial drug (Rakesh et al., 2016). In medicinal chemistry, quinazolinone derivatives are part of this family which play a crucial role in reducing gastric toxicity, hence, based on the above fact, quinazolinone derivatives would be used to determine it anti-ulcer action.
Quantitative structure-affinity relationship (QSAR) and molecular docking techniques are largely apply to produce active drugs, and to provide knowledge on how the drug interacts with receptor often both method accelerate drug discovery process (Agarwal et al., 2013), the widespread application of quantitative structure-affinity relationship (QSAR) technique is also used to confirm a relationship that exists between the compounds and their determined biological experimental activities (Abdulfatai et al., 2017). Molecular docking is employed to determine the binding compatibility of the active site residues (receptor) to specific groups (ligands) through the use of scoring function by estimation of the probability of small molecule bind to a macromolecule (Agarwal et al., 2013). In view of this findings, this study is undertaken with the aim to search for effective and novel anti-ulcer inhibitors, which can be achieved through the use of molecular modeling by using Genetic Function Algorithm (GFA) method and to determine the experimental biological activity of the compounds. More also the compounds (quinazolinone derivatives) will be docked against the H+/K+-ATPase enzyme (protein target).
2 Materials and method
2.1 QSAR studies
2.1.1 Dataset collection
A series of 30 quinazolinone derivatives and their anti-ulcer activity against H+/K+-ATPase enzyme, were collected from literature and used for this study (Rakesh et al., 2016). The anti-ulcer activities of these molecules measured as IC50 ( M) were normalized and expressed as logarithmic scale as pIC50 (pIC50 = log1/IC50), pIC50 was chosen to be the relying variable, while the descriptors were selected as independent variables. Using Genetic function algorithm. The 2D structures and the pIC50 (anti-ulcer activities) of these compounds are shown in Table.
2.1.2 Geometry optimization
ChemDraw Ultra 12.0 software was used to draw the 2D structure of the compounds and were save as cdx file format. The structures were then converted to 3D using Spartan 14.0 version 1.1.2 software, the calculation was carried out using molecular mechanics force field (MM n+) to minimize the energy of the molecules prior to the quantum chemical calculations.
6-311G* basis set, of density functional theory (DFT) using the B3LYP method, was employed for whole geometry optimization of the structures to obtain the lowest energy for all the compounds in this study (Abdulfatai et al., 2017). The DFT method uses Becke’s three-parameter functional (B3) with gradient correlation functional of Lee, Yang and Parr (LYP) which integrates a mixture of HF with DFT exchange terms.
2.1.3 Molecular descriptors calculation
The 1D, 2D and 3D descriptors from the optimized structures of the Spartan files saved as sdf file format were generated using Padel descriptor software version 2.18, this is because the Padel descriptor software recognizes only the sdf file format (Yap, 2011).
2.1.4 Dataset division
The biological data set was divided into a training and test set, in such a way that 70% (21) of the data set was made up of the training set, while 30% (9) of the biological data was used as the test sets. Kennard-Stone Algorithm was used for the division of the biological data into a training set and test set (Kennard and Stone, 1969).
2.1.5 Model building
The model was build using material studio software at Genetic Function Algorithms (GFA), the generated descriptors from Padel software tool were submitted for regression analysis with the pIC50 values selected as the dependent variable while the descriptors were chosen as independent variables. The regression equation was 4 which represent the number of the descriptors, 1000 was chosen for the Population, and 500 was input for the Generation parameter. The mutation probability was 0.1, and the number of top equation returned was 4, using 0.5 as the smoothing parameter. Friedman’s Lack of Fit (LOF) was used to score the model and other statistical parameters such as correlation coefficient matrix (R2) for the internal, and R2prd for external validation, statistical significance was determined using F test (Fischer’s value); Q2 (cross-validated correlation coefficient). Below is the Friedman’s lack of fit formula.
C refers to the number of terms in the model, other than constant time, while SSE is the sum of square of errors, p is the total number of descriptors, while d is a user-defined smoothing parameter, p is the total number of descriptors contained in all model terms, and M is the number of samples in the training set.
The structure of the regression model looks like this (David et al., 2018):
Y is the activity (pIC50), where ‘a’s and ‘x’s are regression coefficients for a conforming Nonpartisan variables representing molecular descriptors of the molecules, the ‘a’s correspond to ‘x’s. While the last variable ‘c’ is the regression constant.
2.1.6 Quality assurance of the model
The quantitative structure-affinity relationship (QSAR) model exploits in this study, was to evaluate the reliability and fatal capability of the model, through the use of internal and external validations parameters.
2.1.7 Internal and external validations
The standard used to compare internal and external validation parameters of a particular quantitative structure-affinity relationship QSAR model is shown in Table 2 (Abdulfatai et al., 2017). Component of the total variation assign to the model is known through the square of the correlation coefficient (R2) parameter. R2 is commonly used for internal validations, and the closer the R2 to 0.1 the better the regression equation tell us more about Y variable. The expression for R2 is given below:
Symbol
Name
Value
R2
Co-efficient of determination
0.6
P(95%)
Confidence interval at 95% confidence level
0.05
Q2
Cross Validation Co-efficient
0.5
R2- Q2
Difference between R2 and Q2
0.3
N(ext&testset)
Lesser number of external and test set
5
R2ext.
Co-efficient for determination of external and test set
0.6
R2 cannot be a useful measure for the goodness of model fitness. Therefore R2 is adjusted for the number of explanatory variables in the model, adjusted R2 (R2 adj) value varies directly with the increase in the number of repressors i.e. descriptors. Thus, the formula for adjusted R2 is explained below:
The letter n is the number of training set compounds, p is the number of independent variables in the model (Brand and Orr 2015).
The (Q2) known as leave one out cross validation coefficient is written as follows:
2.1.8 Y-randomization test
MLR models are built by randomly moving the activity while keeping the descriptors unchanged in Y-randomization test. The R2 and Q2 values for the new QSAR models built for many trials are expected to be very low, which assure that the developed quantitative structure-affinity relationship (QSAR) models are strong. The c??2?? parameter calculated should also be greater than 0.5 so that the model will pass the test before recommendation.
2.1.9 Applicability domain
A quantitative structure-affinity relationship (QSAR) model is an essential statistical tool used to determine whether a model make a good prediction within its applicability domain, and this can be determined from Williams plot (Tropsha et al., 2003). There are some techniques for assessing the suitable space of a QSAR model, leverage is one of them and is given for a chemical compound as hi:
The xi represents the row-vector of the compounds’ X is a number of times constant descriptors matrix of the training set compound. It’s used as the prediction tool of the warning leverages (h*) emulating the limit for X values. Thus (h*) is given below:
The small letter is the number of training set compounds, while p is the number of descriptors that will be used to generate the model. Williams plot is the plot of standardized residual against the leverages, which give information on the pertinent surface of the model in terms of chemical range. The compounds that lie outside the chemical domain (standardized residual no greater than 3 standard deviation units) are known as Y influential, while those compound that are above the chemical domain are called outliers.
2.2 Molecular docking studies
Protein-Ligand docking studies of some quinazolinone derivatives was evaluated in other to investigate the interaction between the active site of H+/K+-ATPase enzyme and the ligands on Hp G630 computer system, with Intel ® Core™ i3 Dual CPU, M330 @2.13 GHz 2.13 GHz, 4 GB of RAM using Auto dock vina 4.2 of pyrex virtual screening software, Chimera version 1.10.2 and Discovery studio software. Saccharomyces cerevisiae isomaltase crystallographic structure (Resolution 1.30 Å PDB code 3AJ7,) with 72.4% succession identity with the target was used as the mold for this study.
2.2.1 Ligands preparation for docking.
The 2D structure of the compounds (quinazolinone derivatives) was drawn using ChemDraw Ultra 12.0 software, and where later converted to 3D structures for geometry optimization of the compounds, using Spartan’14 version 1.1.2, PaDEL Descriptor version 2.18 (Yap, 2011; Anonymous, 2013).
2.2.2 Preparation of receptor
The structure of gastric proton pump inhibitors, with the PDB code 2Zex receptor, was downloaded from Protein Databank (PDB). The 3D structure receptor was prepared by discarding water molecules and cofactors using Discovery studio software (Ravinchandran et al., 2011) and save as Pdb.
2.2.3 Docking of the ligands with the receptor using Autodock version 4.0 of pyrx software.
The docking of the ligands (quinazolinone derivatives) and the receptor (H+/K+-ATpase) was perform using Autodock version 4.0 of pyrx software (Trott and Olson, 2010). Chimera 1.10.2 software was used to form the complex (ligand-receptor) since the receptor and the ligand separate after carrying out the docking with autodock vina of pyrx. The complexes were visualized to view their interactions using Discovery studio software.
3 Results and discussion
3.1 Results of the QSAR.
Four quantitative structure-affinity relationship (QSAR) models were developed using material studio software (Genetic Function Algorithm). And out of these four models, model 1 was selected as the preferable model for predicting the pIC50 for anti-ulcer compounds, and this was based on the internal validation statistical parameters of the model as it is in line with the recommended validation parameters for QSAR models. The result of the model 1 is given below:
pIC50 = 0.021537762 * BCUTw-1h - 0.436958289 * BCUTp-1h + 1.343771099 *MLFER_BO + 0.094105559 * WTPT-4 + 3.182054
R2trng = 0.913172, R2adj = 0.891465, Q2LOO = 0.803874, N trng = 21
R2test = 0.894996, N test = 9
The high leave one out cross validation coefficient calculated Q2 LOO value (0.8038) for pIC50 shows a valid internal validation of the model, the test set containing 30% of the biological data set were used for the external validation of the model and the result was found to be 0.8949 which is better than the standard c??2?? parameter value 0.50 for the model.
From the above plot of the developed model, we can say that the model is stable and robust, and this is because of the high linearity of the plot (straight line graph). More also the errors propagated on both side of the zero indicate the strength of the model, the prediction of the test set data were determined using the developed model equation. And are shown in Table 3. The plot of predicted values comprising both training set and test sets compounds against the experimental pIC50 values are shown in Fig. 1, the studied predicted activity is in accordance with the experimental activity. Fig. 2 illustrates the plot of standardized residual values versus leverages values (pIC50) (See Table 4).
S/No
Name
Description
Class
1
BCUTw-1h
Nlow highest atom weighted BCUTS
2D
2
BCUTp-1h
Nlow highest polarizability weighted BCUTS
2D
3
MLFER_BO
Overall or summation solute hydrogen bond basicity
2D
4
WTPT-4
Sum of part lengths starting from oxygen
2D
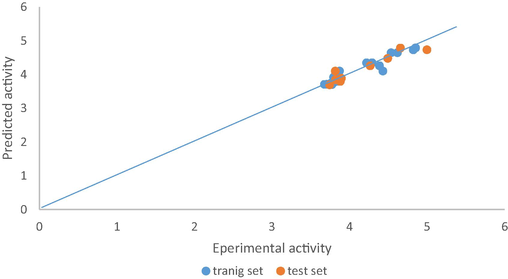
Plot of Predicted activity of both training set and test set versus experimental activity for model 1.
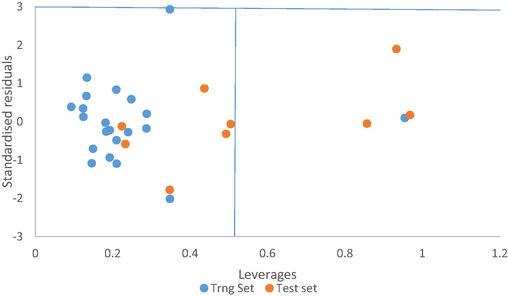
A plot of the standardized residual against leverages of both the training and test sets of model 1.
S/No.
pIC50
BCUTw-1h
BCUTp-1h
MLFER_BO
WTPT-4
Yprd
YPrd − Yobs
3b
3.81815
34.96938
9.353764
2.806
5.108277
4.099351
0.281194
6b
3.89619
15.99794
9.349122
2.612
9.937503
3.886542
-0.00965
9b
4.26760
15.99831
9.353553
3.032
7.889273
4.256248
-0.01136
12b
4.49485
15.99898
9.349303
3.016
10.41791
4.474578
-0.02027
15b
4.65757
15.99976
9.382758
3.041
13.51603
4.785121
0.127544
18b
4.99124
16.00001
9.349263
3.052
12.63542
4.731673
-0.26833
21b
3.74472
19.00061
9.353172
2.761
5.10812
3.695193
-0.04953
24b
3.88272
34.97016
9.914876
2.761
5.103419
3.793258
-0.08947
27
3.82102
78.91943
12.14228
2.819
5.108101
3.844922
0.023899
Based on the result obtained in Table 5 above the novel quantitative structure-affinity relationship (QSAR) models generated possess significantly low predicted R2 and Q2 (leave one out) values for several tests and also CR2P value is higher than 0.5 which means the model is a powerful one and it is not obtained by probability. Therefore R^2 = (1 − (0.1790/1.7047) = 0.89499.
S/No.
(Yprd-Yobs)2
Ymntrng
Ymntrng Yobs-
(Ymntrng − Yobs)2
3b
0.07907
4.0819
0.263744
0.069561
6b
9.32E-05
4.0819
0.185704
0.034486
9b
0.000129
4.0819
−0.18571
0.034487
12b
0.000411
4.0819
−0.41295
0.170528
15b
0.016267
4.0819
−0.57568
0.331404
18b
0.072
4.0819
−0.9181
0.842908
21b
0.002454
4.0819
0.337173
0.113685
24b
0.008005
4.0819
0.199171
0.039669
27b
0.000571
4.0819
0.260877
0.068057
Σ(Yprd-Yobs)^2 = 0.179000
Σ(Yobs-Ymntrng)^2 = 1.7047
3.1.1 Williams plot for the best model
Fig. 2, above is known as Williams plot. It can be deduced from the plot that four compounds were found outside the applicability domain (h*= 0.5) for the model, three compounds with pIC50 of 3.81, 4.65, 3.89 were the training set, while compound with pIC50 3.67 is the test set, indicating that these compounds are structurally different from other ones and possess few chemical descriptors. Furthermore, the plot indicates that about 70% of both training and test set compound to fall within the applicability domain. Hence the model shows a very good prediction.
3.1.2 Correlation matrix of the chemical descriptors from the best-chosen model
A Correlation matrix was performed on the descriptors of model 1, and found to be highly correlated which means that the descriptors used to build the model are very good. The result of the correlation matrix is shown in Table 6 above (See Tables 7 and 8).
Model
R
R2
Q2
Original
0.908394
0.825179
0.744396
Random 1
0.248977
0.061989
-0.44477
Random 2
0.407321
0.16591
-8.97625
Random 3
0.237331
0.056326
-0.93591
Random 4
0.391424
0.153213
-0.73844
Random 5
0.465703
0.21688
-0.1779
Random 6
0.544447
0.296423
-0.09683
Random 7
0.349944
0.122461
-0.44301
Random 8
0.2572
0.066152
-2.27191
Random 9
0.591068
0.349361
0.017999
Random10
0.184988
0.03422
-3.23752
Random Models Parameters
Average r:
0.36784
Averager2:
0.152294
AverageQ2:
−1.73045
CR2P:
0.754499
BCUTw-1h
BCUTp-1h
MLFER_BO
WTPT-4
BCUTw-1h
1
BCUTp-1h
0.953733
1
MLFER_BO
−0.28415
−0.1893
1
WTPT-4
−0.58115
−0.4189
0.581646
1
Ligands
Binding Energy (kcal/mol)
Hydrophobic Interactions
Electrostatic/Other Interactions
Hydrogen Bonds
Hydrogen Bond Distance (Å)
7 →
−9.0
CLR3001, ILE36
LEU791, TYR40 CLR3001ASP352
TYR158, GLU411, GLU277, and ARG442
4.27784, 5.49472
3.86964, and 5.27925
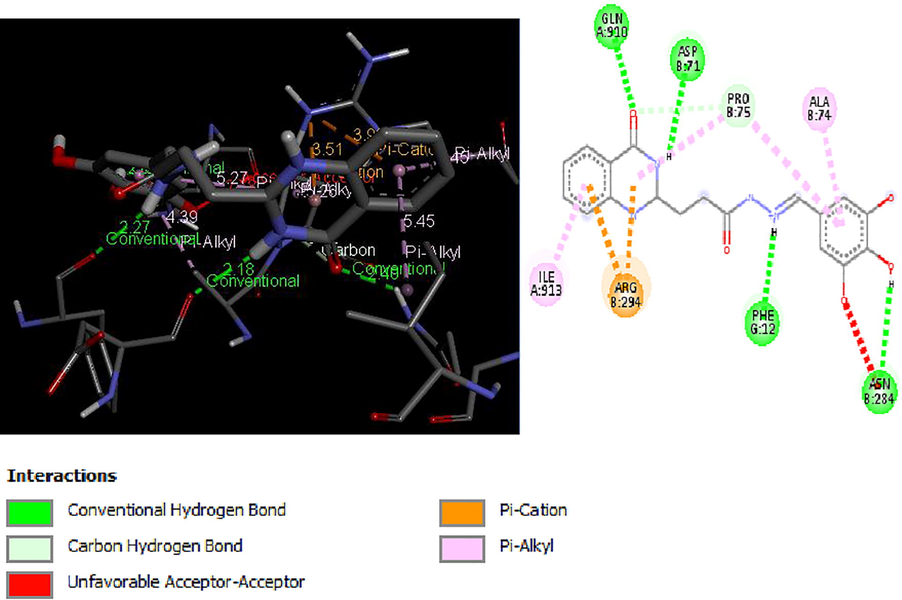
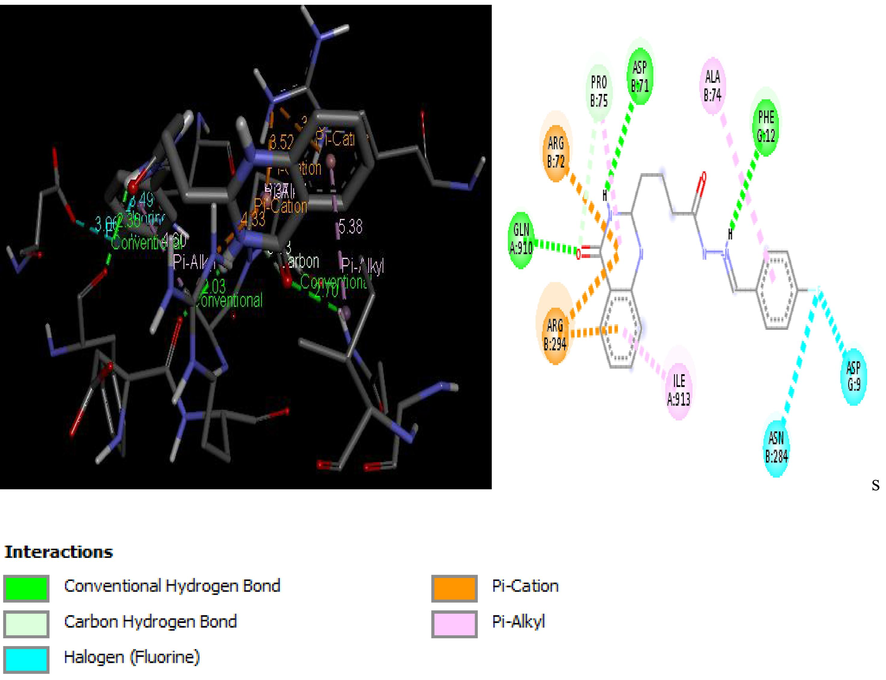
19→
−9.0
ASN284, ASP9
PRO75, ILE913, and ALA74ARG72, ARG294, and ARG294
ASP71, PHE12 GLN910, and PRO75
2.02787, 2.3628
2.70481, 3.43443
3.48504, 3.0611
4.33, 3.5194
3.7856, 5.3713
5.37746 and 4.5958
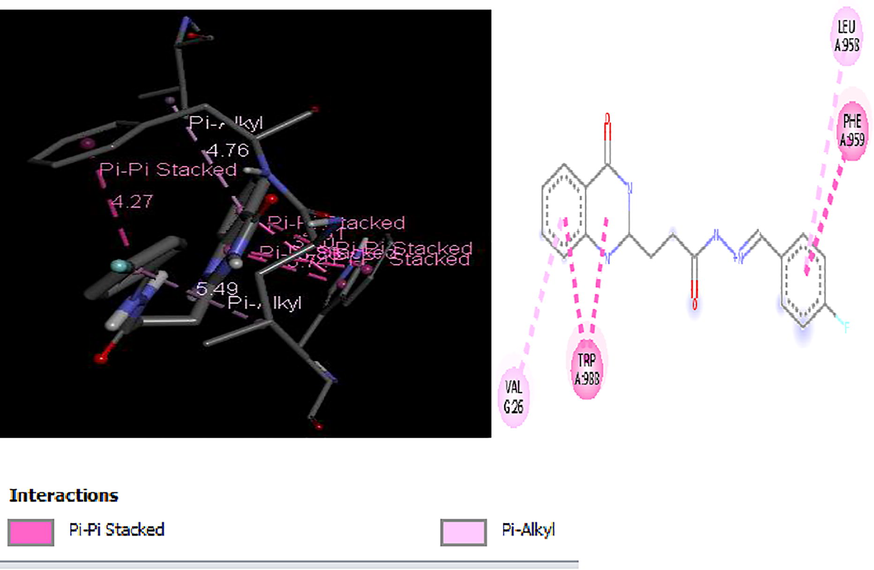
21→
−9.1
TRP988, TYR970
TRP988, TRP931
TRP931, TRP988 TRP988, VAL26
And VAL26
PHE959
3.44564, 4.09138
5.19086, 5.40558
4.12467, 4.64431
3.68473, 4.46669
5.12251 and 4.81825
23→
−9.1
LEU800, TYR131
VAL805, ARG979
ILE322, LEU800
And TYR131
ASP128, THR804 ASP128, ARG979 and ARG979
2.86576, 2.41345
2.91186, 2.49163
3.4651, 3.59175
5.57346, 4.62663
3.9855, 5.43005
5.33404 and
4.29436
25→
−9.3
TRP931, TRP931
TRP988, TRP931 TRP931, TRP988 LEU958, ALA966 and VAL26
3.8178, 3.73339
3.89195, 5.02769
3.98529, 3.73676
4.82498, 5.0897
And 4.60284
26→
−9.1
TRP931, TRP931
TRP988, TRP931 TRP931, TRP988 LEU958, ALA966 and VAL26TRP988, TRP988
4.47939, 4.45599
3.7481, 3.94136
3.98026, 4.67064
4.08594, 3.75553
4.79938, 5.06107
and 4.5588
3.2 Results of molecular docking studies of quinazolinone derivatives
Molecular docking studies of 30 quinazolinone derivatives were carried out and the docking scores of these compounds fall within the range of −7.2 to −9.3 kcal/mol. All the Compound were found to strongly inhibit the H+/K+-ATPase enzyme by totally inundating the efficient site in target protein, the result of docking analysis showed that all the docked ligands have lower energy value (high binding energy value) compared to the standard anti-ulcer drug (omeprazole) with it binding energy value of −6.37 kcal/mol. More also Figs. 3–6 depict the best low binding energy (high binding energy values) for the docked ligands. Among the 30 ligands that were docked with the enzyme (H+/K+-ATPase), ligand 25 is the most potent with the high docked score of −9.3 kcal/mol, ligands 21, 23 and 26, all with docked score of −9.1 kcal/mol, while 7, and 19 with docked score of −9.0 kcal/mol respectively, the docked ligand 25 configuration display hydrophobic interaction with TRP931, TRP988, LEU958, ALA966 and VAL26 and two electrostatic interaction TRP988, TRP988. These hydrophobic interactions indicated that ligand 25 bind deep in the core of active site where the reference ligand binds.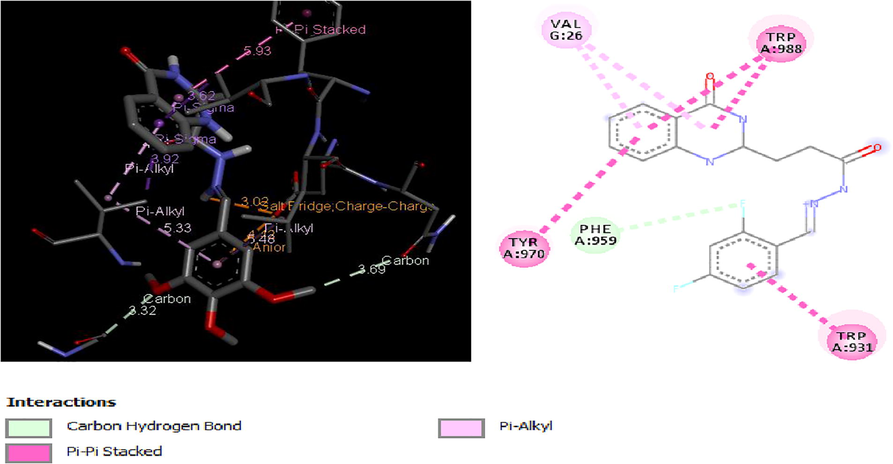
2D and 3D structure of Ligand-Receptor complex 21 (−9.1 kcal/mol).
2D and 3D structure of Ligand-Receptor complex 23 (−9.1 kcal/mol).
2D and 3D structure of Ligand-Receptor complex 25 (−9.3 kcal/mol).
2D and 3D structure of Ligand-Receptor complex 26 (−9.1 kcal/mol).
Furthermore, the high binding energy score of ligand 25 with other co-ligands was found to be better than those proposed by the work of other researchers.
4 Conclusion
Quantitative structure-affinity relationship (QSAR) and molecular docking studies were carried out on 30 compounds of quinazolinone derivatives as anti-ulcer compounds. The model from various physicochemical parameters corresponds to the essential feature of the Schiff-base family (quinazolinone). The best model with high correlation significant value (R2) of 0.8946 with active site enzyme (H+/K+-ATPase), the molecular docking analysis of quinazolinone analogs showed good binding affinity score of −9.3 kcal/mol against an enzyme responsible for the ulcer. The ligand was docked deeply within the binding pocket region forming double-double hydrophobic interaction with TRP931, TRP931 TRP988, TRP988 TRP931 TRP931, and one-one hydrophobic interaction with LEU958, ALA966, and VAL26. More also it was found that the result obtained where better than the one proposed by other researchers.
In addition, all the quinazolinone derivatives docked with H+/K+-ATPase enzyme were better than even the standard anti-ulcer drug (omeprazole). The physicochemical parameter used for molecular docking and quantitative structure-affinity relationship (QSAR) in this study were essential parameters to look into especially in improving the chance of new anti-ulcer drug as quinazolinone analogues, our QSAR result with high correlation coefficient R2 of 0.8946 and molecular docking result of −9.3 kcal/mol correspond with each other and give direction for design of ulcer inhibitors. This study will help in design and development of a drug which gives room for the synthesis of a new selective H+/K+-ATPase inhibitor with predetermined affinity and activity of the compound.
Acknowledgments
The authors sincerely acknowledge department of chemistry, Ahmadu Bello University, Zaria for its technical support and Dr. Sani Uba and Mr. Usman Abdulfatai for their advice in the course of this research.
References
- Molecular docking and quantitative structure-activity relationship study of anticonvulsant activity of aminobenzothiazole derivatives. Beni-Suef Univ. J. Basic Appl. Sci. 2017
- [Google Scholar]
- Agarwal, N., Bajpai, A., Srivastava, V., Gupta, S. P. 2013. A Quantitative Structure-Activity Relationship and Molecular Modeling Study on a Series of Biaryl Imidazole Derivatives Acting as H. Struct. Biol. 2013.
- Development of drugs based on Benzimidazole Heterocycle: Recent Advancement and Insights. IJCS. 2017;5(2):350-362.
- [Google Scholar]
- Peptic ulcer disease and non-steroidal anti-inflammatory drugs. Austr. Prescriber. 2017;40:91.
- [Google Scholar]
- Use of computer-assisted methods for the modeling of the retention time of a variety of volatile organic compounds: a PCA-MLR-ANN approach. J. Chem. Inf. Comput. Sci.. 2004;44:1328-1335.
- [Google Scholar]
- Peptic ulcer disease. Metabolism of Human Diseases. Springer; 2014.
- Synthesis and biological evaluation of 1, 3-diaryl pyrazole derivatives as potential antibacterial and anti-inflammatory agents. Bioorg. Med. Chem. Lett.. 2015;25(22):5052-5057.
- [Google Scholar]
- Synthesis, characterization, anti-ulcer action and molecular docking evaluation of novel benzimidazole-pyrazole hybrids. Chem. Cent. J.. 2017;11:85.
- [Google Scholar]
- Substituted methoxybenzyl-sulfonyl-1H-benzo [d] imidazoles evaluated as effective H+/K+-ATPase inhibitors and anti-ulcer therapeutics. Eur. J. Med. Chem.. 2017;139:454-460.
- [Google Scholar]
- Synthesis and SAR studies of potent H+/K+-ATPase inhibitors of quinazolinone-schiff’s base analogues. Bioorg. Chem.. 2016;68:1-8.
- [Google Scholar]
- Helicobacter pylori: the causative agent of peptic ulcer. Bayero J. Pure Appl. Sci.. 2009;2(2):79-83.
- [Google Scholar]
- The importance of being earnest: validation is the absolute essential for successful application and interpretation of QSPR models. Mol. Inf.. 2003;22:69-77.
- [Google Scholar]
- AutoDock Vina: improving the speed and accuracy of docking with a new scoring function, efficient optimization, and multithreading. J. Comput. Chem.. 2010;31:455-461.
- [Google Scholar]
- Role of non-steroidal anti-inflammatory drugs on intestinal permeability and nonalcoholic fatty liver disease. World J. Gastroenterol.. 2017;23:3954.
- [Google Scholar]
- PaDEL-descriptor: An open source software to calculate molecular descriptors and fingerprints. J. Comput. Chem.. 2011;32:1466-1474.
- [Google Scholar]


