

Translate this page into:
Molecular characterization of goats from Saudi Arabia using microsatellite markers
⁎Corresponding author. ahmahmoud@ksu.edu.sa (Ahmed Hossam Mahmoud)
-
Received: ,
Accepted: ,
This article was originally published by Elsevier and was migrated to Scientific Scholar after the change of Publisher.
Peer review under responsibility of King Saud University.
Abstract
This study is undertaken for genetic characterization of local Saudi goat populations for maintaining genetic variability of livestock population. Genomic DNA was extracted from three goat populations namely Ardi, Hollandi and Shami and subjected for genotyping using eighteen recommended microsatellite markers. The average values obtained for number of private alleles, effective number of alleles and different alleles 2.071, 5.343 and 9.389, respectively. The expected and observed heterozygosity values were 0.757 and 0.913, respectively. F- values were 0.081, −0.115, −0.18 and Shannon's Information Index was found to be 1.751. All loci were highly differed from Hardy-Weinburg Equilibrium and an average migrant’s value was 4.302. The maximum value was obtained between Hollandi and Ardi (8.474) and the value was extremely low between Shami and Ardi (2.518). Pairwise population of Fst and Nei's Genetic Distance showed very close relationship between Hollandi and Ardi goat population than between this population with the Shami. STRUCTURE software revealed 3 clusters at K = 3 in goat population. The present findings revealed genetic variations in Hollandi and Ardi populations. Molecular characterization of Saudi goats is important for maintaining and improving genetic resources.
Keywords
Saudi goats
Microsatellite marker
Population structure
Genetic variability

1 Introduction
Domestication, a complex and gradual process, is a mutualism between human and associated animal resulting in around 40 domesticated species of animals to justify his needs. Goat is one of the earliest animals domesticated by human around 10,000 years ago (Groeneveld et al., 2010). Domestic goats (Capra aegagrus hircus) were widely distributed all over the world with more than 500 breeds for meat, milk, butter, cheese, skin and fiber productions and they are used as a brush control too as well as in maintaining rural populations and in various traditional, social feasts. Goat is the one of the important domestic ruminant among other domestic ruminants and can survive under wide range of climatic conditions (Serrano et al., 2009). However, goats are very minimally considered by international community and several local breeds are facing possible extinction for different reasons. Thus, characterization of the genetic make-up of the endogenous breeds is an important issue for their optimum utilization (Galal, 2005) and avoiding the risk of loss of genetic variability among local goat breeds and their extinction through selection and inbreeding practices. Scientists recognized the need for the conservation of livestock resources. Therefore, studies on diversity and variability among local goat breeds were performed in many countries in Asia, Europe and Africa; with very few in the Middle Eastern countries even though, these countries hold around 54 goat breeds. Genetic diversity in livestock is a reservoir of traits that enables farmers to improve their stock and allows animals to adapt to changing conditions.
Molecular methods have been widely used to study the genetic variance among livestock. Polymerase chain reaction (PCR) technique is widely used to study the specific genetic material (DNA) in a controlled and logarithmic fashion. Numerous DNA markers have been used to study the genetic variance. Also, various types of genetic markers vary widely based on their content. In recent years, microsatellites are widely used to study the genetic variations in animal population. These microsatellites regularly found throughout the genetic material, polymorphic in nature and are highly stable and very simple to analyze. Hence, application of genetic markers in farm animals could show a bottleneck method of analyzing the genetic makeup of an individual and has been reported earlier by Blott et al. (1998). Genetic diversity among goat populations using microsatellites has been earlier studied by Cañón et al. (2006). Recently, genetic diversity has been studied using microsatellite markers by various researchers (Musthafa et al., 2018).
In Saudi Arabia, goat population is very high and serves as an important source of meat and milk exceeding 2.2 million head producing 22,500 tons of meat and 76, 500 tons of milk (FAOSTAT, 2008). They are very adapted to survive in low water resources, harsh climatic conditions and limited food availability. Ardi, Hollandi and Shami goats are three distinct Saudi Arabian goat breeds holding a special place in the Riyadh regional agribusiness economy (Al-saef, 2013). The naming of these native goats suggests some variability.
In Saudi Arabia, Ardi goat population is very high than other breeds and plays very important role in milk production. Hejazi (Pakistani, Indian or Hollandi) goats are usually black and long haired and used primarily for meat production. It is claimed that this breed was developed recently by the crossing Pakistani goat breed called “Kapla” breed native to a Pakistani province “Sindh” with two different local breeds, the “Ardi” and the “Cyprus Shami goats”. The Damascus goat, commonly known as Chami, Shami, Damascene, Baladi, Halep, Aleppo has unique shape of mouth and head raised originally in Lebanon, Cyprus and Syria and introduced to Saudi Arabia mainly for milk production. Few studies investigated the extent to which Saudi goat populations are genetically differentiated utilizing few or different microsatellite markers producing different outcomes, even with same breed (Aljumaah et al., 2012). Therefore, to preserve the genetic resources and to develop future comprehensive breeding programsin order to improve goat populations in Saudi Arabia, this study assessed the genetic variance between and within local goat populations in Riyadh region utilizing a set of 18 microsatellite markers.
2 Material and methods
2.1 Isolation of DNA and PCR amplification
Forty-eight Ardi (AR), 48 Holandi (HO) and 36 Shami (SH)) local goats were selected from a farm in Riyadh region of Saudi Arabia. About 10 ml of blood sample from each goat was collected aseptically and DNA was extracted from the sample using QIAgen DNeasy Kit according to the manufacturer’s instructions. NanoDrop 2000 spectrophotometer was used to analyze purity of extracted DNA and also quantified. A total of 18-microsatellite primer-pairs used to study the genetic variation which has been recommended previously to analyze the genetic variation of goats. A total of three markers were selected to study the level of polymorphism. DNA amplification was performed as described earlier by Kumar et al. The amplified DNA was analyzed using a spectrophotometer.
2.2 Statistical analyses
Heterozygosity analysis (HE), observed heterozygosity (Ho), private alleles (Np), effective number of alleles (Ne), observed number of alleles (Na) and allele frequency were calculated for every population as suggested by Kalinowski (2007) using Cervus version 3.0.3 software. GenePop version 4.0.10 software was used to analyze Wright's F-statistics, deviations from Hardy-Weinberg equilibrium (HWE), number of migrants exchanged between populations per generation as described previously by Raymond and Rousset (1995).
3 Results and discussion
Totally 18 microsatellites used in our study (Table 1) were found to be highly polymorphic with 3 (locus OarFCB128 of AR and HO, locus MAF209 of AR and locus OarJMP29 of SH) to 26 (locus MAF214 of HO) alleles per locus. This vast allelic diversity is very much useful for selection and show the suitability of these microsatellites for the analysis of diversity. The mean allelic value of 9.389 (Table 2) is higher than that reported for Iranian goats (Mahmoudi, 2010), in some Indian goat populations and lower than the value reported in some other goat populations in India (Dixit et al., 2011). For the same breeds, the mean number of alleles reported by Al-Atiyat and Aljumaah (2014) (8.25) for the Ardi goats and by Al-Atiyat and Aljumaah (2014) (7.25) for the Shami goats was lower than this of the same breeds reported in the present study (9.222 and 9.722 for Ardi and Shami goats, respectively). These differences may due to different sample size and/or number and type of microsatellites used. Higher genetic diversity analyzed this study might be also due to the larger effective number of alleles (5.343). This value compromised about 57% of the total number of alleles describing a large number of alleles at high frequency. A small number of effective alleles lead to a larger genetic drift from one generation to another. By population, SH had the highest number of private, effective and observed alleles was described in Table 2. Also, Locus MAF214 had the highest number of observed, effective and private alleles. The percentage of loci with private alleles was 41.79 (112 out of 268). The private alleles accentuate the uniqueness of the population and help in genetic differentiation between populations. The Shannon's Information Index (I) assessments (Table 3) revealed that all the loci were very informative making them very useful for genetic diversity studies. The values varied as low as 0. 0.340 (OarJMP29 of SH) to as high as 2.881 (MAF214 of AR), indicating great heterogeneity for the population. The mean (I) value (1.751) observed in this study was found to be higher than that of results reported in Gaddi goats (Singh et al., 2015); in Korki Jonub Khorasan, and in Jakhrana goats, but lower than that reported in Mahabubnagar goats by Raghavendra et al. (2017). *AR: Ardi, HO: Hollandi and SH: Shami. *AR: Ardi, HO: Hollandi and SH: Shami.
Locus Name
Sequences 5′ → 3′ Forward/Reverse
Label
Allele Size (bp)
Chromosomal Location
ILSTS005
GGAAGCAATGAAATCTATAGCC
56FAM
174–218
7
TGTTCTGTGAGTTTGTAAGC
MCM527
GTCCATTGCCTCAAATCAATTC
56-TAMN
165–187
5
AAACCACTTGACTACTCCCCAA
SRCRSP5
GGACTCTACCAACTGAGCTACAAG
5HEX
126–158
18
GTTTCTTTGAAATGAAGCTAAAGCAATGC
OarFCB128
ATTAAAGCATCTTCTCTTTATTTCCTCGC
56FAM
96–130
2
CAGCTGAGCAACTAAGACATACATGCG
HUJ616
TTCAAACTACACATTGACAGGG
56-ROXN
114–160
13
GGACCTTTGGCAATGGAAGG
OarHH47
TTTATTGACAAACTCTCTTCCTAACTCCACC
56-TAMN
130–152
18
GTAGTTATTTAAAAAAATATCATACCTCTTAAGG
ILSTS11
GCTTGCTACATGGAAAGTGC
56FAM
256–294
9
CTAAAATGCAGAGCCCTACC
DYMS1
AACAACATCAAACAGTAAGAG
56-TAMN
159–211
20
CATAGTAACAGATCTTCCTACA
BM8024
CTCTATCTGTGGAAAAGGTGGG
56-TAMN
110–130
1
GGGGGTTAGACTTCAACATACG
OarFCB226
CTATATGTTGCCTTTCCCTTCCTGC
5-HEX
119–153
2
GTGAGTCCCATAGAGCATAAGCTC
OarAE129
AATCCAGTGTGTGAAAGACTAATCCAG
56FAM
133–159
5
GTAGATCAAGATATAGAATATTTTTCAACACC
OarJMP29
GTATACACGTGGACACCGCTTTGTAC
56-ROXN
96–150
24
GAAGTGGCAAGATTCAGAGGGGAAG
SRCRSP9
AGAGGATCTGGAAATGGAATC
56FAM
99–135
12
GCACTCTTTTCAGCCCTAATG
MAF214
GGGTGATCTTAGGGAGGTTTTGGAGG
56FAM
174–282
16
AATGCAGGAGATCTGAGGCAGGGACG
OarCP34
GCTGAACAATGTGATATGTTCAGG
56-ROXN
112–130
3
GGGACAATACTGTCTTAGATGCTGC
OarFCB304
CCCTAGGAGCTTTCAATAAAGAATCGG
5-HEX
150–188
19
CGCTGCTGTCAACTGGGTCAGGG
MAF209
GATCACAAAAAGTTGGATACAACCGTGG
5-HEX
109–135
17
TCATGCACTTAAGTATGTAGGATGCTG
MAF65
AAAGGCCAGAGTATGCAATTAGGAG
56-TAMN
123–163
15
CCACTCCTCCTGAGAATATAACATG
Population*
AR
HO
SH
OVERALL
Locus
Na
Ne
Np
Na
Ne
Np
Na
Ne
Np
Na
Ne
Np
ILSTS005
6.000
3.454
0
4.000
3.034
1
15.000
5.378
9
8.333
3.955
3.333
MCM527
10.000
7.591
1
10.000
5.738
0
12.000
8.100
3
10.667
7.143
1.333
SRCRSP5
8.000
5.109
0
5.000
3.356
0
14.000
6.698
8
9.000
5.054
2.667
OarFCB128
3.000
2.593
0
3.000
2.571
0
7.000
4.334
7
4.333
3.166
2.333
HUJ616
4.000
2.768
0
5.000
3.060
0
10.000
3.661
7
6.333
3.163
2.333
OarHH47
14.000
10.716
3
11.000
8.056
0
4.000
2.114
0
9.667
6.962
1.000
ILSTS11
14.000
7.223
4
11.000
6.727
0
5.000
3.236
1
10.000
5.729
1.667
DYMS1
16.000
7.745
5
9.000
6.555
0
10.000
5.366
1
11.667
6.555
2.000
BM8024
10.000
5.103
2
8.000
5.969
0
5.000
3.951
0
7.667
5.008
0.667
OarFCB226
4.000
2.522
2
9.000
2.994
5
6.000
3.082
0
6.333
2.866
2.333
OarAE129
12.000
6.391
4
8.000
4.078
1
8.000
5.709
3
9.333
5.393
2.667
OarJMP29
6.000
2.783
1
6.000
2.793
1
3.000
1.185
1
5.000
2.253
1.000
SRCRSP9
10.000
5.696
0
11.000
8.502
1
9.000
6.014
1
10.000
6.737
0.667
MAF214
23.000
15.208
5
26.000
10.263
7
18.000
6.949
6
22.333
10.807
6.000
OarCP34
3.000
1.743
0
11.000
4.594
4
7.000
5.043
0
7.000
3.793
1.333
OarFCB304
13.000
8.113
1
10.000
6.518
0
15.000
6.968
2
12.667
7.199
1.000
MAF209
3.000
1.743
0
11.000
4.465
4
8.000
4.713
1
7.333
3.640
1.667
MAF65
7.000
4.024
0
8.000
4.876
0
19.000
11.368
10
11.333
6.756
3.333
Mean
9.222
5.585
1.556
9.222
5.230
1.333
9.722
5.215
3.333
9.389
5.343
2.074
SE
1.282
0.825
0.437
1.165
0.524
0.505
1.131
0.557
0.820
0.677
0.369
0.587
Population*
AR
HO
SH
ALL
Locus
I
Ho
HE
I
Ho
HE
I
Ho
HE
I
Ho
HE
ILSTS005
1.465
1.000
0.711
1.226
1.000
0.670
2.196
0.750
0.814
1.629
0.917
0.732
MCM527
2.119
1.000
0.868
1.939
0.833
0.826
2.269
0.889
0.877
2.109
0.907
0.857
SRCRSP5
1.790
0.896
0.804
1.306
0.938
0.702
2.221
0.944
0.851
1.772
0.926
0.786
OarFCB128
1.018
1.000
0.614
1.011
1.000
0.611
1.650
1.000
0.769
1.226
1.000
0.665
HUJ616
1.134
1.000
0.639
1.329
1.000
0.673
1.747
1.000
0.727
1.403
1.000
0.680
OarHH47
2.478
0.896
0.907
2.210
0.938
0.876
0.820
1.000
0.527
1.836
0.944
0.770
ILSTS11
2.205
0.958
0.862
2.121
1.000
0.851
1.268
1.000
0.691
1.865
0.986
0.801
DYMS1
2.286
0.771
0.871
2.005
0.917
0.847
1.944
0.972
0.814
2.078
0.887
0.844
BM8024
1.828
1.000
0.804
1.864
1.000
0.832
1.496
1.000
0.747
1.729
1.000
0.794
OarFCB226
1.044
0.917
0.604
1.582
0.896
0.666
1.352
1.000
0.676
1.326
0.938
0.648
OarAE129
2.067
0.958
0.844
1.637
1.000
0.755
1.897
1.000
0.825
1.867
0.986
0.808
OarJMP29
1.224
0.896
0.641
1.257
0.813
0.642
0.340
0.111
0.156
0.940
0.606
0.479
SRCRSP9
1.966
1.000
0.824
2.258
1.000
0.882
1.958
1.000
0.834
2.061
1.000
0.847
MAF214
2.881
0.958
0.934
2.757
0.958
0.903
2.318
1.000
0.856
2.652
0.972
0.898
OarCP34
0.751
0.542
0.426
1.841
0.896
0.782
1.751
0.917
0.802
1.448
0.785
0.670
OarFCB304
2.241
0.979
0.877
2.016
0.938
0.847
2.223
0.944
0.856
2.160
0.954
0.860
MAF209
0.751
0.542
0.426
1.826
0.917
0.776
1.736
0.917
0.788
1.438
0.792
0.663
MAF65
1.583
0.813
0.752
1.744
0.750
0.795
2.621
0.944
0.912
1.983
0.836
0.819
Mean
1.713
0.896
0.745
1.774
0.933
0.774
1.767
0.910
0.751
1.751
0.913
0.757
SE
0.147
0.034
0.037
0.104
0.017
0.022
0.133
0.049
0.041
0.073
0.021
0.019
Among various species and breeds or some times within breed heterozygosity level of a microsatellite varied considerably. All populations had qualitatively higher levels of genetic diversity confirmed by higher Ho and HEvalues and described in Table 3, making these microsatellites more suitable for analyzing genetic variation in goat population. Values of HO were higher than of HE values, indicating heterozygote excess in these populations. and belong to ou tbreeding systems as also indicated by the negative values of Fis (Table 4). In ou tbreeding, gene introgression and gene exchange is very common, which mainly increases heterogeneity in population (Wang and Yue, 2008). High rates of mutations at specific loci, and the large allele numbers detected could also be credited. The mean observed heterozygosity (0.913) was found to be higher than Asian goats populations, Korean goats, many Indian goats (Raghavendra et al., 2017); Sub-Saharan breeds, Spanish Guadarrama goats, West African dwarf goats, Croatian spotted breed and Albanian goats and was comparable with some Indian goat breeds and Sardinian goat population (Sechi et al., 2005). In the present study, the mean values of HEfor AR, HO and SH populations were 0.745, 0.774 and 0.751, respectively, with an overall mean of 0.757 throughout selected populations and markers. The highest value of 0.934 was for MAF214 locus in AR population which was lowest (0.156) in OarJMP29 locus of SH population, and the. The expected heterozygosity values obtained in our study is similar with the findings of Serrano et al. (2009) for Spanish Guadarrama goats, in Namibian goats, Agha et al. (2008) in Egyptian goats, Els et al. (2004) in Namibian goats, * Fis: the inbreeding coefficient for an individual relative to the total population; Fit: the inbreeding coefficient for an individual relative to a subpopulation; Fst: the inbreeding coefficient for a subpopulation relative to the total population. Nm: Gene flow estimated from FST, Nm = 0.25(1 − FST)/FST.
*Fis
Fit
Fst
Nm
ILSTS005
−0.253
−0.131
0.097
2.327
MCM527
−0.059
−0.028
0.029
8.370
SRCRSP5
−0.179
−0.058
0.102
2.205
OarFCB128
−0.504
−0.238
0.177
1.164
HUJ616
−0.472
−0.242
0.156
1.355
OarHH47
−0.227
−0.079
0.121
1.821
ILSTS11
−0.231
−0.129
0.083
2.780
DYMS1
−0.050
0.000
0.048
4.971
BM8024
−0.259
−0.207
0.041
5.784
OarFCB226
−0.446
−0.354
0.064
3.676
OarAE129
−0.221
−0.172
0.040
5.962
OarJMP29
−0.265
−0.121
0.114
1.949
SRCRSP9
−0.181
−0.142
0.033
7.404
MAF214
−0.083
−0.054
0.027
8.932
OarCP34
−0.171
−0.013
0.135
1.602
OarFCB304
−0.109
−0.084
0.022
10.975
MAF209
−0.193
−0.062
0.110
2.021
MAF65
−0.020
0.038
0.057
4.133
Mean
−0.218
−0.115
0.081
4.302
SE
0.033
0.023
0.011
0.703
The Fst values of the goat population varied between 0.022 and 0.177, showing various degrees of variation in genetic level between the different populations. This differentiation ether moderate or negligible. The mean value of Fst indicated that between population the variation is very low in genetic level (8.1%) and within breeds, variation is very high in genetic level (91.9%) corresponding to differences among individuals. The high number of migrants (Nm) for some loci exchanged between populations per generation (Table 4), indicated some degree of gene flow corresponding to the lower individual loci values of Fst (Fst < 0.05) which may avoid genetic drift due to the results of genetic variation. The highest genetic differentiation Fst value of 0.177 (locus OarFCB128) was recorded at the least number of migrants (1.164). The highest Nm value (10.975) and the least genetic differentiation coefficient (0.022) were recorded for locus OarFCB304. The number of migrations (Nm) between AR and HO (8.474) was higher than that between HO and SH (3.519) and between AR and SH (2.518) as Fst values reached 0.029, 0.066 and 0.090, respectively (Table 6). However, the overall value of 4.302 for Nm (Table 4) suggests some sharing in genetic level among goats population. This intermixing may be due to the results of these goats originate from the same region or bought from the same market or neighbor farm or some uncontrollable breeding among different breeds of the same farm. However, the three Saudi goat populations should all be considered as separate breeds since all pair wise Fst values were highly significant (P < 0.001). Most of goat studies indicated low genetic differentiation (Hoda et al., 2011).
Based on the analysis of Nei's unbiased genetic distance the pair wise population matrix (Table 5), goats from AR and HO are closely related (0.166), more than to goats from SH. The most distance was AR from SH population (0.789), with some relation between HO and SH populations (0.547). This was confirmed with the Nei's genetic identity matrix where goats sampled from AR population were 84.7% identical to those in HO population. AR and SH goats were only 45.4% identical to those in SH which is a moderate value though the least identical value. HO goats were 57.9% identical to those in SH population. The same results are reflected in the pair wise population Fst matrix represented in Table 6. All the populations were showed deviation from the equilibrium of Hardy-Weinberg (Table 7; P < 0.05) indicating a low level of inbreeding (Fis < 0.05). Only two loci (OarCP34 and MAF209) in AR and one locus (OarFCB226) in HO and (HUJ616) in SH were found to be Hardy–Weinberg equilibrium and was statistically significant (p > 0.05). Seven of the total fourteen microsatellite markers used in Aljumaah et al. (2012) study of Ardi goat population of Saudi Arabia, and 6 out of 11 markers in the goat population of Moxotó dairy and Alpine Saanen goat in Brazil showed Hardy Weinberg Equilibrium (HWE). The huge difference from HWE observed on goats of the present study could due the presence of alleles, called “null” alleles, size of homoplasy of microsatellite loci, high mutation rate and also because of small sample size (Araújo et al., 2006). However, this deviation could be related to excess heterozygous individuals than homozygous ones as noticed from higher HO than HE values reported in the present study. Factorial correspondence analysis (FCA) placed on 2-dimensional plane was used to analyze the relation between the individuals in genetic level used in the present study based on their allele frequencies and described in Fig. 1. The individuals of Shami, Hollandi and Ardi goat populations usually have their own groups. The first and second principle components (PC) explained 7.61% of the total difference and widely between these clusters. STRUCTURE analysis was carried out to elucidate the substructures of breeds within the population. Based on STRUCTURE analysis with no prior distribution specified, K = 3 had the highest ΔK (ΔK = 1821.25) and 3 was optimal value for K (Fig. 2). This analysis showed a strong signature of genetic structure grouping the accessions into three well differentiated clusters (Fig. 3) corresponding to the 3 goat populations. Concerning population demography fluctuations, Bottleneck results showed significant heterozygote excess within AR and HO populations at IAM and TPM mutation models (p < 0.01) indicating and Cornuet and Luikart (1996) previously earlier reported bottle neck. TPM is considered more appropriate for microsatellite analysis. Our results displayed no significant genetic bottleneck effect in the population of SH goat. *AR: Ardi, HO: Hollandi and SH: Shami. *AR: Ardi, HO: Hollandi and SH: Shami. *AR: Ardi, HO: Hollandi and SH: Shami.
Population
AR
HO
SH
AR
–
0.847
0.454
HO
0.166
–
0.579
SH
0.789
0.547
–
Population
AR
HO
SH
AR
0.000
8.474
2.518
HO
0.029
0.000
3.519
SH
0.090
0.066
0.000
Population*
AR
HO
SH
Locus
DF
ChiSq
Prob
Signif#
DF
ChiSq
Prob
Signif
DF
ChiSq
Prob
Signif
ILSTS005
15
81.488
0.000
***
6
42.688
0.000
***
105
185.639
0.000
***
MCM527
45
172.173
0.000
***
45
232.103
0.000
***
66
133.275
0.000
***
SRCRSP5
28
125.273
0.000
***
10
30.563
0.001
***
91
304.306
0.000
***
OarFCB128
3
48.000
0.000
***
3
48.000
0.000
***
21
46.903
0.001
***
HUJ616
6
48.000
0.000
***
10
48.000
0.000
***
45
48.754
0.325
ns
OarHH47
91
157.938
0.000
***
55
192.603
0.000
***
6
108.000
0.000
***
ILSTS11
91
189.482
0.000
***
55
201.392
0.000
***
10
23.117
0.010
*
DYMS1
120
293.155
0.000
***
36
135.102
0.000
***
45
198.296
0.000
***
BM8024
45
91.589
0.000
***
28
59.935
0.000
***
10
43.283
0.000
***
OarFCB226
6
34.367
0.000
***
36
31.596
0.678
ns
15
38.057
0.001
***
OarAE129
66
144.690
0.000
***
28
59.188
0.001
***
28
104.836
0.000
***
OarJMP29
15
70.754
0.000
***
15
39.858
0.000
***
3
36.132
0.000
***
SRCRSP9
45
81.767
0.001
***
55
136.029
0.000
***
36
86.771
0.000
***
MAF214
253
589.072
0.000
***
325
625.847
0.000
***
153
417.943
0.000
***
OarCP34
3
6.622
0.085
ns
55
147.092
0.000
***
21
53.294
0.000
***
OarFCB304
78
345.921
0.000
***
45
255.403
0.000
***
105
204.516
0.000
***
MAF209
3
6.622
0.085
ns
55
149.758
0.000
***
28
61.770
0.000
***
MAF65
21
38.755
0.010
*
28
55.091
0.002
**
171
288.310
0.000
***
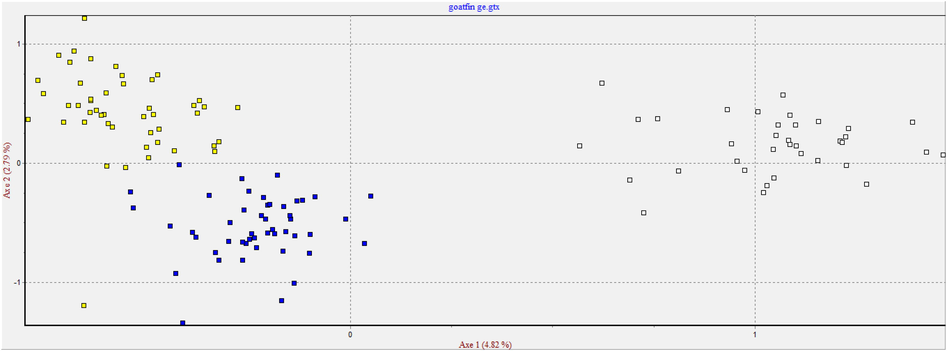
Scatter-plot of the factorial correspondence analysis (FCA) based on allele frequency of goat populations. Ardi genotypes (closed yellow squares); Hollandi genotypes (closed blue squares); Shami genotypes (empty squares).
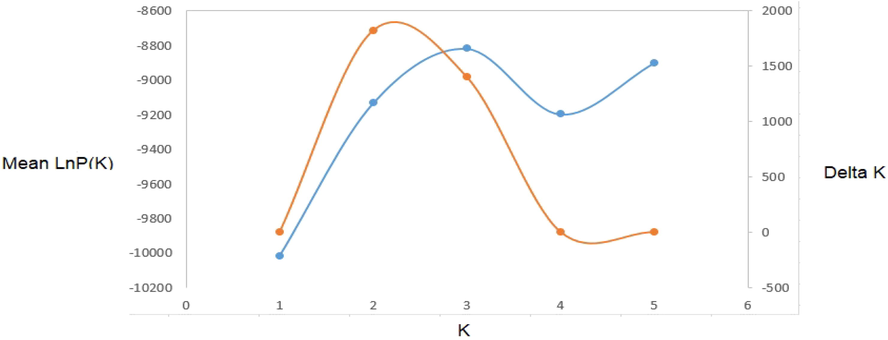
Determination of the best number of clusters from STRUCTURE analysis for microsatellite loci in goat populations.
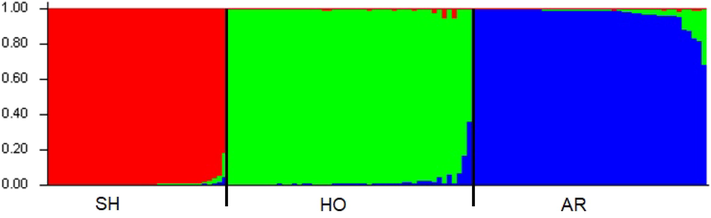
Bar plots from inferred population structure using the Bayesian grouping admixture model-based program STRUCTURE (K = 3).
4 Conclusion
The selected microsatellite markers are highly useful for the analysis of genetic variation in Saudi goats. Good breeding strategy is helpful to maintain heterozygosity in the goat population. The present findings displayed no significant genetic bottleneck effect in the population of SH goat in Saudi Arabia.
Acknowledgments
The authors extend their appreciation to The Researchers Supporting Project number (RSP-2019/108) King Saud University, Riyadh, Saudi Arabia.
Declaration of Competing Interest
The authors declare that they have no known competing financial interests or personal relationships that could have appeared to influence the work reported in this paper.
References
- Genetic diversity in Egyptian and Italian goat breeds measured with microsatellite polymorphism. J. Ani. Breed. Gen.. 2008;125:194-200.
- [Google Scholar]
- Genetic relatedness between Ardi, Black Bedouin and Damascus goat breeds. Genet. Mol. Res.. 2014;13:4654-4665.
- [Google Scholar]
- Genetic diversity of Ardi goat based on microsatellite analysis. Afr. J. Biotech.. 2012;11:16539-16545.
- [Google Scholar]
- Genetic and phenotypic parameters of body weights in Saudi Aradi goat and their crosses with Syrian Damascus goat. Small Rum. Res.. 2013;112:35-38.
- [Google Scholar]
- Genetic diversity between herds of Alpine and Saanen dairy goats and the naturalized Brazilian Moxotó breed. Gen. Mol. Biol.. 2006;29:67-74.
- [Google Scholar]
- Genetic variation within the Hereford breed of cattle. Ani. Ggenet.. 1998;29:202-211.
- [Google Scholar]
- Geographical partitioning of goat diversity in Europe and the Middle East. Ani. Genet.. 2006;37:327-334.
- [Google Scholar]
- Description and power analysis of two tests for detecting recent population bottlenecks from allele frequency data. Genetics. 1996;144:2001-2014.
- [Google Scholar]
- Genetic variability and bottleneck analyses of Kanniadu goat breed based on microsatellite markers. Indian J. Anim. Sci.. 2011;81:40.
- [Google Scholar]
- Genetic diversity of indigenous goats in Namibia using microsatellite markers: preliminary results. South Afr. J. Ani. Sci.. 2004;34(6):65-67.
- [Google Scholar]
- FAOSTAT, 2008. http://faostat.fao.org/default.aspx.
- Genetic diversity of Albanian goat breeds based on microsatellite markers. Arch. Zootec.. 2011;60:607-615.
- [Google Scholar]
- How many alleles per locus should be used to estimate genetic distances? Heredity.. 2007;88:62-65.
- [Google Scholar]
- Genetic diversity of Lori goat population based on microsatellite marker. Asian-Australas J. Anim. Sci.. 2010;4(1):13-19.
- [Google Scholar]
- Usability of metadata analysis of goat genetic resources among five countries from Africa, Asia and Europe: metadata analysis of goat genetic. Agr. Sci. Biotech.. 2018;10(3):183-190.
- [Google Scholar]
- Molecular characterization of Mahabubnagar goats based on microsatellite markers. The Pharma Innov. J.. 2017;6(5):130-133.
- [Google Scholar]
- Genepop (Version-1.2) - population-genetics software for exact tests and ecumenicism. J. Hered.. 1995;86:248-249.
- [Google Scholar]
- Genetic diversity of Sardinian goat population based on microsatellites. Ital. J. Anim. Sci.. 2005;4:58-60.
- [Google Scholar]
- Microsatellite based genetic diversity and population structure of the endangered Spanish Guadarrama goat breed. BMC Genet.. 2009;10:61.
- [Google Scholar]
- Genetic characterization of Gaddi goat breed of Western Himalayas using microsatellite markers. Vet. World. 2015;8:527-531.
- [Google Scholar]
- Genetic relationships of domestic sheep and goats in the lower reaches of the Yellow River based on microsatellite analysis. Biodiv. Sci.. 2008;16:53-62.
- [Google Scholar]


