

Translate this page into:
Modelling the Anticancer Activity of 4-Alkoxy Cinnamic Analogues using 3D-Descriptors and Genetic Algorithm-Multiple Linear Regression (GA-MLR) Method
⁎Corresponding author. firdaus@unhas.ac.id (Firdaus)
-
Received: ,
Accepted: ,
This article was originally published by Elsevier and was migrated to Scientific Scholar after the change of Publisher.
Peer review under responsibility of King Saud University.
Abstract
QSAR modelling as anticancer of 4-alkoxy cinnamic analogues has been done against their 3D descriptors. This modelling aims to develop the 4-alkoxy cinnamic analogues in better activity. We employed Kennard and Stone’s algorithm to split the data set into training and test set. Genetic Algorithm (GA) and Multiple Linear Regression (MLR) are used to select the influencing descriptors and to carry out statistically robust model.
pIC50 = 2.7350 (±1.0653) RDF145u − 2.2276 (±0.9655) RDF120m + 1.8369 (±1.1295) E2m − 1.5611 (±0.4518)
(R2training = 0.7436, R2test = 0.9812)
Coefficient of Y-randomization (cR2p) as one of model validation for the selected model gave a value of 0.6569 that greater than 0.5 identifying the model is powerful and not inferred by chance. Descriptors which influencing the activity are RDF145u, RDF120m, and E2m. RDF145u is radial distribution function-145/unweighted, RDF120m is radial distribution function-120/weighted by atomic mass and E2m is 2nd component accessibility directional WHIM index, weighted by atomic mass. Selected QSAR model used to design and predict some of new 4-alkoxy cinnamic analogues. There are 10 newly designed compounds that have a better prediction activity and have no violation in the drug likeness property based on the Lipinski rule.
Keywords
QSAR modelling
3D Descriptors
4-alkoxy cinnamic

- GA
-
Genetic Algorithm
- MLR
-
Multiple Linear Regression
- cR2p
-
Coefficient of Y-randomization
- RDF145u
-
Radial Distribution Function-145/unweighted
- RDF120m
-
Radial Distribution Function-120/weighted by atomic mass
- E2m
-
2nd component accessibility directional WHIM index, weighted by atomic mass
- DFT
-
Density Functional Theory
- DTC
-
Drug Theoretics and Cheminformatics
- R2
-
Coefficient of determination
- Q2
-
Cross validated
- h*
-
Leverage critical value
Abbreviations
1 Introduction
Cinnamic acid is one of chemical substances found in plants or fruit. Its derivatives have been identified as interesting compounds with multifunctional activities (Peperidou et al., 2017) such as inhibitor α-glucosidase (Adisakwattana et al., 2009), antimicrobial (Narasimhan et al., 2004), antifungal (Bisogno, 2007), antioxidant (Sova, 2012), and anticancer (J. A. do Vale, , 2022). As an anticancer, cinnamic acid derivatives are effectives to inhibit the growth of cancer in various type of cancers. One of their derivatives, cinnamaldyhde, inhibit and destroy the cancer cell through apoptosis mechanism. The other potential derivative of cinnamic acid is 4-alkoxy cinnamic group.
4-alkoxy cinnamic groups are a derivative of cinnamic acid that have been studied as anticancer through P388 leukemia cell line, which began when p-coumaramide successfully isolated from Kleinhovia Hospita L. and has IC50 value of 44 µg/mL (Firdaus, 2009). Modifications through the structure of 4-alkoxy cinnamic groups show the increasing and decreasing activity based on the type of functional group as the substituents. Despite as anticancer, this analogues were also reported as inhibitors of M. Tuberculosis (Adeniji et al., 2020) and α-glucosidase inhibitor (Ernawati et al., 2020). However, development of anticancer agent was in line with the increasing of inhibitor’s toxicity such cardiovascular toxicity that found as a side effect when threating by small molecule tyrosine kinase inhibitor. Perceived side effect can be hypertension, congestive heart failure, heart disease, etc (Brown et al., 2016). This side effect making a researcher should develop and found the new cancer inhibitors. One way to find a new potential drug molecule is by using computational drug design such as Quantitative Structure Activity Relationship (QSAR). This tool could understand the relationship between the structure compound and their activity (Iman et al., 2014).
QSAR analysis has been a common tool in novel drug design based on ligand approach. This computational tool helps the researchers to minimize the cost and time-consuming during synthesis stage. Qsar analysis of 4-alkoxy cinnamic derivatives has been performed as M. Tuberculosis inhibitors (Adeniji et al., 2020). However, QSAR study of 4-alkoxy cinnamic analogues as anticancer through P388 cell line has never been modelled. This research focused on the finding of the new 4-alokxy cinnamic derivatives as anticancer through QSAR analysis by using 24 compounds that we had synthesized since 2019 until now. In this 3D-QSAR analysis, Genetic Algorithm (GA) (Labjar et al., 2022) parallelized with Multi Linear Regression (MLR) were attempted (Jawarkar, 2022). GA is chosen to develop the QSAR equation since this algorithm has an effective and easy procedure to attempt in QSAR modelling (Serra et al., 2020). This algorithm is combined with MLR due to the transparency, effectiveness and the easy step to conduct this method in a good accuracy (Arthur et al., 2016). This study aims to develop the relationship between 4-alkoxy cinnamic structure and their activity to the P388 cell line, then predict a newly potent analogues to be synthesized in our next research.
2 Materials and method
2.1 Data collection
Twenty-three molecules of 4-alkoxy cinnamic analogues used in this research as potent anticancer through P388 cell line. All molecules were collected from some of our reported articles since 2012 until 2021 (Firdaus, 2009; Firdaus et al., 2017, Firdaus et al., 2018, Firdaus et al., 2019, Firdaus et al., 2020a, Firdaus et al., 2020b, Firdaus et al., 2021a, Firdaus et al., 2021b, Firdaus et al., 2021c). Bioactivity of all analogues was determined as inhibition concentration 50 % (IC50) then converted as logarithmic scale (pIC50) in order to obtain normal distribution. The structures and bioactivity values of analogues are shown in Table 1.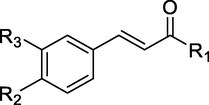 .
.
No.
R1
R2
R3
IC50
pIC50
1
–OCH3
–OH
-H
16.15
−1.21
2
–OCH3
–OCH3
-H
21.18
−1.33
3
–NH2
–OH
-H
44.00
−1.64
4
N-diethyl
–OH
-H
23.50
−1.37
5
N-propyl
–OH
-H
53.56
−1.73
6
N-butyl
–OH
–OH
0.609
0.22
7
N-benzyl
–OH
-H
16.15
−1.21
8
N-benzyl
–OH
–OH
674.38
−2.83
9
N-benzyl
–OH
–OCH3
179.56
−2.25
10
piperidinil
–OH
-H
5.34
−0.73
11
piperidinil
–OH
–OCH3
46.67
−1.67
12
piperidinil
–OH
–OH
0.861
0.06
13
pyrolidinil
–OH
-H
53.46
−1.73
14
pyrolidinil
–OH
–OH
11.35
−1.05
15
morpholine
–OH
-H
19.35
−1.29
16
morpholine
–OH
–OH
1.48
−0.17
17
–OH
–OCH3
10.79
−1.03
18
–OH
-H
1.0
0.00
19
–OH
–OCH3
29.14
−1.46
20

-OAc
-OAc
0.5
0.30
21

–OH
-H
5.89
−0.77
22

–OH
–OH
0.91
0.04
23
–OH
-H
16.97
−1.23
2.2 QSAR equation development
All analogues were drawn by using Avogadro software (Hanwell et al., 2012) as 3D structures then optimized using ORCA software by employing DFT B3LYP/6-31G(d,p) method. The reason for choosing DFT is due to this method could give a better performance than semiempirical method but still lower computational time than Ab Initio method (Schwöbel et al., 2011). After choosing DFT as the main method, then we were varying the density functional method and validated using 1H NMR data from one of derivative compounds. The result showed that DFT B3LYP/6-31G(d,p) showed the highest coefficient determinant value (R2) than the other density functional method such as LSDA, BPV86, and B3PW91.
Output file from optimization stage was then converted as.mol file type by using Open Babel software (O’Boyle et al., 2011). In this research, we employed PaDEL-Descriptor (Yap, 2011) software to obtain 3D-Descriptor of all analogues, which resulted 431 descriptors. Before dividing data into training and test set, we did normalization and data pretreatment. Data normalization aims to ensure that all descriptors data have the same opportunity in building a good qsar model (Adeniji et al., 2020). Data pretreatment used to remove the redundant data. The result of data pretreatment reduces the number of descriptors from 431 to only 306 descriptors. The software used for normalization and data pretreatment retrieved from Drug Theoretics and Cheminformatics (DTC) laboratory (dtclab.webs.com). After reducing the total descriptors, all data was divided into training and test set employing Data Division software also from DTC Lab by treating Kennard and Stone’s algorithm (Kennard and Stone, Feb. 1969). Training set data include 80 % of data and remaining data categorized as test set data for external validation purposes. QSAR models were developed by using BuildQSAR software (De Oliveira and Gaudio, 2000) applying Genetic Algorithm (GA) to select the influencing variable and Multi Linear Regression (MLR) to establish the qsar equation. Only three variables were selected due to the number of training set data which about 18 compounds. Each of qsar equations were evaluated through internal and external validations.
2.3 Internal and external validations
There are 4 qsar models resulted by variable selections in BuildQSAR. Each models were assessed using some of statistical parameters. Coefficient of determination (R2) is defined as:
where a good qsar model indicated if coefficient of determination equal to or more than 0.6, beside observed the R2 value, the difference between R2 and R2Adj was also calculated. If the difference is less than 0.3,the acceptability of total descriptors involved in the model.
Cross validated (Q2) is another statistical parameter used in this validation stage. Q2 is defined as:
Standard of Q2 value is more than 0.5 and the difference of R2 Q2 value should not more than 0.3 to give a good predictability.
Y-Randomization test is one of internal validation utilized in this stage. In this validation, a randomized R2 and Q2 which have a lower value than R2 and Q2 indicated that the qsar model is reliable (Tropsha et al., 2003). Coefficient of determination (cR2p) in Y-randomization value should be greater or near 0.5 which indicate that the model is acceptable.
External validation that used at this stage is coefficient of determination (R2test) value. A better qsar model has a coefficient of determination closed to 1. Additional statistical validation applied was the evaluation of the applicability domain of the selected qsar model. The leverage approach wasadopted in applicability domain. A good qsar model shown is if the leverage value lower than its critical value (h*), which defined as:
where k is the number of descriptors and n is the sum of training set compound (Teraishi, Aug. 2005).
2.4 Designing new analogues and evaluation of druglikeness property
New analogues were designed by changing the substituents (R1, R2, and R3) of the core structure. The selected qsar model represent three influencing descriptors, which are RDF145u, RDF120m and E2m. The better bioactivity of new analogues is resulted if it has a lower value of RDF120m than RDF145u and higher E2m. After getting the nest newly design compound, we evaluated the druglikeness property by using the Lipinksi rule of five in Swissadme web server (Daina et al., 2017). If the compound had a good predicted bioactivity, it should had no violation in the Lipinski rule (Yalcin, 2020).
3 Result and discussion
This study focused on development of QSAR model between 4-alokoxy cinnamic analogues and their bioactivity as anticancer in P388 cell lines. Kennard-Stone’s algorithm was chosen to divide the 3D descriptor data into training and test set data. To make sure that the resulted division data had a good quality, univariate analysis was attempted. Table 2 present the result of univariate analysis data and it shows that test set value (-1.6400 to 0.2200) was in line with training set value (-2.8300 to 0.3000). Standard deviation of training data is close to test data value. Thereby, Kennard-Stone’s algorithm applied has produced the test set data that reflects training set data.
Statistical parameters
Activity
Training set
Test set
Mean
−1.1256
−0.7640
Median
−1.2200
−1.0300
Standard deviation
0.8189
0.8303
Sample variance
0.6706
0.6893
Kurtosis
−0.0276
−2.7205
Skewness
0.0117
0.3532
Minimum
−2.8300
−1.6400
Maximum
0.3000
0.2200
Number of sample points
18
5
BuildQSAR software was used to obtain some of qsar models by using training set data. There were 4 qsar models produced and validated by some statistical parameters. Table 3 shows validation parameter resulted in each qsar models that generated from Genetic Algortihm (GA). All qsar models are eligible for the parameter of coefficient determination, but the selected qsar model is model 1 because it has the best value for some statistical parameters specifically in coefficient determination of test set data which about 0.9812, indicating the linear relationship in predicting bioactivity value.
No.
Parameters
Model 1
Model 2
Model 3
Model 4
1
R2training set
0.7436
0.7393
0.7584
0.7531
2
Adjusted R2
0.6887
0.6835
0.7066
0.7002
3
R2 – R2Adj
0.0549
0.0558
0.0518
0.0529
4
p
0.0002
0.0002
0.0001
0.0002
5
Q2
0.6195
0.6341
0.6443
0.6006
6
Next.test set
5
5
5
5
7
r2m (overall)
0.6829
0.5551
0.4957
0.5815
8
R2test set
0.9812
0.8639
0.7543
0.6293
The selected qsar model (Model 1) was conducted to calculate residual of the inhibition data between experimental and predicted data. Table 4 present the residual value of inhibition data, range of the difference value of experiment and predicted data is only about −0.89 until 0.69. This low residual value indicate that Model 1 is a good choice in predicted the inhibition value.
No.
Activity (pIC50)
Residual
No.
Activity (pIC50)
Residual
Experiment
Predicted
Experiment
Predicted
1a
−1.64
−1.56
−0.08
13b
−2.25
−2.46
0.21
2b
−1.73
−1.51
−0.22
14a
−1.03
−1.21
0.18
3a
−1.21
−1.16
−0.05
15b
−1.46
−1.55
0.09
4b
−0.73
−0.87
0.14
16b
0.04
−0.59
0.63
5b
−1.21
−1.53
0.32
17b
−1.23
−0.82
−0.41
6b
−1.33
−1.50
0.17
18a
0.22
−0.47
0.69
7b
−1.29
−0.85
−0.44
19b
0.06
−0.55
0.61
8b
−0.17
−0.79
0.62
20b
0.30
0.38
−0.08
9b
−1.73
−0.84
−0.89
21a
0.00
−0.56
0.56
10b
−1.05
−0.76
−0.29
22b
−0.77
−0.87
0.10
11b
−1.21
−1.26
0.05
23b
−1.67
−1.17
−0.50
12b
−2.83
−2.72
−0.11
The standardized residual was also evaluated through the experimental value that is shown in Fig. 1. General rule to figure out the standardized value is that it should has the value close to zero. If the residual is less than −2, the observed data is less than the predicted data (Jalali-Heravi and Kyani, 2004). In our result, there is only one point that close to −2. However, the other values show the range between 0 and
1, and the spread of values is close to 0.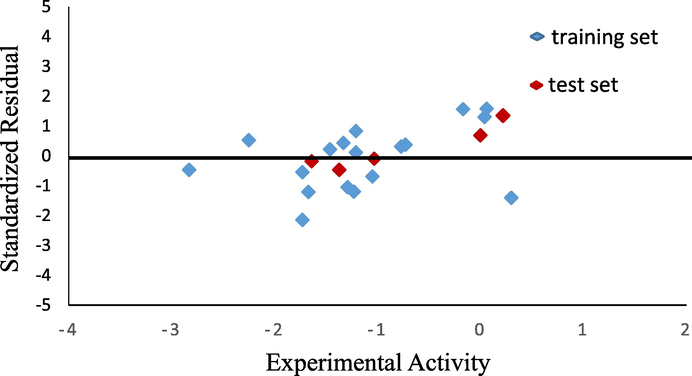
Graphical plot of standardized residual and experimental activity.
Despite of internal and external validation explained before, Y-randomization test was performed to check the accuracy of Model 1 in prediction of inhibition activity. Table 5 shows the result of Y-randomization test for Model 1. Ten random models were resulted and then compared its R, R2, and Q2 value to the original model (Model 1). The selected qsar model would be conclude as inaccurate if there is a strong correlation from the random R2 value (R2 > 0.5). Result of Y-randomization test shows that all of random models have a weak correlation to the bioactivities, thus the Model 1 could be inferred to have a responsive in predicted the bioactivities. Applicability domain is the last validation applied to Model 1. The critical value (h*) of this model is 0.67 and the cut off is
3. The William plot in Fig. 2 presents that there is no outlier in the training and test set data indicating the validity of the model. The QSAR equation of Model 1 resulted from Genetic Algorithm (GA) is.
Model
R
R2
Q2
Original
0.8620
0.7436
0.6190
Random 1
0.5160
0.2665
−0.5703
Random 2
0.3010
0.0905
−0.1961
Random 3
0.3150
0.0993
−0.7298
Random 4
0.2270
0.0513
−0.4004
Random 5
0.2020
0.0407
−0.4529
Random 6
0.5970
0.3569
−0.2629
Random 7
0.6780
0.4599
−0.0938
Random 8
0.2230
0.0497
−0.5161
Random 9
0.4990
0.2490
−1.1992
Random 10
0.4770
0.2276
−1.5962
Random models parameters
average R
0.4035
average R2
0.2395
average Q2
−0.4908
cR2p
0.6569
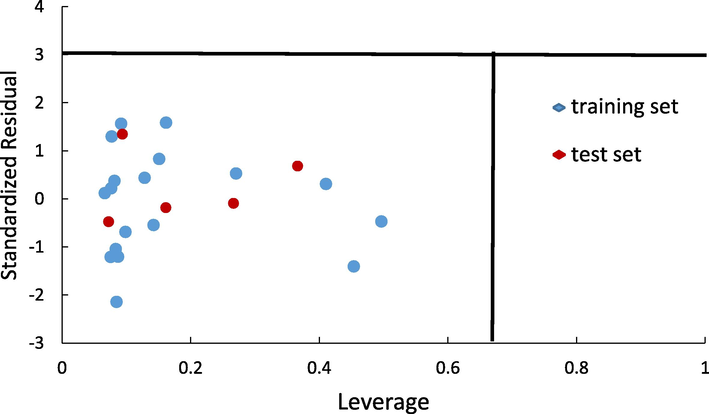
The William Plot of the standardized residuals vs the leverage value.
pIC50 = 2.7350 (±1.0653) RDF145u − 2.2276 (±0.9655) RDF120m + 1.8369 (±1.1295) E2m − 1.5611 (±0.4518).
where there are three descriptors involved in the equation, namely RDF145u, RDF120m, and E2m. RDF descriptor is one of geometrical descriptor that describe the molecular structure in space. The alphabet u in RDF145u means unweighted method, while the notation 145 related to the distance between two atoms by distance about 14.5 Å. RDF120m belongs to the radii which about 12 Å from the center atom and alphabet m means the relative mass used as weighted method (Arief et al., 2021). E2m is referred to one of Weighted Holistic Invariant Molecular (WHIM) descriptor, positive sign for this descriptor means a comprehensive distribution of the mass and polarizability to the second principal axis and it influences the anticancer activity by the high pIC50 (or lower IC50 value).
Comparison of the resulted qsar model presents in Table 6. Based on our literature study, qsar analysis that use 4-alkoxy cinnamic acid derivative as anticancer has never been conducted. Arthur et al. (2016) build a qsar model in the same bioactivity as anticancer in P388 cell line but different dataset (Arthur et al., 2016). The other qsar study used cinnamic acid derivatives but have a different bioactivity such as anti-mycobacterium tuberculosis and acetylcholinesterase inhibitor. This comparison shows the novelty of this research and the great impact for the development anticancer agent in the future. To improve the anticancer activity of 4-alkoxy cinnamic analogues, we have to find functional groups that can improve the number of RDF145u and E2m but lower RDF120m. The list of new designed compounds is presented in Table 7 and it shows that compound Q8 is the most active predicted compound which is derived from –NO2 substituent in R3 position. Even after we changed the amine in R1 position, it still shows that derivation of –NO2 substituent still give a better predicted activity. This result was in line by the previous research that showed a potential of –NO2 moiety in cinnamic acid derivatives could increase the bioactivity of the compounds (Ernawati et al., 2020). Evaluation of drug likeness property in Table 7 supports the ability of the newly design compounds to be use as a drug molecule due to the absence of violation in the Lipinski rule. Retrosynthetic analysis which is shown in Fig. 3 explain that compound Q8 is possible to synthesize by using p-methoxy cinnamic acid as the starting material. The synthesis pathway consists of three steps of reaction, namely chlorination, amidation (Castral, 2011) and nitration (Giles, 2004). However, further research still requires to make sure that these design compounds are safe in patient such as in vitro and in vivo test.
No.
Bioactivity
Kind of descriptors
R2train
R2test
Reference
1
Anticancer on P388 cell line
3D
0.7436
0.9812
Present study
2
Anticancer on P388 cell line
1D, 2D, 3D
0.9040
0.6700
(Arthur et al., 2016)
3
Anti-mycobacterium tuberculosis
1D, 2D, 3D
0.9809
0.8756
(Adeniji et al., 2020)
4
Acetylcholinesterase inhibitor
2D
0.79762
0.83852
(Thakur et al., 2022)
5
Anti-tubercular agents
1D, 2D, 3D
0.9429
0.8612
(Adeniji et al., 2018)
6
Acetylcholinesterase inhibitor
Molecular Descriptor
0.913
0.856
(Nekoeinia and Yousefinejad, 2021)
 .
.
Compound code
R1
R2
R3
IC50 (prediction)
Mr
(g/mol)Log P
Acceptor H-bond
Donor H-bond
Violation
Q1
–NH2
–OH
-CF3
7.9544
231.17
1.88
5
2
0
Q2
N-dietyl
–OH
-CF3
14.7049
259.22
2.43
5
2
0
Q3
N-propyl
–OH
-CF3
24.1760
273.25
2.69
5
2
0
Q4
N-propyl
–OCH3
-CF3
0.0209
287.28
2.94
5
1
0
Q5
N-butyl
–OCH3
-CF3
12.5831
301.30
3.19
5
1
0
Q6
N-benzyl
–OCH3
-CF3
0.5172
335.32
3.65
5
1
0
Q7
N-propyl
–OCH3
–NO2
4.9926
264.28
0.92
4
1
0
Q8
N-butyl
–OCH3
–NO2
0.0019
278.30
1.19
4
1
0
Q9
–NH2
–OCH3
–NO2
6.4998
222.20
0.08
4
1
0
Q10
Morfolil
–OCH3
-H
23.7601
247.29
1.05
3
0
0
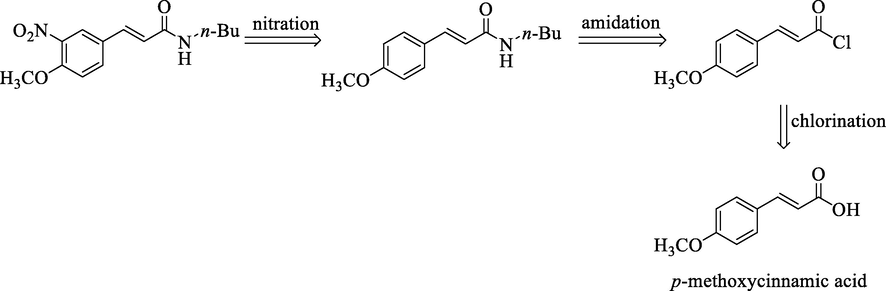
Retrosynthesis analysis of compound Q8.
4 Conclusion
A QSAR model between 3D descriptors and pIC50 data of 4-alkoxy cinnamic analogues has been developed using Genetic Algorithm (GA) and employing Multi Linear Regression (MLR) method. The contributed descriptors are RDF145u, RDF120m, and E2m. The model has satisfied some of statistical parameters in the internal and external validation. The selected model (Model 1) is applied to design new analogues and resulted that compound Q8 as the most active compound with IC50 prediction value about 0.0019 (µg/mL) and has no violation in the drug likeness property based on the Lipinski rule. This result contributes on the drug design field specially on the finding the new potential anticancer compound. The newly design compounds can be synthesized and tested through in vivo and in vitro.
Acknowledgements
The authors thank LPPM (Lembaga Penelitian dan Pengabdian Masyarakat) of Hasanuddin University for the research grant in the scheme of Basic Research in 2021. The authors also thank to DTC (Drug Drug Theoretics and Cheminformatics) Laboratory for the web software used in this research.
Declaration of Competing Interest
The authors declare that they have no known competing financial interests or personal relationships that could have appeared to influence the work reported in this paper.
References
- Theoretical modeling and molecular docking simulation for investigating and evaluating some active compounds as potent anti-tubercular agents against MTB CYP121 receptor. Futur. J. Pharm. Sci.. 2018;4(2):284-295.
- [CrossRef] [Google Scholar]
- Quantitative structure–activity relationship and molecular docking of 4-Alkoxy-Cinnamic analogues as anti-mycobacterium tuberculosis. J. King Saud Univ. - Sci.. 2020;32(1):67-74.
- [CrossRef] [Google Scholar]
- A series of cinnamic acid derivatives and their inhibitory activity on intestinal α-glucosidase. J. Enzyme Inhib. Med. Chem.. 2009;24(5):1194-1200.
- [CrossRef] [Google Scholar]
- In Silico Prediction of Betulinic Acid Derivatives’ Cytotoxicity: Relationship between Topological Descriptors and CC50 Value. Key Eng. Mater.. 2021;884:282-289.
- [CrossRef] [Google Scholar]
- Quantitative structure–activity relationship study on potent anticancer compounds against MOLT-4 and P388 leukemia cell lines. J. Adv. Res.. 2016;7(5):823-837.
- [CrossRef] [Google Scholar]
- Structure - Antifungal activity relationship of cinnamic acid derivatives. J. Agric. Food Chem.. 2007;55:10635-10640.
- [Google Scholar]
- Cardiovascular toxicities of small molecule tyrosine kinase inhibitors: an oppurtunity for systems-based approaches. Clin. Pharmacol. Ther.. 2016;101(1):65-80.
- [Google Scholar]
- Synthesis of a combinatorial library of amides and its evaluation against the fall armyworm, Spodoptera frugiperda. J. Agric. Food Chem.. 2011;59(9):4822-4827.
- [CrossRef] [Google Scholar]
- SwissADME: A free web tool to evaluate pharmacokinetics, drug-likeness and medicinal chemistry friendliness of small molecules. Sci. Rep.. 2017;7(January):1-13.
- [CrossRef] [Google Scholar]
- BuildQSAR: a new computer program for QSAR analysis. Quant. Struct.-Act. Relat.. 2000;19:599-601.
- [CrossRef] [Google Scholar]
- Synthesis of cinnamic acid ester derivatives with antiproliferative and antimetastatic activities on murine melanoma cells. Biomed. Pharmacother.. 2022;148
- [CrossRef] [Google Scholar]
- Synthesis of cinnamamide derivatives and their α-glucosidase inhibitory activities. Sains Malaysiana. 2020;49(2):315-322.
- [CrossRef] [Google Scholar]
- Synthesis and activity of N-(o-tolyl)caffeamide and N-(o-tolyl)-p-coumaramide against P388 leukemia murine cells. J. Phys. Conf. Ser.. 2019;1341(3)
- [CrossRef] [Google Scholar]
- Firdaus et al., 2021. Phenethyl p-coumarate and N-Phenethyl-p-coumaramide: synthesis, characterization. docking studies, and anticancer activity through P388 cell, Sains Malaysiana, 51(4) 1085–1097, http://dx.doi.org/10.1016/j.encep.2012.03.001.
- Novel hydroxycinnamamide from morpholine and pyrrolidine: Synthesis, characterization, docking study, and anticancer activity against P388 leukemia murine cells. J. Appl Pharm. Sci.. 2020;11(01):40-48.
- [CrossRef] [Google Scholar]
- Synthesis of Piperidine and Morpholine Amides of Ferulic Acid and their Bioactivity against P-388 Leukemia Cells. Int. J. ChemTech Res.. 2017;10(1):27-33.
- [Google Scholar]
- Sintesis Senyawa p-Hidroksisinamamida dari Asam p-Hidroksisinamat Melalui Reaksi Esterifikasi dan Amonolisis. J. Chem. Acta. 2009;2(2)
- [Google Scholar]
- Synthesis of a cinnamic acid derivative and bioactivity as an anticancer based on Result Quantitative Structure Activity Relationship (QSAR) analysis. Indones. Chim. Acta. 2020;13(1):23-29.
- [Google Scholar]
- Phenethyl ester and amide of Ferulic Acids: Synthesis and bioactivity against P388 Leukemia Murine Cells. J. Phys. Conf. Ser.. 2018;979(1):pp.
- [CrossRef] [Google Scholar]
- A Caffeic Acid Derivative Potential for Anticancer. Indones. Chim. Acta. 2021;13(2):38-42.
- [CrossRef] [Google Scholar]
- N-Benzylhydroxycinnamamides: Synthesis, Docking Study and Cytotoxicity against Leukemia Murine P388 Cells. Iran. J. Chemsitry 2021
- [Google Scholar]
- Development of a manufacturing process for sibenadet hydrochloride, the active ingredient of viozan. Org. Process Res. Dev.. 2004;8(4):628-642.
- [CrossRef] [Google Scholar]
- Avogadro: an advanced semantic chemical editor, visualization, and analysis platform. J. Cheminform.. 2012;4(17):1-17.
- [Google Scholar]
- QSAR study of chalcone derivatives as anti- Leishmania agents. Turkish J. Chem.. 2014;38:716-724.
- [CrossRef] [Google Scholar]
- Use of computer-assisted methods for the modeling of the retention time of a variety of volatile organic compounds: A PCA-MLR-ANN approach. J. Chem. Inf. Comput. Sci.. 2004;44(4):1328-1335.
- [CrossRef] [Google Scholar]
- QSAR based virtual screening derived identification of a novel hit as a SARS CoV-229E 3CLpro Inhibitor: GA-MLR QSAR modeling supported by molecular Docking, molecular dynamics simulation and MMGBSA calculation approaches. Arab. J. Chem.. 2022;15(1):103499
- [CrossRef] [Google Scholar]
- Computer aided design of experiments. Technometrics. Feb. 1969;11(1):137-148.
- [CrossRef] [Google Scholar]
- QSAR Anti-HIV Feature Selection and Prediction for Drug Discovery Using Genetic Algorithm and Machine Learning Algorithms BT - Computational Intelligence in Recent Communication Networks. In: Ouaissa M., Boulouard Z., Ouaissa M., Guermah B., eds. Computational intelligence in Recent Communication Networks. Cham: Springer International Publishing; 2022. p. :191-204.
- [Google Scholar]
- Esters, amides and substituted derivatives of cinnamic acid: synthesis, antimicrobial activity and QSAR investigations. Eur. J. Med. Chem.. 2004;39:827-834.
- [CrossRef] [Google Scholar]
- QSAR analysis of the acetylcholinesterase inhibitory activity of some tertiary amine derivatives of cinnamic acid. Struct. Chem.. 2021;32(3):1123-1132.
- [CrossRef] [Google Scholar]
- Multifunctional cinnamic acid derivatives. Molecules. 2017;22(1247):1-17.
- [CrossRef] [Google Scholar]
- Prediction models for the Abraham hydrogen bond donor strength: Comparison of semi-empirical, ab initio, and DFT methods. J. Phys. Org. Chem.. 2011;24(11):1072-1080.
- [CrossRef] [Google Scholar]
- MaNGA: a novel multi-niche multi-objective genetic algorithm for QSAR modelling. Bioinformatics. 2020;36(1):145-153.
- [CrossRef] [Google Scholar]
- Antioxidant and antimicrobial activities of cinnamic acid derivatives. Mini-Reviews Med. Chem.. 2012;12:749-767.
- [Google Scholar]
- ZD1839 (Gefitinib, ‘Iressa’), an epidermal growth factor receptor-tyrosine kinase inhibitor, enhances the anti-cancer effects of TRAIL in human esophageal squamous cell carcinoma. FEBS Lett.. 2005;579(19):4069-4075.
- [CrossRef] [Google Scholar]
- Thakur, A., Parashar, A., Sharma, V.K., Kumar, A., Mehta, V., 2022. 2D-QSAR and Molecular Docking based virtual screening of the herbal molecules against Alzheimer’s Disorder: An approach to predict CNS activity, bioRxiv, p. 2022.10.08.511422, doi: 10.1101/2022.10.08.511422.
- The importance of being earnest: validation is the absolute essential for successful application and interpretation of QSPR models. QSAR Comb. Sci.. 2003;22(1):69-77.
- [CrossRef] [Google Scholar]
- Molecular Docking, Drug Likeness, and ADMET Analyses of Passiflora Compounds as P-Glycoprotein (P-gp) Inhibitor for the Treatment of Cancer. Curr. Pharmacol. Reports. 2020;6(6):429-440.
- [CrossRef] [Google Scholar]
- PaDEL-Descriptor: an open source software to calculate molecular descriptors and fingerprints. J. Comput. Chem.. 2011;32:1466-1474.
- [CrossRef] [Google Scholar]


