

Translate this page into:
Modeling radical scavenging activity using molecular descriptors of unclassified compounds
* Corresponding author E-mail address: jkyang@gnu.ac.kr (Jae-Kyung Yang)
-
Received: ,
Accepted: ,
Abstract
The overproduction of reactive oxygen species (ROS) leads to oxidative stress, which is associated with many human diseases. Antioxidants counteract the effects of ROS, but traditional assays are costly and time-consuming. Quantitative structure-activity relationship (QSAR) models offer a predictive alternative. We developed a QSAR model using data from 3133 unclassified antioxidant compounds using extreme gradient boosting (XGBoost), random forest (RF), and support vector machine (SVM) algorithms. Molecular descriptors were calculated using RDKit, and 82 were selected based on importance. The XGBoost model showed superior predictive performance, with good agreement with the experimental data (R2 = 0.81). Descriptor analysis revealed a significant influence of phenolic groups on antioxidant activity. This research provides valuable insights for those wishing to predict antioxidant activity from unclassified compound structure data and has implications for industries such as drug discovery and efficacy evaluation. Through a large-scale analysis of 3133 unclassified antioxidant compounds, we present an advanced QSAR model covering a wide pIC50 range (-0.98-10.30). Unlike previous studies of restrictively classified compounds, we have achieved universality, which is expected to contribute to effective antioxidant activity prediction and candidate discovery.
Keywords
Antioxidant
QSAR
RDkit
SHAP
XGboost

1. Introduction
Excessive production of reactive oxygen species (ROS) due to oxidative stress plays a significant role in the onset of human diseases (Halliwell, 1991). ROS free radicals cause damage to proteins, lipids, and DNA (Mathew et al., 2011) and negatively impact the cell division cycle (Verbon et al., 2012), potentially leading to malignant tumors and various diseases (Nishikawa, 2008).
The human body has several mechanisms to prevent and recover from damage caused by ROS. Antioxidant compounds play crucial roles in these mechanisms (Thorpe et al., 2004). Antioxidants function by disrupting free radical chain reactions and chelating metal ions (Rice-Evans, Catherine, 1995). These compounds, found in various fruits, vegetables, flowers, and roots, have been used in traditional medicine because of their positive effects on human health (Brewer, 2011).
A variety of methods have been devised to assess the antioxidant capacity of compounds, among which in vitro chemical analyses are the most employed. Among these, the 2,2-diphenyl-1-picrylhydrazyl (DPPH) radical-scavenging capacity analysis has been widely used (Kedare and Singh, 2011). This analysis measures the quantity of DPPH converted from a purple to a relatively stable yellow compound using a spectrophotometer. However, these methods are affected by environmental factors and have limitations that make them expensive and time-consuming, with results varying depending on the skill of the experimenter (Schaich et al., 2015).
When measuring the antioxidant activity, the chemical reactivity of a compound depends on its structure (Rice-Evans, Catherine A. et al., 1996). From the structure of an antioxidant, many features (descriptors) can be obtained through programmatic calculations. Theoretically predicted antioxidant activities using descriptors calculated from compound structures have been shown to be in good agreement with experimentally measured antioxidant activities (van Acker et al., 1993). Therefore, researchers have proposed utilizing a quantitative structure-activity relationship (QSAR) approach to predict antioxidant activity based on the structural properties of compounds.
Recently, QSAR has been extensively used to develop models for predicting the activity of antioxidant compounds by employing descriptors obtained from the calculated chemical structures alongside various physicochemical parameters, with appropriate programs (Karelson et al., 1996).
Rasulev et al. (2005) used a machine learning (ML) approach with molecular descriptors obtained from density functional theory (DFT) to accurately predict the antioxidant activity of 27 flavonoids. Using multiple linear regression (MLR) combined with a genetic algorithm, we achieved an accuracy level of R2 of 0.874 and Q2 of 0.808. Djeradi et al. (2014) also predicted the antioxidant activity of 24 flavonoids with an MLR model using DFT (R2: 0.82). Duchowicz et al. (2019) predicted the antioxidant activity of 23 anthocyanins with an MLR model using prospective information on the compositional and topological molecular characteristics (R2: 0.85 and Q2: 0.51). Shi predicted the antioxidant activity of 75 phenolic compounds with four descriptors: n(OH), Cosmo Area (CA), core-core repulsion (CCR), and final heat of formation (FHF). Compared to the MLR model, the support vector machine (SVM) showed higher predictive power (R2: 0.92, Q2: 0.91). Spiegel et al. (2020) predicted the antioxidant activity of 22 phenolic acids with an MLR model using DFT (R2: 0.99, Q2: 0.97). Important features (descriptors) have been identified to improve the prediction accuracy of the QSAR model. The use of the identified descriptors can reduce unnecessary computations in the model, and higher model accuracy can be achieved (Bajorath, 2001). Studies have successfully predicted antioxidant activity from flavonoid and phenolic compounds, but previous studies mainly focused on small sets of compounds (20–75) within specific categories, such as flavonoids or phenolic acids, using MLR or SVM. These models are limited to predicting the antioxidant activity of specific compounds. Sufficient data is needed to predict the antioxidant activity of a wide range of compounds.
In addition, while MLR models are used in most reaches, boosting and bagging models, such as the extreme gradient boosting (XGBoost) and random forest (RF), have gained traction in recent research (Hadi et al., 2023; Korial et al., 2024). A few studies have shown that SVM has a higher prediction rate than MLR (Shi, 2021). Different algorithms, such as XGB, RF, and SVM, should be tried in the development of QSAR models. To the best of our knowledge, there is a lack of reporting on the use of XGBoost in QSAR models.
The primary objective of this study is to use compounds as a single dataset for a QSAR model without classifying them. By employing an extensive and unclassified collection of compounds as training data for the model, we can enhance our understanding of the molecular structural features that impact antioxidant activity, thereby aiding in the identification and assessment of potential antioxidants. To enhance the accuracy of the QSAR models, we implemented the XGBoost algorithm, which has been recently recognized for its effective performance. The developed QSAR model can contribute to experiments by predicting the antioxidant capacity of compounds by computer calculations without being influenced by factors such as environment or the experience of an examiner in measuring the antioxidant capacity, encountered in traditional experiments. The main contributions of this study can be summarized in the following points.
-
1.
Develop a QSAR model for predicting DPPH antioxidant activity based on an extensive database of unclassified antioxidants
-
2.
Utilize a RF algorithm to select the most useful descriptors.
-
3.
Evaluate the performance of the proposed QSAR model using the metrics proposed by Tropsha (2010).
2. Materials and Methods
2.1 Data collection
The dataset included 3,133 records of in vitro antioxidant measurements, compound names, experimental activities, and simplified molecular-input line-entry system (SMILES) data, sourced from an antioxidant database (https://aodb.idruglab.cn/) (Deng et al., 2023, Weininger, 1988). The radical scavenging activity against DPPH was expressed as IC50 (nM). IC50 values were converted to pIC50 values by applying the -log10 method. The pIC50 values ranged from -0.98 to 10.30. SMILES comparisons were used to identify duplicate structures, and rows with duplicate smiles were removed to keep a single representation to avoid data bias. Oversampling and undersampling were not performed due to the small number of outliers (Supplementary Fig. S1).
The dataset’s compounds were divided into training and test sets, where the training set included 2,506 compounds and the test set contained 627 compounds.
2.2 Calculation of molecular descriptors
Molecular descriptors are simple mathematical expressions used to encode the chemical and structural features of a molecule. Molecular descriptors were calculated using the Python open-source RDKit library (Landrum, 2013). The descriptors were calculated using the RDKit module after the conversion of SMILES to Mol.
During model development, highly collinear molecular descriptors were carefully excluded. Testing and removal of descriptors that encode similar molecular information and those with little variation (descriptors with a Pearson correlation coefficient absolute value greater than 0.9) are important because collinear descriptors encode similar information. Subsequently, high-impact descriptors were selected using an RF model. This method involves plotting the correlation-coefficient values obtained for the different cutoffs of the descriptor significance included in each model to analyze the statistical quality improvement of the model. Hence, 82 descriptors that could be used to develop linear and non-linear models were screened.
2.3 QSAR model development
QSAR was used to predict the antioxidant activity of the compounds. The QSAR model was trained using three algorithms: XGBoost, RF, and SVM.
2.3.1 Extreme gradient boosting model algorithm
XGBoost is a supervised learning algorithm based on gradient boosting, designed to mitigate overfitting while facilitating parallel processing. Gradient boosting is an algorithm that sequentially adds new learning models with weights to minimize the learning errors of several weak decision tree (DT) (Zhang and Haghani, 2015). A new learning model was created at every step instead of modifying the existing learning models. The error in the model was reduced using gradient descent. XGBoost applies penalties to loss functions to prevent overfitting of the training data. Furthermore, the drawback of consuming significant learning resources, owing to the sequential data learning characteristics of the gradient model, can be resolved through parallel processing (Chen et al., 2015).
Many ML algorithms face the black box problem, which refers to the challenges in observing or understanding how an ML algorithm operates internally. Our research applied SHapley Additive exPlanation (SHAP), which introduce an algorithm based on SHAP values from game theory, to solve the black-box problem in the model (Merrick and Taly, 2020). The SHAP values, which indicate the impact of the input data on the prediction results in terms of direction and magnitude, were calculated. This explains the contributions of the input variables to the output values of the model.
2.3.2 Random forest model algorithm
RF is a supervised learning algorithm applied to a wide range of classification and regression tasks (Biau and Scornet, 2016). RF models integrate several DTs to form an ensemble regressor and predict outcomes by averaging the output values of each DT. If the number of DTs is sufficient, RF reduces the overall variance and prediction error by averaging the uncorrelated trees, thus avoiding model overfitting. An RF with bagging characteristics can maintain its accuracy even if some data are missing.
2.3.3 Support vector machine model algorithm
SVM is one of the algorithms used for various classification and regression problems (Suthaharan and Suthaharan, 2016). A major advantage of the SVM is the adoption of the structural risk minimization principle, which is superior to the empirical risk minimization principle used in conventional neural network structures. Therefore, SVM is less vulnerable to overfitting. Furthermore, it demonstrates robustness against outliers and performs well in predicting data with values that differ from the general pattern.
2.4 K-fold-cross validation
Cross-validation is a model validation technique used to test what kind of results an analysis created by a machine learning algorithm would produce on an independent dataset. For this study, we chose a k value of 5 for k-fold cross-validation, which means we divided the dataset into five subsets with similar proportions of each class represented in each subset. Training and testing were performed in five iterations. In each iteration, one subset was used for testing, and the rest (four subsets) were used for training. Each subset was also used for testing once at the same time (Anguita et al., 2012).
2.5 Model optimization
The hyperparameters of the learning algorithm were optimized using a grid search method, which is a decision-theoretic approach that searches for the optimal configuration by sequentially applying fixed hyperparameter values (Yang and Shami, 2020). Select the hyperparameters to tune and determine the search range. Get all possible combinations and optimize them to have the smallest root mean square error (RMSE) value.
2.6 Model evaluation and validation
Model validation is crucial in the development of QSAR models. Various methods and statistical parameters were used for model evaluation. When there are no restrictions on the applicability domain, each model can theoretically forecast the activity of any compound, including those with structures entirely distinct from those in the training set. Consequently, lacking an applicability domain, a critical element of QSAR models, may cause undue extrapolation across chemical space. This can significantly increase the risk of making inaccurate predictions.
Therefore, it is advised to adhere to a specific set of statistical criteria that the prediction model must meet. For continuous QSAR, the recommended guidelines for creating activity/property predictors include the following. The slope (K, K’) between the predicted and actual observed values should be calculated to evaluate the linear relationship between the two variables. Cross-validation determination coefficient (Q2) should be used to assess the generalization ability of the model, calculated through cross-validation of the training set. The correlation-coefficient (R) measures the strength of the correlation between predicted and observed values. The determination coefficient (R2) indicates how well the model predictions explain the actual observed values. R02 and R’02 are calculated through linear regression using the regression of observed values for the predicted values and the regression of predicted values for the observed values, respectively. These were used to assess the extent to which the model predictions matched the actual observed values. The validation criteria outlined by Tropsha for a model to be deemed acceptable include the following specifications:
Models that meet these conditions are considered to have reliable predictive power (Tropsha, 2010).
3. Results and Discussion
3.1 Descriptor screening
As mentioned previously, the quantitative relationship between the activity and structural characteristics of antioxidant compounds was investigated using linear and non-linear models. The main step in descriptor screening is the selection of the most influential descriptors. During model development, care was taken to avoid including highly linear molecular descriptors. Descriptors with high Pearson correlation coefficients may encode similar molecular information, and the model may learn redundant information, leading to overfitting. Therefore, it was important to test the descriptors and remove those with low variation and those that encode hereditary information (Fatemi and Gholami Rostami, 2013).
The pIC50 values in our study show a large variation from -0.98 to 10.30, which suggests that while covering a wide spectrum from low to high activity increases the versatility of the model, it may also increase the prediction error somewhat in the extreme value range. Therefore, further experimental validation is suggested as future work to improve the accuracy in this range.
We performed a Pearson correlation analysis of the descriptors to remove those with absolute correlation values greater than 0.9 (Fig. 1). Then, 82 descriptors were selected by using an RF algorithm to evaluate attribute importance. Subsequently, descriptors with attribute importance greater than 0.0025 were screened (Fig. 2). These selected descriptors were used for training the QSAR models. In our research, we employed three ML algorithms, XGBoost, RF, and SVM, to train the QSAR models.

- Heatmap of Pearson correlation coefficients for the selected 82 descriptors.

- The relationship between R2 values and the count of descriptors, along with their significance in the random forest model.
3.2 Hyperparameter optimization and QSAR model SHAP analysis
In the QSAR modelling process, we used a grid search method to select the hyperparameters of the model and found the hyperparameters with the lowest RMSE, i.e. C, the optimal hyperparameters. The lower the RMSE, the better the performance of the model. We applied the 5-fold cross-validation method to optimize the hyperparameters using only the training data set and calculated the cross-validation correlation coefficient (Q2). When comparing the RMSE values of the three ML algorithms, the XGBoost model had the lowest value (Hodson, 2022). The best-performing XGBoost model and its hyperparameter exploration coverage have been shown in Table 1. The optimal hyperparameter values were n_estimators = 400, learning_rate = 0.05, max_depth = 7, and colsample_tree = 0.3. Fig. 3 represents the plot of experimental pIC50 values against the calculated pIC50 values using the XGBoost, SVM, and RF models. A good match between the calculated and experimental values indicates the fitness of the developed models. Fig. 4 displays the residuals of the predicted pIC50 values compared to the experimental data. The spread of residuals around the zero line suggests that the XGBoost model developed does not contain systematic errors. According to the results of the SHAP analysis for the XGBoost model, the impact of the descriptors have been depicted in Fig. 5. Table 2 outlines the names and definitions of these descriptors, all of which represent the topological and electronic dimensions of the chemical structures of compounds that influence antioxidant activity. Among these, the most critical descriptor is fragment-Ar-OH, highlighting its effectiveness over others by indicating the presence of phenolic groups within a compound’s structure. Similarly, the fourth most important descriptor, NHOHCount, represents the number of NH and hydroxyl groups in a compound. As previously discussed, the existence and location of hydroxyl groups on the benzene ring markedly affect the compound’s ability to scavenge radicals (Duchowicz et al., 2019; Shi, 2021). The values of this descriptor positively impact the antioxidant activity. This observation can be explained by the hydrogen atom transfer reaction pathway (Mayer, 2011). The second most important descriptor, MinPartialCharge, is also related to the density of electrons within the compound. A lower minimum partial charge within the compound positively impacts antioxidant activity. This observation can be explained according to the literature (Klein et al., 2005).
| Hyperparameter | Range | Selected value |
|---|---|---|
| N_estimator | 50, 100, 200, 300, 400 | 400 |
| Learnin_rate | 0.01, 0.05, 0.1, 0.5 | 0.05 |
| Max_depth | 3, 5, 7 ,9 | 7 |
| Colsample_tree | 0.3, 0.5, 0.7, 1.0 | 0.3 |

- The plot of XGBoost (a), Random Forest (b), Support vector machine (c) predicted versus experimental of values pIC50.
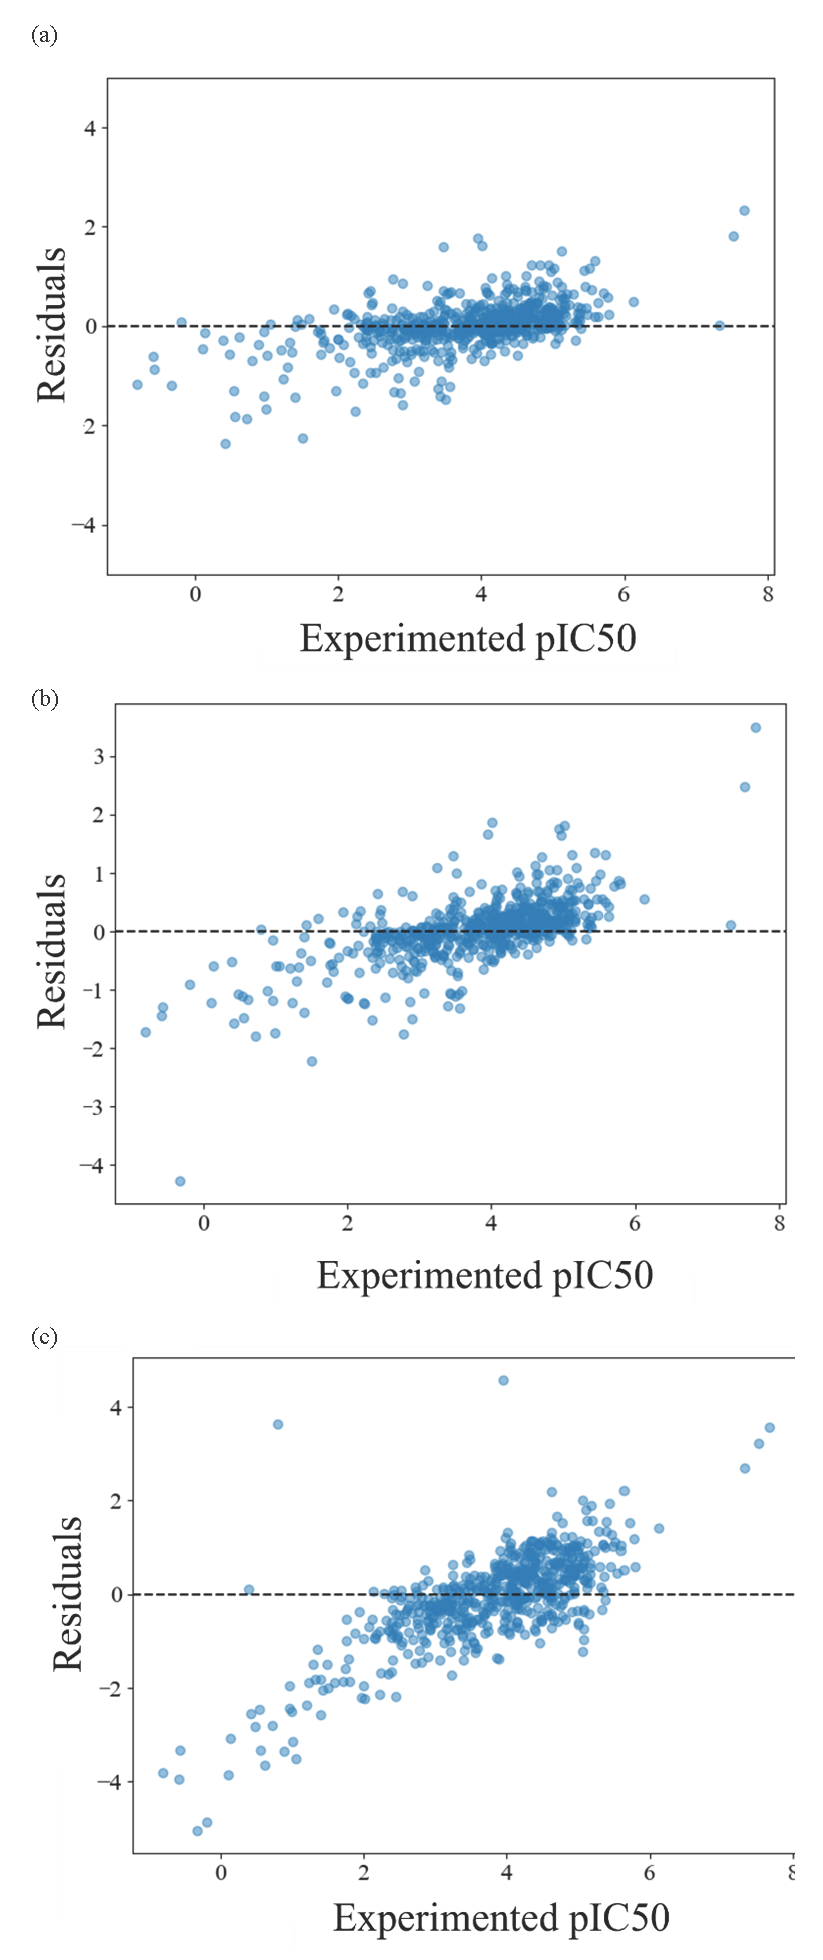
- The plot of XGBoost (a), Random forest (b), and Support vector machine (c) residuals versus experimental of values pIC50.
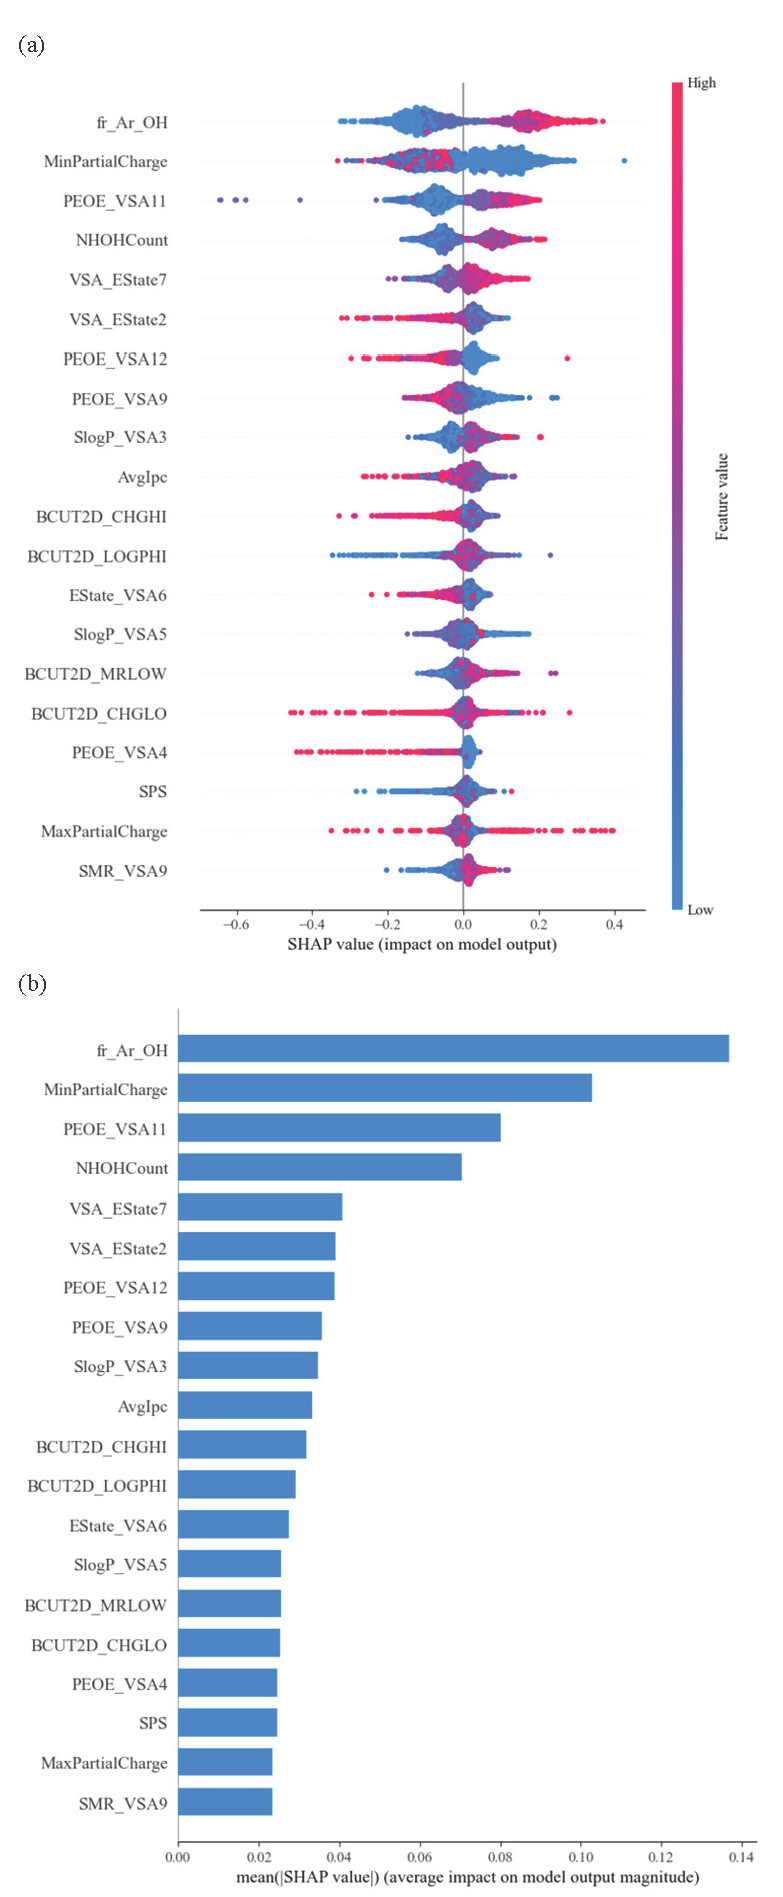
- (a) The impact of the descriptor on the output of the model (SHAP value) and (b) average of the absolute values of the impacts.
| No. | Descriptor name | Description | Reference |
|---|---|---|---|
| 1 | Fr_Ar_OH | Count of aromatic hydroxyl groups | (Landrum, 2013) |
| 2 | MinPartialChange | Minimal non-integer charge value when measured in elementary charge units | (Landrum, 2013) |
| 3 | PEOE_VSA 11 | EState VSA descriptors | (Labute, 2000) |
| 4 | NHOHCount | Count of amine (NH) and hydroxyl (OH) | (Landrum, 2013) |
| 5 | VSA_Estate7 | MOE-type descriptors using EState indices and surface area contributions (developed at RD, not described in the CCG paper) | (Hall et al., 1991) |
RD: Research and development, CCG: Chemical computing group, MOE: Molecular operating environment
3.3 QSAR model validation and evaluation
We adopted the methodology outlined by Tropsha to evaluate the applicability of the QSAR model. A high value of Q2 alone is not a sufficient criterion for a QSAR model to have high predictive power, so researchers have described reliable predictive performance not only in terms of the value of Q2 but also in terms of fulfilling the conditions of eq (2) to eq (5) (Golbraikh and Tropsha, 2002; Tropsha et al., 2003). Table 3 outlines the statistical metrics for the external validation set used across the three models. The results from the XGBoost model align closely with the previously defined limits, further underscoring the XGBoost model’s strong predictive capability. A comparison of these statistics with those obtained from the RF and SVM models demonstrates the superiority of the DT-based models. Among the DT-based models, those applying the boosting algorithm proved superior in predicting the pIC50 values. We also compare the QSAR model in our study with the reported QSAR models. Table 4 shows that the reported QSAR models used classified compounds as training data, while our QSAR model used unclassified compounds as training data. Although our model did not outperform Shi’s SVM or Duchowicz et al. (2019) MLR model in terms of R2 (0.85-0.93) for specific flavonoid or phenolic acid datasets (23-75 compounds) in terms of accuracy, However, our model includes 3,133 unclassified compounds, which ensures broader structural coverage. Although the R2 is 0.81, greater chemical diversity increases real-world applicability, demonstrating the robustness of the model across different compound classes. As a result, the XGBoost model provides a useful alternative for those looking for a ML solution to predict the antioxidant activity of unclassified compounds.
| Equation | XGBoost | RF | SVM |
|---|---|---|---|
| Q2 | 0.816 | 0.754 | 0.249 |
| R2 | 0.817 | 0.754 | 0.525 |
| (R2- R02) / R2 | -0.006 | -0.016 | -0.107 |
| K | 1.077 | 1.137 | 0.770 |
| K’ | 0.762 | 0.673 | 0.359 |
| |R02 – R’02| | 0.000 | 0.000 | 0.358 |
| Data class | Data count | Model | R2 | Ref. |
|---|---|---|---|---|
| Flavonoids | 24 | MLR | 0.82 | (Djeradi et al., 2014) |
| Anthocyanins | 23 | MLR | 0.85 | (Duchowicz et al., 2019) |
| Phenolic | 75 | SVM | 0.93 | (Shi, 2021) |
| Unclassified | 3133 | XGBoost | 0.81 | Our model |
4. Conclusion
From the RDKit descriptors, 82 were selected for predicting DPPH antioxidant activity among a diverse range of substances. The descriptors included in the QSAR model shed light on the structural attributes of compounds that contribute to the interactions affecting the antioxidant activity of chemicals. The experimental pIC50 value closely aligned with the pIC50 predictions made by the GXBoost model, affirming the accuracy of the developed QSAR model. DT models demonstrated superior predictive capabilities throughout this work. Compared with other reported models, our model showed a high predictive ability (R2 = 0.81) for unclassified compound data. The findings met the validation standards suggested by Tropsha et al. Our model was trained using 3133 compound data. This is about 42 times more than the amount of data in the existing literature. Although the prediction performance is comparable to or lower than other literature, the model generalization performance is high because we used unclassified compounds as data rather than selected compounds. The QSAR model emphasizes the crucial role and significant impact of the hydroxyl groups connected to the phenyl ring in enhancing radical scavenging activity. These groups are highlighted for their ability to act as hydrogen atom carriers through the compound’s functional groups. This implies a considerable contribution not only from the hydroxyl groups within the phenyl structure but also from the hydroxyl groups within the compound. Additionally, details about the scavenging activity of antioxidants offer a more profound understanding of the action mechanisms of compounds that have not been tested. By utilizing the developed QSAR model for comparison, we can contribute to experiments by predicting antioxidant capacity using computer calculations without any influence due to environment factors and skill level of the examiner. Although the actual DPPH radical scavenging capacity test was not performed in this study, we plan to select promising candidate compounds for direct experimental verification in a follow-up study to increase the reliability of the predicted results. We can further improve the performance of our model by including measured data for different antioxidant activities (ABTS, FRAP) to make it a comprehensive antioxidant activity model. We expect that this will not only improve the accuracy of the QSAR model but also its practical industrial and medical applicability.
Acknowledgements
This study was completed with the support of ´R&D Program for Forest Science Technology (Project No. ‘RS-2023-KF00251061382116530003’).
CRediT authorship contribution statement
Hyeon Cheol Kim: Methodology, Writing – review & editing, Data curation. Si Young Ha: Writing – review & editing. Jae-Kyung Yang: Supervision, Project administration.
Declaration of competing interest
The authors declare that they have no known competing financial interests or personal relationships that could have appeared to influence the work reported in this paper.
Declaration of generative AI and AI-assisted technologies in the writing process
The authors confirm that there was no use of artificial intelligence (AI)-assisted technology for assisting in the writing or editing of the manuscript and no images were manipulated using AI.
Supplementary data
Supplementary material to this article can be found online at https://dx.doi.org/10.25259/JKSUS_555_2024.
References
- Selected concepts and investigations in compound classification, molecular descriptor analysis, and virtual screening. J. Chem. Inf. Comput. Sci.. 2001;41:233-245. https://doi.org/10.1021/ci0001482
- [Google Scholar]
- A random forest guided tour. TEST. 2016;25:197-227. https://doi.org/10.1007/s11749-016-0481-7
- [Google Scholar]
- Natural antioxidants: Sources, compounds, mechanisms of action, and potential applications. Compr. Rev. Food Sci. Food Saf.. 2011;10:221-247. https://doi.org/10.1111/j.1541-4337.2011.00156.x
- [Google Scholar]
- AODB: A comprehensive database for antioxidants including small molecules, peptides and proteins. Food Chem.. 2023;418:135992. https://doi.org/10.1016/j.foodchem.2023.135992
- [Google Scholar]
- Antioxidant activity of flavonoids: A QSAR modeling using fukui indices descriptors. J. Mol. Model.. 2014;20:2476. https://doi.org/10.1007/s00894-014-2476-1
- [Google Scholar]
- QSAR studies of the antioxidant activity of anthocyanins. J. Food Sci. Technol.. 2019;56:5518-5530. https://doi.org/10.1007/s13197-019-04024-w
- [Google Scholar]
- Prediction of the radical scavenging activities of some antioxidant from their molecular structure. Ind. Eng. Chem. Res.. 2013;52:9525-9531. http://doi.org/10.1021/ie4001426
- [Google Scholar]
- Beware of q2! J. Mol. Graph. Model.. 2002;20:269-276. https://doi.org/10.1016/s1093-3263(01)00123-1
- [Google Scholar]
- Improved fault classification for predictive maintenance in industrial ioT based on autoML: A case study of ball-bearing faults. Processes. 2023;11:1507. https://doi.org/10.3390/pr11051507
- [Google Scholar]
- The electrotopological state: Structure information at the atomic level for molecular graphs. J. Chem. Inf. Comput. Sci.. 1991;31:76-82. https://doi.org/10.1021/ci00001a012
- [Google Scholar]
- Reactive oxygen species in living systems: Source, biochemistry, and role in human disease. Am. J. Med.. 1991;91:14S-22S. https://doi.org/10.1016/0002-9343(91)90279-7
- [Google Scholar]
- Root-mean-square error (RMSE) or mean absolute error (MAE): When to use them or not. Geosci. Model Dev.. 2022;15:5481-5487. https://doi.org/10.5194/gmd-15-5481-2022
- [Google Scholar]
- Quantum-chemical descriptors in QSAR/QSPR studies. Chem. Rev.. 1996;96:1027-1044. https://doi.org/10.1021/cr950202r
- [Google Scholar]
- Genesis and development of DPPH method of antioxidant assay. J Food Sci Technol. 2011;48:412-422. https://doi.org/10.1007/s13197-011-0251-1
- [Google Scholar]
- A study of the energetics of antioxidant action of p-phenylenediamines. Polym. Degrad. Stab.. 2005;88:548-554. https://doi.org/10.1016/j.polymdegradstab.2004.12.019
- [Google Scholar]
- An improved ensemble-based cardiovascular disease detection system with chi-square feature selection. Computers. 2024;13:126. https://doi.org/10.3390/computers13060126
- [Google Scholar]
- A widely applicable set of descriptors. J. Mol. Graph. Model.. 2000;18:464-477. https://doi.org/10.1016/s1093-3263(00)00068-1
- [Google Scholar]
- Free radicals and antioxidants: A review. J. Adv. Pharm. Res.. 2011;4(12):4340-4343.
- [Google Scholar]
- Understanding hydrogen atom transfer: From bond strengths to marcus theory. Acc. Chem. Res.. 2011;44:36-46. https://doi.org/10.1021/ar100093z
- [Google Scholar]
- The explanation game: Explaining machine learning models using shapley values. In: Holzinger A., Kieseberg P., Tjoa A., Weippl E., eds. Machine Learning and Knowledge Extraction. CD-MAKE 2020. Lecture Notes in Computer Science. Vol Vol 12279. 2020. p. :17-38. https://doi.org/10.1007/978-3-030-57321-8_2
- [Google Scholar]
- Reactive oxygen species in tumor metastasis. Cancer Lett.. 2008;266:53-59. https://doi.org/10.1016/j.canlet.2008.02.031
- [Google Scholar]
- A quantitative structure‐Activity relationship (QSAR) study of the antioxidant activity of flavonoids. QSAR Comb. Sci.. 2005;24:1056-1065. https://doi.org/10.1002/qsar.200430013
- [Google Scholar]
- Plant polyphenols: Free radical scavengers or chain-breaking antioxidants? Biochem. Soc. Symp.. 1995;61:103-116. https://doi.org/10.1042/bss0610103
- [Google Scholar]
- Structure-antioxidant activity relationships of flavonoids and phenolic acids. Free Radic. Biol. Med.. 1996;20:933-956. https://doi.org/10.1016/0891-5849(95)02227-9
- [Google Scholar]
- Hurdles and pitfalls in measuring antioxidant efficacy: A critical evaluation of ABTS, DPPH, and ORAC assays. Journal of Functional Foods. 2015;14:111-125. https://doi.org/10.1016/j.jff.2015.01.043
- [Google Scholar]
- Support vector regression-based QSAR models for prediction of antioxidant activity of phenolic compounds. Sci. Rep.. 2021;11:8806. https://doi.org/10.1038/s41598-021-88341-1
- [Google Scholar]
- Antioxidant activity of selected phenolic acids–Ferric reducing antioxidant power assay and QSAR analysis of the structural features. Molecules. 2020;25:3088. https://doi.org/10.3390/molecules25133088
- [Google Scholar]
- Support vector machine. In: Machine learning models and algorithms for big data classification. integrated series in information systems. Vol vol 36. Boston, MA: Springer; 2016. https://doi.org/10.1007/978-1-4899-7641-3_9
- [Google Scholar]
- Cells have distinct mechanisms to maintain protection against different reactive oxygen species: Oxidative-stress-response genes. Proc Natl Acad Sci U S A. 2004;101:6564-6569. https://doi.org/10.1073/pnas.0305888101
- [Google Scholar]
- Best practices for QSAR model development, validation, and exploitation. Mol Inform. 2010;29:476-488. https://doi.org/10.1002/minf.201000061
- [Google Scholar]
- The importance of being earnest: Validation is the absolute essential for successful application and interpretation of QSPR models. QSAR Comb. Sci.. 2003;22:69-77. https://doi.org/10.1002/qsar.200390007
- [Google Scholar]
- Molecular pharmacology of vitamin e: Structural aspects of antioxidant activity. Free Radic. Biol. Med.. 1993;15:311-328. https://doi.org/10.1016/0891-5849(93)90078-9
- [Google Scholar]
- The influence of reactive oxygen species on cell cycle progression in mammalian cells. Gene. 2012;511:1-6. https://doi.org/10.1016/j.gene.2012.08.038
- [Google Scholar]
- SMILES, a chemical language and information system 1 Introduction to methodology and encoding rules. J. Chem. Inf. Comput. Sci.. 1988;28:31-36. https://doi.org/10.1021/ci00057a005
- [Google Scholar]
- On hyperparameter optimization of machine learning algorithms: Theory and practice. Neurocomputing. 2020;415:295-316. https://doi.org/10.1016/j.neucom.2020.07.061
- [Google Scholar]
- A gradient boosting method to improve travel time prediction. Transportation Research Part C: Emerging Technologies. 2015;58:308-324. https://doi.org/10.1016/j.trc.2015.02.019
- [Google Scholar]


