

Translate this page into:
Modeling and mapping the spatial variability of soil micronutrients in the Tigris basin
⁎Corresponding author. asurucu@harran.edu.tr (Abdulkadir Sürücü)
-
Received: ,
Accepted: ,
This article was originally published by Elsevier and was migrated to Scientific Scholar after the change of Publisher.
Peer review under responsibility of King Saud University.
Abstract
Background
Crop production is negatively impacted by excess and lack of soil micronutrients. Due to anthropogenic and natural factors, soil micronutrients vary greatly in space, necessitating time- and money-consuming large-scale sampling. Therefore, modeling their spatial distributions and forecasting in non-sampled areas are essential for high crop production.
Methods
In this study, regional variations in soil micronutrient content of the Upper Tigris Basin were modeled to produce local change maps for the development of site-specific nutrient management systems. The concentrations of extractable zinc (Zn), copper (Cu), manganese (Mn), and iron (Fe) in soil samples taken at 388 different sites between 0 and 20 cm deep were determined. Using variogram and kriging analyses, the spatial distribution of the micro element concentrations was modeled and mapped in a GIS environment.
Results
The micronutrients demonstrated significant variability with a high coefficient of variation (CV > 35%). It was found that the spatial dependence of the samples ranged from low for Fe and Cu to high for Zn and Mn. The spatial distribution of soil micronutrients was influenced by soil texture in addition to distance. Overall, the results demonstrated that the management of site-specific micronutrients may be aided by the integration of geostatistics and GIS, which is particularly beneficial in terms of effective management of the lands and the optimal use of inputs.
Conclusion
Overall, the findings showed that the integration of geostatistics and GIS may be helpful in the management of site-specific micronutrients, which is especially advantageous in terms of efficient management of the lands and the best use of inputs.
Keywords
Geostatistics
Spatial analysis
Variability
Soil micronutrients
Tigris

1 Introduction
The Tigris Basin is located in the northwest of historical Mesopotamia, which is considered to be the cradle of civilization and one of its most important ecosystems. In these regions, which have been home to people for many years, agricultural production has been the source of livelihood of people due to sufficient water, productive agricultural lands and irrigation facilities. On the other hand, population growth and urbanization in the region have increased the pressure on agricultural lands. The adoption of intensive agricultural production systems in order to obtain more products from the unit area in order to meet the food needs of the increasing population has also caused some problems such as nutrient deficiency and land degradation in agricultural lands. More efficient use of limited agricultural lands necessitates the development of appropriate soil management systems. Thus, it is necessary to know the soil properties, which is one of the most basic needs for plant production, and to develop management systems accordingly (Corwin and Lesch, 2005; Corwin et al., 2006; Ayoubi et al., 2012; Vasu et al., 2021; Peter-Jerome et al., 2022).
Intensive agricultural activities have begun to threaten the productivity of the Tigris Basin significantly due to land degradation, as in many parts of the world. Mechanization without considering soil characteristics, improper rotation or monoculture agriculture, excessive exploitation of organic matter and nutrients, decrease in biodiversity caused by burning stubble, fertilization practices applied without soil analysis, as well as not using the lands according to their capabilities has caused various problems such as water and wind erosion and soil pollution, land degradation and desertification, excessive nutrient accumulation in some lands, and nutrient deficiency in some lands (Panagos and Katsoyiannis, 2019; Mohammed et al., 2020). Reducing and eliminating the problems that arise as a result of human-induced pressures can be possible with the correct diagnosis of the problems and taking the necessary measures in time (Salvati et al., 2016).
The information obtained about spatial variability of nutrients can provide useful information for the land owners in order to maintain the optimum nutrient status in terms of plant production and to develop appropriate agricultural practices (Jin and Jiang, 2002). Plant germination, growth and plant reproduction is very difficult without macro and micro nutrients. The amount of nutrients required by plants varies. While the excess of elements such as C (carbon), H (hydrogen) and O (oxygen) does not have negative effects on the plant, the presence of micronutrients such as Mn in the soil in concentrations above the limit value causes adverse effects on plant growth, product quality and quantity (Langridge, 2022).
The main purpose of soil survey and mapping is to define the changes that occur in the soil, to make detailed examinations and to establish soil boundaries. The maps created as a result of the researches are very important. Today, soil maps are used extensively in soil management, precision agriculture, agricultural areas and environmental impact models, geographic information systems applications and production modeling studies (Di et al., 1989).
Determining and mapping spatial variabilities in the physical and chemical properties of the soils is very important for the development of appropriate management methods and the sustainability of the soils (Denton et al., 2017). By mapping the locations of the smallest, highest, and average values of soil attributes on maps, problematic areas can be located more quickly (Mali et al., 2016). Different parent materials affect the concentration of micronutrients in the soil (Rattan et al., 2008). Topographic variables such as slope, altitude, runoff and erosion affect the spatial distribution of micronutrients. The uptake of micronutrients by plants depends on pH, soil moisture, soil texture, organic matter and oxygen ratio (Martens and Lindsay, 1990; Fageria, 2000). Although it is required in small amounts, micronutrients are needed as well as macronutrients. Even if all other nutrients are in sufficient amount in the soil, the deficiency or excess of micronutrients negatively affects plant growth (Bouis and Welch, 2010). Micronutrient deficiency is a major problem worldwide as it directly affects organic and inorganic acid levels, protein synthesis and the composition and concentration of amino acids in plants (Lindsay, 1991; Stevenson, 1991; Jones et al., 1994; Lopez-Bucio et al., 2000; Mackowiak et al., 2001; Abdel-Mawgoud et al., 2011; Marzani et al., 2008; Hänsch and Mendel, 2009; Abdel-Mawgoud et al., 2011).
Accepting the entire land as homogeneous may lead to excessive or insufficient fertilizer applications at some points, resulting in failure of the nutrient management application (Fu et al., 2010). For this reason, it is quite significant to determine and map the local changes of micronutrient content in agricultural lands (Eze et al., 2010; Foroughifar et al., 2013; Vasu et al., 2020; 2021).
Previous researchers summarized the internal and external factors influencing spatial distribution of micronutrients in general. According to the researchers, factors such as vegetation, parent material, topography, chemical properties, physical properties of the soil such as organic carbon, CaCO3 and pH, as well as external factors such as fertilization and agricultural management factors, can influence the spatial distribution of microelements (Marques Jr. et al., 2015; Laekemariam et al., 2018; Vasu et al., 2021). Vasu et al. (2021) who modeled the interactions between microelement contents and topography, parent material and land use status, found weaker relationships between microelement contents and topography, but stronger relationships between parent material and land use status. Researchers using geostatistical techniques to investigate the spatial distribution of microelements in the field have reported varying results in terms of spatial dependence. Vasu et al. (2021) discovered a lack of spatial dependence for all micronutrients studied (n = 1508), as evidenced by a high nugget to sill ratio. Tamburi et al. (2020) found moderate spatial dependence for Fe, Cu, and Mn using a smaller sample size (n = 68) and the same indicator. Zinc showed strong spatial dependence. Marques Jr. et al. (2015) reported weak spatial dependence for Zn and moderate spatial dependence for Fe, Cu, and Mn, in contrast to these researchers.
Geostatistical methods have been used reliably by many researchers in modeling the variation of soil properties with distance and describing the relationship between sampling distances and properties (Erdem et al., 2012; Goovaerts, 1999; Webster and ve Oliver, 2004; Denton et al., 2017). In geostatistics, the semivariogram model is widely used in defining and modeling the variability of soil properties in the field, and the kriging method is widely used in estimating the values of the unsampled points in a reliable range (Webster and Oliver, 2004;Denton et al., 2017).
The heterogeneous nature of nutrients in agricultural lands also causes a significant variability in yield. A lack of understanding about the variability of soil microelements as a result of both internal and external factors may prevent producers from making adequate use of their lands (Laekemariam et al., 2018). Adding unbalanced micronutrients to the soil without their spatial distribution is known, resulting in unsustainable crop production. To ensure sustainable crop production, spatial changes and soil properties should be known (Shukla et al., 2020). Thus, the variability of nutrients with distance must be determined and mapped (Paz et al., 1996; Sood et al., 2009; Sürücü et al., 2019b; Budak et al., 2018a), the generated spatial variability maps could then be used as a guide for precise and site-specific micronutrient management (Ramzan and Wani, 2018).
The goals of this research are to determine the dimensions of the spatial distribution of micronutrients (Fe, Cu, Zn and Mn) in the study area with various soil types, as well as to determine the best geostatistical model to be used in the estimation and mapping of micronutrients in non-sampled points for better agricultural management.
2 Materials and methods
2.1 Study area
The Tigris Basin, regarded as the birthplace of civilization and one of its most significant ecosystems, is situated in the northwest of historical Mesopotamia. The Dicle and Kralkızı dams were built in the region, which is where the Tigris River originates. It has a serious issue with land degradation. Lands have been exposed to increasing anthropogenic impacts as a result of human settlement for thousands of years, with negative effects on soil functions.
The Study area (37o58′ – 38o30′ north latitudes; 39o47′ – 41o30′ east longitudes), which consists of approximately 1,000,000 ha, is located in the basin where the provinces of Diyarbakır, Batman, Siirt, Elazığ and Bingöl are located (Fig. 1).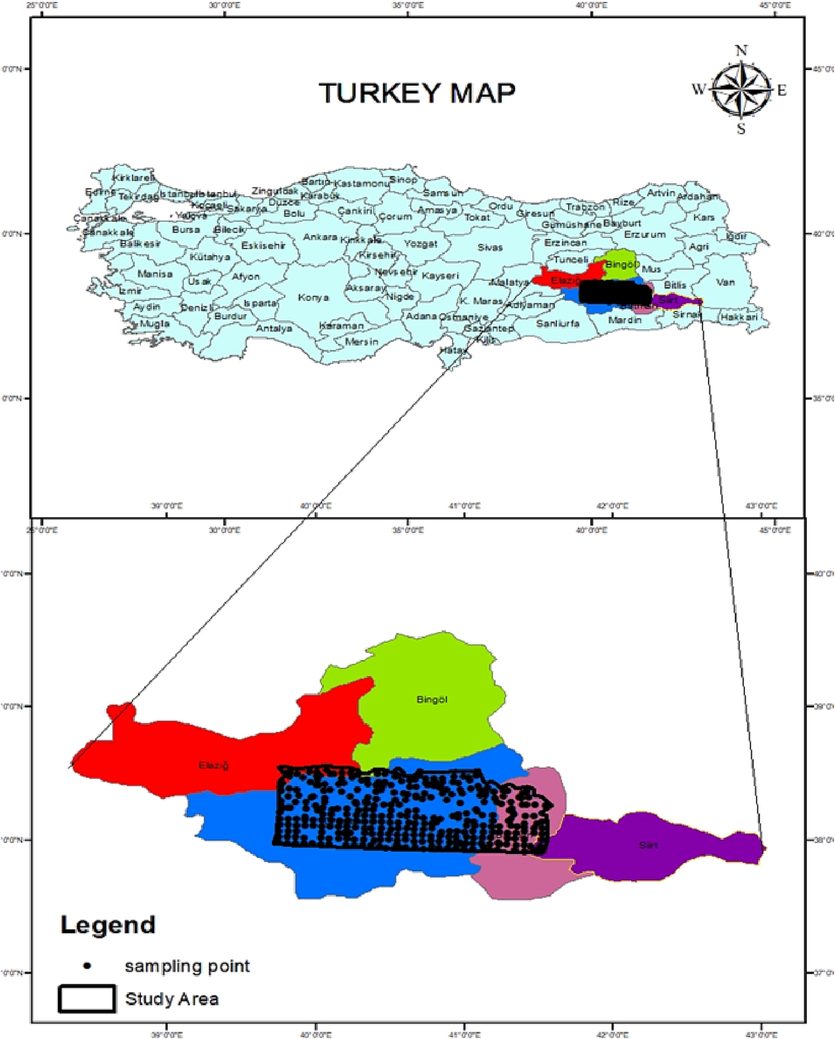
Study area, sampling pattern and sampling points.
The soils of the study area were mainly formed on basaltic and sedimentary parent materials.The southwestern part of the study area is located on the basalts, which are the product of Karacadağ volcanic activities while the majority of the south, south-east and eastern parts were formed on the Şelmo formation with conglomerate, claystone, sandstone, shale and occasional gypsum. Most of the northern and north-western parts are composed of sandstone, claystone, siltstone and limestone Lice formation and the majority of the middle parts were formed on Neritic limestone and the Euphrates formation with marl features in places (Sütçü 2008).
The continental climate of the Southeastern Anatolia Region, which is hot and dry in summers and cold and rainy in winters, is dominant in the study area. Average precipitation of the study area is 522 mm (Anonymous, 2018). About 41, 38.5, 18.7 and 1.8 % of the precipitation falls in the winter, spring, autumn and summer seasons, respectivelly. Wheat, barley and lentils are grown by dry farming on lands where irrigation is not available; Field crops such as corn and cotton are grown in areas where irrigation is available. In addition, fruit trees such as vineyards, plums, pistachios and apples, and vegetable crops such as watermelon, beans, tomatoes, cucumbers, acurrants, peppers and eggplants are grown in the study area.
2.2 Soil sampling and analysis
Soil samples were taken at a depth of 0–20 cm from 387 randomly selected points to represent the study area. The plant available Cu, Mn, Fe and Zn contents in air-dried soil samples sieved from 2 mm were determined using DTPA extraction technique (Lindsay and Norvell 1978). For this, 20 g of soil sample was shaken with 40 ml of DTPA extraction solution for 2 h, and then the micronutrient (Fe, Cu,Mn and Zn) contents of the extracted solution were determined using an atomic absorption device (Perkin-Elmer aanalyst 700). While determining the amount of microelement, wavelengths of 234 nm for Fe, 354 nm for Cu, 678 nm for Mn and 987 nm for Zn were used, respectively.
2.3 Statistical analysis
The descriptive statistical parameters (minimum, maximum, mean, standard deviation, coefficient of variation, skewness and kurtosis values) of the soil micronutrients of the study areas were calculated with the help of SPSS (Statistical Package for Social Sciences) for Windows 21.0.
Geostatistical techniques have been used in modeling and mapping the spatial distributions of soil micronutrients (Goovaerts 1999; Mulla and McBratney, 2002). In order to create geostatistical maps of Fe, Mn, Cu and Zn elements, variograms showing the variability between sampling points as a function of distance were calculated first (Equation 1). Variogram models of microelements and cross validations were obtained using the GS + 7.0 program (Emadi et al., 2008) (Figs. 2 and 3). Semivaryans were calculated as follows (Emadi et al., 2008);
where: h; distance between Xi and Xi + h.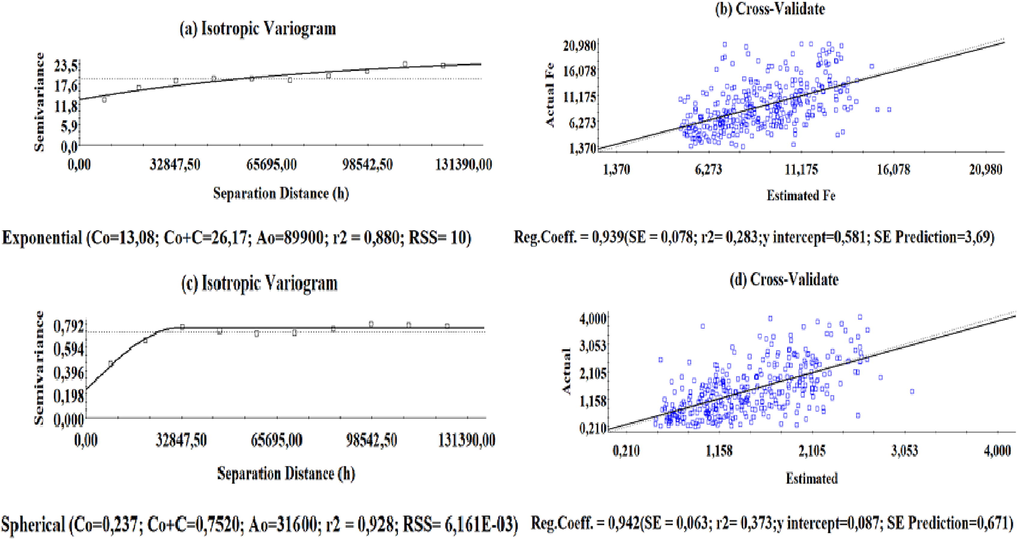
Variogram and Cross Validate graphs of Fe Variogram (a), Fe Cross Validation (b), Cu Variogram (c) and Cross Validation of Cu (d).
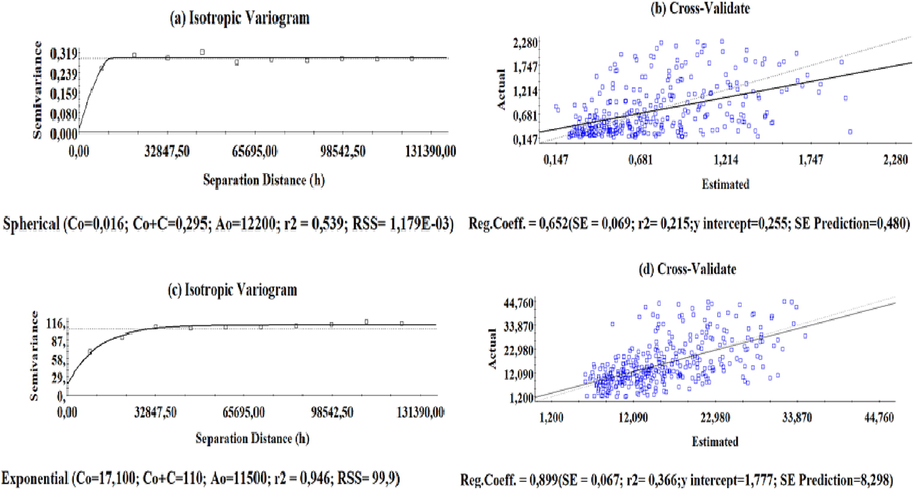
Variogram and Cross Validate graphs of Zn Variogram (a), Zn Cross Validation (b), Mn Variogram (c) and Cross Validation of Mn Elements (d).
N(h); the number of sample pairs separated by the h distance.
z(Xi), z(Xi + h); Sample value of two points separated by the h distance interval.
The linear (Linear), exponential (Exponential), theoretical (Gaussian), and spherical (Spherical) models were chosen based on the semivariance values obtained. The values of metrics like RSS (Residual Sum of Squares) and R2 were looked at in order to assess the suitability of model selection for semivariograms of micronutrient components that correspond to the study region. The model with r2 value close to 1.0 and RSS value close to 0 was chosen as the best model (Yang et al., 2011). For all variables, Sill (Co + C), Nugget (Co), Range, r2, and RSS values were calculated. In addition, the nugget to sill ratio, which shows the spatial dependence level, was also calculated. The ordinary-kriging approach was used to create maps of the micro elements' distance-dependent variability after choosing the appropriate model in the ArcGIS software (ESRI, 2011) (Figs. 4 and 5).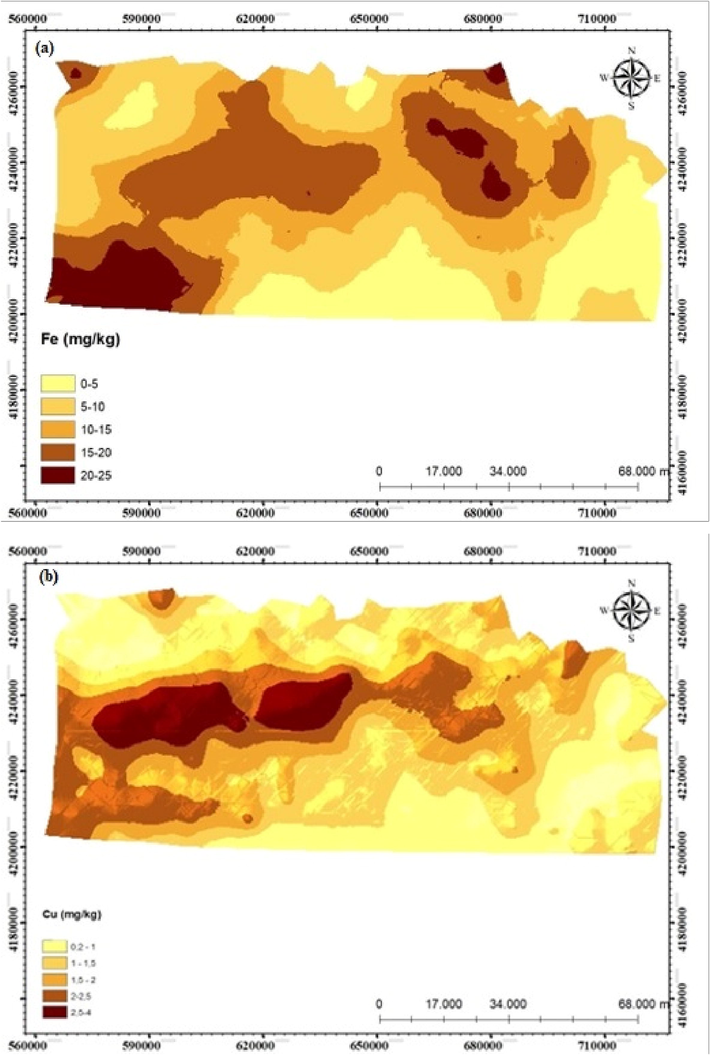
(a) Geostatistical maps of Fe and (b) Cu concentrations.
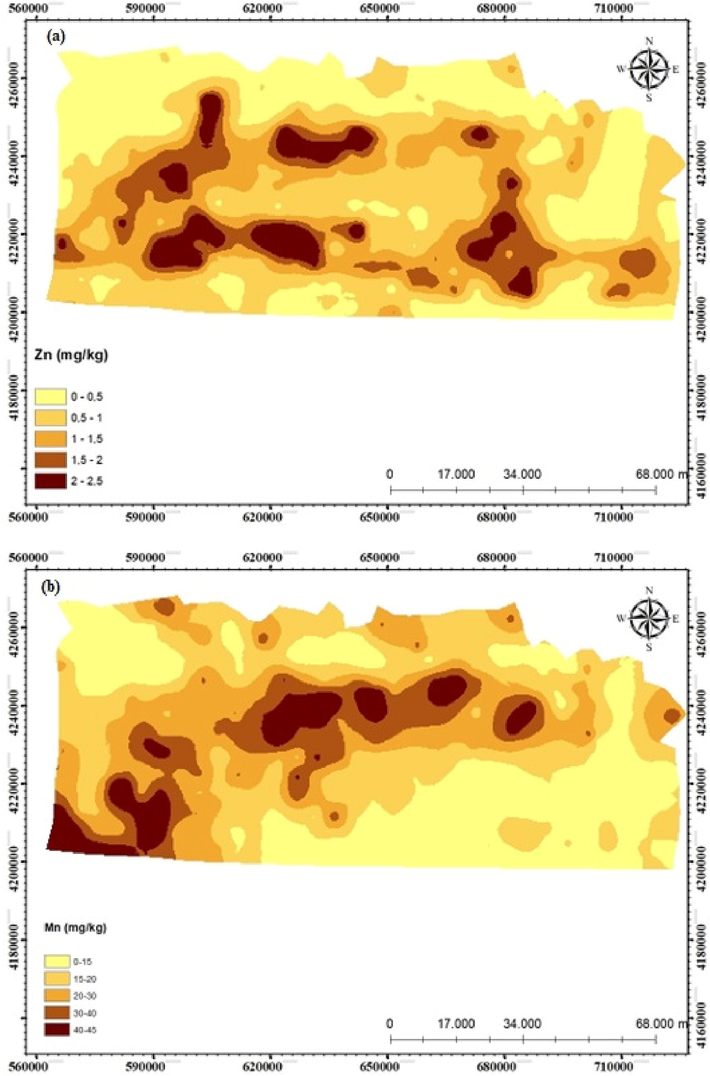
(a) Geostatistical maps of Zn and (b) Mn concentrations.
3 Results
3.1 Descriptive statistics
The available Fe contents of soil samples vary between 1.37 and 20.98 mg kg−1, with an average of 9.14 mg kg−1. Cu content varies between 0.21 and 4.00 mg kg−1 with an average of 1.46 mg kg−1. Zn content varies between 0.17 and 2.28 mg kg−1, with an average of 0.74 mg kg−1 ve Mn content varies between 1.20 and 44.76 mg kg−1 with an average of 16.09 mg kg−1 (Table 1).
Microelements
Min.
Max.
Average
Std. Dev.
Std. Err
CV† (%)
Skewness
Kutosis
Fe
1.37
20.98
9.14
4.36
0.23
47.71
0.68
−0.01
Cu
0.21
4.00
1.46
0.85
0.04
58.18
0.71
−0.08
Zn
0.17
2.28
0.74
0.54
0.03
73.26
1.12
0.24
Mn
1.20
44.76
16.09
10.18
0.54
63.26
1.00
0.36
Soil microelements were classified according to their concentration values and the number of samples falling into each class (frequencies) was calculated (Table 2; Vasu, 2020). According to the classification made by made by Vasu (2020), around 45 % of the soil samples were quite high in terms of Fe content (>9.5 mg kg−1) and 16 % had high iron content, 27 % had moderate and only 12 % of the samples had very low iron content. In terms of available Mn content, the Mn concentration of all soil samples was found to be sufficient (>1.2 mg kg−1) for crop production (Table 1).
Micronutrient (mg kg−1)
Rating
Class
Number of samples
(%)
Fe
<4.5
Low
47
12.15
4.5–7.5
Medium
104
26.87
7.5–9.5
High
62
16.02
>9.5
Very high
174
44.96
Cu
<0.2
Very low
8
2,07
0.2–0.4
Low
24
6,20
0.4–0.6
Medium
39
10.08
0.6–0.8
High
35
9.04
>0.8
Very high
281
72.61
Zn
<0.3
Very low
92
23.77
0.3–0.6
Low
110
28.42
0.6–0.9
Medium
47
12.15
>0.9
High
138
35.66
Mn
<1.2
Low
–
–
>1.2
High
387
100
The most of the soil samples taken from the study area (72%) had a very high copper content, while 10% had a medium 9% high and 2% had a very low copper content. In terms of Zn concentration, in one third of the soil samples (35.66%), the concentrations were found to be high and in the remaining samples, it was found to be medium in 12.14%, low in 28.42% and very low in 23.77% (Table 2).
3.2 Spatial variability and mapping of microelements
The parameters of the semivariogram models obtained for the microelements are given in Table 3. While the best model for Cu and Zn was spherical, the exponential model was the best for modeling the distance dependent variability for Fe and Mn. Before modeling, log transformation was applied to Zn with a high skewness value.
Model parameters
Model
Nugget
Sill
Range
r2
RSS*
SD %**
Fe
Exponential
13.08
26.17
269,700
0.880
10
49.98
Cu
Spherical
0.237
0.7520
31,600
0.928
6.161E-03
28.85
Zn
Spherical
0.016
0.295
12,200
0.539
1.179E-03
5.28
Mn
Exponential
17.10
110.00
34,500
0.946
99.9
15.54
The nugget to sill ratio (spatial dependency coefficient) which is obtained by dividing the Nugget(Co) value by the Sill (Co + C) value ranged from 5.28 to 49.98 (Table 3). The element with the largest range value in this study according to semivariogram models is Fe, with a value of 269700 m. The same element also has the highest spatial dependence value (49.98%). The Zn element is the one with the lowest range value (12200 m) and spatial dependence value (5.28 %).
The semivariogram parameters obtained using the GS + 7 program were transferred to the ArcGIS program and the geostatistical maps were prepared with the ordinary kriging method. (Figs. 4 and 5). In general, Ordinary kriging maps created for all elements showed similarities with a few exceptions. Despite the high similarity of Fe, Cu and Mn maps, the Zn map differed in the southern part of the study area (Figs. 4–5). In addition, when the microelement maps are examined in detail, it is seen that the concentrations of Fe, Mn, Cu and Zn have the highest values in the central and southwestern parts of the study area, and the concentrations of four elements decrease from the middle to the southeastern part.
After the geostatistical maps of the study area were created, the spatial distribution and total area of the micro element concentrations in each class were calculated based on the limit values of Vasu (2020) (Table 4). According to this, it was calculated that the Fe element concentration in 26,689 ha of the study area is low, and the Fe contents in the rest of the area are sufficient for plant growth. The concentration of Fe element is high in almost 2/3 of the study area The concentration of Fe element is high in almost two-thirds of the study area. Cu element concentrations are high in almost all of the area and it was found to be low in only 2.591 ha area. When the concentration of Zn element is examined, it is seen that the concentration is very low in 3.96% of the area, low in 37.28% of the area, and medium (25.29) and high (33.45) in the remaining parts (Tablo 4). Mn element concentration is seen to have a high concentration in the entire study area (Table 4).
Micronutrient (mg kg−1)
Rating
Class
Area (ha)
Area (%)
Fe
<4.5
Low
26.689
2.74
4.5–7.5
Medium
229.569
23.27
7.5–9.5
High
230.314
23.35
>9.5
Very high
499.674
50.66
Cu
<0.2
Very low
–
–
0.2–0.4
Low
2.591
0.26
0.4–0.6
Medium
29.779
3.01
0.6–0.8
High
103.880
10.53
>0.8
Very high
850.006
86.18
Zn
<0.3
Very low
39.057
3.96
0.3–0.6
Low
367.734
37.28
0.6–0.9
Medium
249.474
25.29
>0.9
High
329.893
33.45
Mn
<1.2
Low
–
–
>1.2
High
986.258
100
4 Discussion
Statistical parameters such as standard deviation, variance, skewness and kurtosis provide information about the spread of the data. However, it is not possible to compare the values of these parameters with each other, since the units of the soil properties are different from each other. The coefficient of variation (CV) obtained by proportioning the standard deviation to the arithmetic mean is an important parameter that is used to minimize the measured values and allows the variability to be compared. According to Wilding et al. (1994) parameters with CV < 15% are classified slightly variable, between 15% and 35% as moderately variable, and values >35% as highly variable. Accordingly, all microelements show high variability (CV > 35%). This is mostly due to the difference in soil characteristics (water available to the plant, soil texture and structure, infiltration, soil depth, soil layers, organic matter), climate and topography in the study area, which has a large area (Table1).
The nugget to sill ratio is used to interpret the degree of spatial variability of a parameter (Wang and Shao, 2013). If this ratio is ≤25%, it is classified as variable strong spatially dependent, if it is between 25% and 75%, moderately spatially dependent, and if it is more than 75%, the variable is classified as weakly spatially dependent (Cambardella et al., 1994; Emadi et al., 2008; Yang et al., 2011). Accordingly, Fe (50.03) and Cu (33.44) were found to be moderately spatially dependent, while Zn and Mn were found to be strongly spatially dependent. The strong spatial dependency indicated the similarity between the analyzed features at shorter distances, whereas this distance gradually grows when the spatial dependence is medium or weak (Sürücü et al., 2019a; Budak et al., 2018; Sürücü et al., 2019b). This distance is expressed as the range value in the Semivariograms obtained as a result of the models created. Geostatistics assumes that this similarity completely disappears after a point (Deutsch and Journel. 1998). The degree to which a parameter is spatially dependent is influenced by both internal and external factors. Whereas internal factors like topography and parent material are more prominent in parameters with low spatial variability, agricultural practices like fertilization, irrigation, and soil cultivation are more noticeable in parameters with low spatial dependence (Laekemariam et al., 2018; Marques et al., 2015; Vasu et al., 2021; Zhu et al., 2021).
Given the similarities between the maps produced by geostatistical analyses of soil texture (data shared by co-author in a different study) and the geostatistical maps produced for the microelements in this study, it is likely that soil texture, an intrinsic parameter, regulates the micronutrients (Zn and Mn)' strong spatial dependence.
In the research performed by Budak et al. (2018) in the same study area, it was reported that the clay content in the Southwest part was high (between 50 and 70%), while the sand content increased towards the Southeast. Similarly, in this study, while the micro element contents were high in the Southwest part of the study area, they were low in the Southeastern parts. Therefore, this similarity can be explained by the high clay content in the northern parts of the study area and the decreasing clay content and increasing sand content towards the south. The apparent similarity between soil texture and microelement concentration was reported in maps created in a different study area (Sürücü et al., 2019a; Sürücü et al., 2019b). The reason for this is that the positively charged cations bind to the negative charges of clays with large inner surface area and outer surfaces due to the silicon tetrahedron and aluminum octa-hedron layers in their structure. In addition to these cations, dipolar water molecules are also held on negative surfaces. Thus, soils with high clay content have more plant nutrients (macro and micro nutrients; Ca, K, Mg, Cu, Zn and Fe) and water storage capacity. Clays have a colloidal structure due to the negative charges on their surfaces. Humus, which is known as soil organic matter and carries a negative charge on its surfaces, has the same property. Clay is also very important in structure formation and primary fractions of soil. As the amount of clay increases, the aggregation rate generally increases in the soil. Soil aggregation, micronutrients and water content are important for plant production (Fernández-Ugalde et al., 2013). In the study area, the micro element concentration increased in areas with dense clay content and decreased in areas with low clay content and high sand content (Sürücü et al., 2019a). Erdem et al. (2012) reported that Fe, Mn, Cu and Zn concentrations showed a significant variation in the field depending on the texture components (clay and sand) and organic matter content.
The fertilizer used to meet the plant need and increase the yield has a high cost and causes environmental pollution. Therefore, unconscious fertilizer application to the soil is seen as an important problem. In order to reduce the amount of fertilizer, it is necessary to know the properties of the soil where plant production will be made (Koç and Karayiğit, 2022). Otherwise, if fertilization is performed considering that the whole land is in a homogeneous structure; some areas are given more or less fertilizer than they need. Knowing the characteristics of all agricultural land is only possible with geostatistics. Estimation of the properties of the locations where soil samples are not taken was made possible by creating geostatistical maps. In this way, application of fertilizers to the soil based on plant needs will provide a great benefit in terms of the cost, time and general structure of the soil. Geostatistics is needed to save time, reduce fertilizer cost, environmental pollution and labor (Aggelopoulou et al., 2011). After determining the variation of soil properties depending on distance and the heterogeneity of soils in the lands of small-scale orchards in Greece, the researchers stated that it is wrong to apply fertilizer at the same rates every year, considering that lands are homogeneous. The researchers also reported that these wrong practices cause both unnecessary costs and soil pollution (Aggelopoulou et al., 2011).
5 Conlusions
High CV values show that the micronutrients (Fe, Mn, Cu, and Zn) in the studied region are distributed in a heterogeneous structure. Fe, Cu and Zn were respectivelly each found to be insufficiently low and very low in 12, 2.07 and 23.77% of the samples, which corresponds to 2.74, 0.26 and 41.24% in area, respectively. The microelements under investigation, Zn and Mn, showed strong spatial dependence, whereas Cu and Fe had moderate spatial dependence. The spatial distribution of microelements is largely determined by soil texture. Parallel to the strong spatial dependence in the microelements, the kriging method predictions were found to be successful for the microelements. The maps created as a result of this study showed that while they are more than sufficient in some areas, they are insufficient in others.The maps produced as a result of this study will be very helpful in selecting the best plant species based on more precise micronutrients or fertilization. It is anticipated that doing so will lower the farmers' fertilizer expenditures and boost production for crops grown in the research area.
Acknowledgement
The curent study was supported by TÜBİTAK Project number 214O374, Harran University Project number HÜBAP 21025 and YOK 100/2000.
Declaration of Competing Interest
The authors declare that they have no known competing financial interests or personal relationships that could have appeared to influence the work reported in this paper.
References
- Foliar application of amino acids and micronutrients enhance performance of green bean crop under newly reclaimed land conditions. Aust. J. Basic Appl. Sci.. 2011;5(6):51-55.
- [Google Scholar]
- Soil spatial variability and site-specific fertilization maps in an apple orchard. Precis. Agric.. 2011;12(1):118-129.
- [Google Scholar]
- Anonymous, 2018. General Directorate of Meteorology. General Statistics of Provinces (In Turkish). https://www.mgm.gov.tr/veridegerlendirme/il-ve-ilceler-istatistik.aspx.Erişim.
- Spatial variability of some soil properties for site specific farming in northern Iran. Int. J. Plant Prod... 2012;1(2):225-236.
- [Google Scholar]
- Biofortifcation—a sustainable agricultural strategy for reducing micronutrient malnutrition in the global south. Crop. Sci.. 2010;50(1):S-20
- [Google Scholar]
- Budak, M, Çelik, İ. Acir, N., Yıldız, H., Gültekin, U., Cemek. B., 2018. Adaptation of MEDALUS Model to Assesment and Monitoring of Sensitive Areas For Desertification In Dicle Basin. Project of TUBITAK (Project number: 119O947).
- Characterizing spatial variability of soil properties in tigris basin using geostatistics and geographical information systems. Turkish J. Agric. Res.. 2018;5(2):103-115.
- [Google Scholar]
- Field-scale variability of soil properties in central Iowa soils. Soil Sci. Soc. Am. J.. 1994;58:1501-1511.
- [Google Scholar]
- Characterizing soil spatial variability with apparent soil electrical conductivity: I. Survey protocols. Comput. Electron. Agric.. 2005;46(1–3):103-133.
- [Google Scholar]
- From field-to landscape-scale vadose zone processes: Scale issues. modeling. and monitoring. Vadose Zone J.. 2006;5(1):129-139.
- [Google Scholar]
- Assessment of spatial variability and mapping of soil properties for sustainable agricultural production using geographic information system techniques (GIS) Cogent Food Agric.. (1):1-12.
- [Google Scholar]
- Deutsch. V. Journel. A.G. GSLIB. 1998. Geostatistical Software Library and User's Guide. 340pp. Oxford University Press. New York. NY. (1998). pp. 340.
- Use of geostatistics in designing sampling strategies for soil survey. Soil Sci. Soc. Am. J.. 1989;53(4):1163-1167.
- [Google Scholar]
- Assessment of some soil properties by spatial variability in saline and sodic soils in Arsanjan plain. Southern Iran. Pakistan J. Biol. Sci. PJBS.. 2008;11(2):238-243.
- [Google Scholar]
- Micronutrient variability in a lacustrine environment of calcic haplosalids. Fresen. Environ. Bull.. 2012;21(3):553-562.
- [Google Scholar]
- ArcGIS Desktop: Release 10. CA: Environmental Systems Research Institute; 2011.
- Distribution and potential source evaluation of heavy metals in prominent soils of Accra Plains. Ghana Geoderma. 2010;156(3–4):357-362.
- [Google Scholar]
- Níveis adequados e tóxicos de zinco na produção de arroz, feijão, milho, soja e trigo em solo de cerrado. Revista Brasileira de Engenharia Agrícola e Ambiental. 2000;4:390-395.
- [Google Scholar]
- Clay mineralogy differs qualitatively in aggregate-size classes: clay-mineral-based evidence for aggregate hierarchy in temperate soils. Eur. J. Soil Sci.. 2013;64(4):410-422.
- [Google Scholar]
- Using geostatistics and geographic information system techniques to characterize spatial variability of soil properties. including micronutrients. Commun Soil Sci. Plant. Anal.. 2013;44(8):1273-1281.
- [Google Scholar]
- Spatial variation of soil nutrients in a dairy farm and its implications for site-specifc fertilizer application. Soil Tillage Res.. 2010;106:185-193.
- [Google Scholar]
- Geostatistics in soil science: state-of-the-art and perspectives. Geoderma. 1999;89(1–2):1-45.
- [Google Scholar]
- Physiological functions of mineral micronutrients (Cu Zn. Mn. Fe. Ni. Mo. B. Cl) Curr. Opin. Plant. Biol.. 2009;12(3):259-266.
- [Google Scholar]
- Spatial variability of soil nutrients and site-specific nutrient management in the PR China. Comput. Electron. Agric.. 2002;36(2–3):165-172.
- [Google Scholar]
- Role of proteinaceous amino acids released in root exudates in nutrient acquisition from the rhizosphere. Plant Soil. 1994;158(2):183-192.
- [Google Scholar]
- Assessment of biofortification approaches used to improve micronutrient-dense plants that are a sustainable solution to combat hidden hunger. J. Soil Sci. Plant Nutr.. 2022;22(1):475-500.
- [Google Scholar]
- Accounting spatial variability of soil properties and mapping fertilizer types using geostatistics in southern Ethiopia. Commun. Soil Sci. Plant Anal.. 2018;49(1):124-137.
- [Google Scholar]
- Micronutrient Toxicity and Deficiency. In: Wheat Improvement: Food Security in a Changing Climate. Cham: Springer International Publishing; 2022. p. :433-449.
- [Google Scholar]
- Inorganic equilibria afecting micronutrients in soils. Micronut. Agricult. 1991;4:89-112.
- [Google Scholar]
- Development of a DTPA soil test for zinc. iron. manganese. and copper 1. Soil Sci. Soc. Am. J.. 1978;42(3):421-428.
- [Google Scholar]
- Organic acid metabolism in plants: from adaptive physiology to transgenic varieties for cultivation in extreme soils. Plant. Sci.. 2000;160(1):1-13.
- [Google Scholar]
- Benefcial efects of humic acid on micronutrient availability to wheat. Soil Sci. Soc. Am. J.. 2001;65(6):1744-1750.
- [Google Scholar]
- Spatial variability in soil properties of Mango Orchards in Eastern Plateau and Hill Region of India. Vegetos-An Int. J. Plant Res.. 2016;29(3):74-79.
- [Google Scholar]
- Sampling planning of micronutrients and aluminium of the soils of São Paulo, Brazil. Geoderma Reg.. 2015;4:91-99.
- [Google Scholar]
- Testing soils for copper iron manganese and zinc. In: Westerman R.L., ed. Soil Testing and Plant Analysis. Madison: Soil Science Society of America; 1990. p. :229-273.
- [Google Scholar]
- Antioxidant supplementation restores defective leucine stimulation of protein synthesis in skeletal muscle from old rats. J. Nutr.. 2008;138(11):2205-2211.
- [Google Scholar]
- Estimation of soil erosion risk in southern part of Syria by using RUSLE integrating geo informatics approach. Remote Sens. Appl.: Soc. Environ.. 2020;20:100375
- [Google Scholar]
- Soil erosion modelling: The new challenges as the result of policy developments in Europe. Environ. Res.. 2019;172:470-474.
- [Google Scholar]
- Spatial variability in topsoil micronutrient contents in a one-hectare cropland plot. Commun. Soil Sci. Plant Anal.. 1996;27(3–4):479-503.
- [Google Scholar]
- Assessing the spatial variability of soil properties to delineate nutrient management zones in smallholder maize-based system of Nigeria. Appl. Environ. Soil Sci.. 2022;2022
- [Google Scholar]
- Geographic information system and geostatistical techniques to characterize spatial variability of soil micronutrients including toxic metals in an agricultural farm. Commun. Soil Sci. Plant Anal.. 2018;49(4):463-477.
- [Google Scholar]
- Micronutrients management: research achievements and future challenges. Ind. J. Fert.. 2008;4(12):103-106.
- [Google Scholar]
- Fifty years on: long-term patterns of Land sensitivity to desertificationdi in Italy. Land Degrad. Dev.. 2016;27(2):97-107.
- [Google Scholar]
- Pre-monsoon spatial distribution of available micronutrients and sulphur in surface soils and their management zones in Indian Indo-Gangetic Plain. PLoS One. 2020;15(6):e0234053.
- [Google Scholar]
- Micronutrient status and their spatial variability in soils of Muktsar district of Punjab–a GIS approach. J. Indian Soc. Soil Sci. 2009;57(3):300-306.
- [Google Scholar]
- Organic matter-micronutrient reactions in soil. Micronut. Agricult.. 1991;4:145-186.
- [Google Scholar]
- Spatial Variability of Some Soil Properties in an Agricultural Field of Halabja City of Sulaimania Governorate. Iraq. Fresenius Environ. Bull.. 2019;29(1):193-206.
- [Google Scholar]
- Sürücü, A., Gökmen, V., Gündoğan, R., Budak, M., 2019. Modeling and mapping of spatial variability of soil micro nutirient elements in research and application areas of Bingol University.
- Sütçü, Y.F., 2008. Türkiye Jeoloji Haritaları. No: 72. Muş-L45 Paftası. Maden Tetkik ve Arama Genel Müdrülüğü. Jeoloji Etüdleri Dairesi. Ankara.
- Characterization of spatial variability of vertisol micronutrients by geostatistical techniques in Deccan Plateau of India. Model. Earth Syst. Environ.. 2020;6:173-182.
- [Google Scholar]
- Modeling the spatial variability of soil micronutrients for site-specifc nutrient management in a semi-arid tropical environment. Model. Earth Syst. Environ.. 2020;1:1-6.
- [Google Scholar]
- Modelling the spatial variability of soil micronutrients for site specific nutrient management in a semi-arid tropical environment. Model. Earth Syst. Environ.. 2021;7:1797-1812.
- [Google Scholar]
- Spatial variability of soil physical properties in a region of the Loess Plateau of PR China subject to wind and water erosion. Land Degrad. Dev.. 2013;24(3):296-304.
- [Google Scholar]
- Geostatistics for Environmental Scientisits. England: John Willer. and Sons; 2004.
- Impact of spatial variability on interpretive modeling. Quantitative Model. Soil Forming Processes.. 1994;39:61-75.
- [Google Scholar]
- Field-scale spatial variation of saline-sodic soil and its relation with environmental factors in Western Songnen Plain of China. Int. J. Environ. Res. Public Health. 2011;8(2):374-387.
- [Google Scholar]
- Large-extent spatial heterogeneity of soil bioavailable micronutrients and the relative roles of environmental indicators on them within maize fields. Ecol. Ind.. 2021;130:108071
- [Google Scholar]


