

Translate this page into:
Modal parameters of resonant spruce wood (Picea abies L.) after thermal treatment
⁎Corresponding author. przemyslaw.mania@up.poznan.pl (Przemysław Mania)
-
Received: ,
Accepted: ,
This article was originally published by Elsevier and was migrated to Scientific Scholar after the change of Publisher.
Peer review under responsibility of King Saud University.
Abstract
For a resonant spruce wood (Picea sp.) the acoustic parameters (resonant/ modal frequency (f) and logarithmic decrement (δ)), were determined before and after thermal modification at 160 °C. The material studied came from the Romanian Carpathian mountains and was classified by luthiers as good and very good resonant wood. Thermal modification did not result in significant changes in the number of modes, but differences in the modal frequencies for individual modes were noted. Thermal modification also decreased the logarithmic decrement in the highest quality material.
Keywords
Logarithmic decrement
Resonant wood
Thermal modification

1 Introduction
Acoustic properties of musical instruments depend on the effectiveness of stimulation of wooden element vibrations (e.g. top boards of violins or guitars) by vibrations of air. This effectiveness depends on the construction of the instruments and the properties of the materials used. A violin of the same construction but made of wood of different properties will give different sound. The most important parameters of wood determining its acoustic properties include: density, elasticity modulus and damping (Bucur, 2006). The effectiveness of stimulation of the resonant boards is the greater the lower the wood density and the higher its elasticity modulus. These demands are contradictory because the wood elasticity modulus is proportional to its density (Kollmann and Côté, 1968; Bucur, 2006; Wegst, 2006). This is one of the reasons why it is so difficult to find good resonant wood. Much effort has been devoted to explain the excellent sound of antique violin instruments and find methods of wood modification reducing the wood inhomogeneities and improving the relation between the elasticity modulus and density (E/ρ) (Hunt and Balsan, 1996; Nagyvary et al., 2006; Spycher et al., 2008; Schwarze et al., 2008; Stoel and Borman, 2008).
Thermal modification of wood is known to decrease its density and, in mild conditions of the process, it can lead to increase in the linear elasticity modulus and hardness. Increased ratio of E/ρ (elasticity modulus/ density) known also as the specific elasticity modulus, improves the wood acoustic properties, in particular: sound propagation velocity, acoustic resistance, musical constant and damping through radiation. Thermal treatment can also have negative effect on these properties as it can lead to cracks between cells and microcracking in the cell wall. Then, although the specific elasticity modulus is improved, these defects cause an increase in the internal damping (logarithmic decrement), which can disqualify the usability of the modified wood for production of resonant boards. For this reason, the logarithmic decrement seems to be a particularly important parameter describing the suitability of wood for making musical instruments, more important than the propagation rate of acoustic wave, acoustic constant and acoustic resistance (Ono and Norimoto, 1984; Yano et al., 1993).
Logarithmic decrement describes the dissipation of energy of vibrations, so it characterizes the internal damping of absorbed sound (Bucur and Böhnke, 1994; Gough, 2000). This parameter has not been sufficiently understood for thermally modified wood used for making top boards of violins. Thermal degradation of hemicellulose, which is a kind of linking agent between cellulose and lignin in the cell wall, can lead to the appearance of new voids in this substance, which can change the internal damping of acoustic waves.
The aim of the study was to determine and compare modal frequencies and logarithmic decrements before and after thermal modification at 160 °C.
2 Material and methods
The study was performed for 8 radially cut out planks from spruce wood of different suitability for resonant boards production, obtained from trees growing in Eastern Romanian Carpathians near Maramureș. All planks were classified by luthiers to three groups of resonant wood quality, classes I, II and III, according to BN-70/9221-06. The planks were also characterized by different widths of annual rings and different contribution of latewood in them. These macrostructural differences were responsible for different densities and elasticity of the planks. The samples density was determined according to the method recommended by ISO 13061-2:2014. Moisture content of all samples was 9.5%.
Modal analysis was performed on samples of the size 350 (in longitudinal direction) × 130 (in radial direction) × 5 mm (in tangential direction). On the surface of the wood samples 330 measuring points, separated by the distances 12 × 12 mm, were chosen (Fig. 1). For modal experiment the samples were mounted in a box with a mass of 940 g by clamping longer sides in the direction perpendicular to the main surface.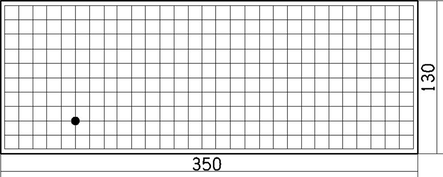
Measuring points for modal analysis of a wood sample and the site of accelerometer attachment – a black dot.
Similarly as in other papers (Mania et al., 2017, 2015; Skrodzka et al., 2013), in this study the experimental modal analysis with a fixed point of response and varied point of excitation was made. The response signal of the structure was measured by an accelerometer NP – 2910 made by Ono Sokki, Tokio, Japan, of 2 g in mass, attached to the sample’s surface with the use of bee wax (Fig. 1). The sample was excited by an impact hammer with a force transducer, (PCB Piezoelectronics Impact Hammer Model 086C05, New York). The impact of this hammer gives a signal of a wide spectrum to the object studied. The impact force is measured by a piezoelectric force transducer. The accelerometer and impact hammer were connected to Ono Sokki analyzer CF 5210. The modal parameters were calculated using the software packet SMS STAR Modal. Measurements were made for the frequencies 0 – 6800 Hz with the spectral resolution of 3 Hz. At one measuring site, 10 impacts were made by the impact hammer and then the computer program gave averaged results in the frequency domain. Each measurement was controlled by the coherence function. On the basis of these signals, the Frequency Response Functions (FRFs) were calculated between all the measuring points excited by the hammer and the fixed response point at which the acceleration was measured.
The damping factor δ was defined as:
where: f0 – resonant frequency (Hz),
Δf – the width of the peak at the amplitude 3 dB below the resonant frequency (Hz).
After modal analysis, all samples were subjected to thermal modification by the most often used method, in the steam atmosphere, according to the procedure ThermoWood (Viitaniemi et al., 1997; González-Peña and Hale, 2007; Boonstra, 2008; Moliński et al., 2010). Wood modification was carried out in laboratory conditions at 160 °C, applied for 8 h. After thermal treatment, the samples were conditioned in laboratory conditions. When the samples reached the equilibrium moisture content the same as before the modification, the samples were subjected to modal analysis in the same conditions.
3 Results and discussion
The samples density slightly decreased as a result of thermal treatment, which confirms earlier reports (Gündüz et al., 2008; González-Peña and Hale, 2009). The mean values of wood density before and after thermal treatment are given in Table 1.
Density ρ [kg/m3]
Sample number
1
2
3
4
5
6
7
8
before
455
400
360
480
500
460
475
415
after
440
390
350
465
480
445
460
400
According to the data presented in Table 1, the thermal treatment at 160 °C caused slight decrease in wood density, by about 3.3%.
In Table 2 the results of modal analysis of spruce wood samples before thermal treatment are shown; only characteristic and best pronounced modes obtained in the studied frequency range are listed. The Table gives the resonant frequency (f, [Hz]) of the modes showing modal damping not higher than 10%. Systems or materials with the percentage of critical damping lower than 10% can be classified as linear (Ewins, 1995; Skrodzka et al., 2009, 2013) and only linear materials can be subjected to modal analysis.
Sample number
Number of mode
1
2
3
4
5
6
7
8
Modal frequency, f [Hz]
1
600
645
560
595
620
615
580
610
2
1110
1230
1100
1130
1150
1140
1090
1140
3
1530
1670
1480
1650
1400
1540
1570
1590
4
2210
–
2360
2250
2350
2380
2290
2310
5
2750
2560
2530
2700
2680
–
–
2750
6
–
3100
3080
3140
3160
3200
3170
3210
7
3430
–
3560
–
3550
–
–
3560
8
4000
4000
3950
3930
3960
4010
4060
–
9
4570
4450
4550
4450
4330
4360
4320
4410
10
5260
5310
5220
4890
5190
4830
4910
5060
11
5630
5510
5580
5520
5510
5610
–
5520
12
–
6410
6160
–
5890
6010
–
5970
As follows from Table 2, the number of modes in the analyzed range of frequencies was not the same for all spruce wood samples. Only for two samples 12 different modes were observed and these results were treated as reference for the results obtained for the other samples. All planks were subjected to thermal modification and then the modal analysis was repeated. Table 3 presents the modal frequencies determined for the samples after thermal modification.
Sample number
Number of mode
1
2
3
4
5
6
7
8
Modal frequency, f [Hz]
1
610
620
610
680
700
600
640
660
2
1180
1270
1170
1200
1250
1190
1140
1120
3
1500
–
–
1540
1570
1610
1540
1580
4
1960
1820
2010
1910
1930
1980
1970
2040
5
2430
2430
2440
2570
2580
2480
2510
2550
6
2760
2770
2820
2740
2780
2800
2760
2710
7
3300
3330
3140
3070
–
3090
–
3240
8
3970
3990
3910
–
3920
3910
4010
–
9
4780
4830
4720
4580
4630
4610
4590
4720
10
5320
5370
5280
5390
5460
5240
5310
5360
11
5760
–
5710
5590
–
5720
5750
5790
12
–
5960
6240
6330
6060
6230
6140
6250
Analysis of the data presented in Table 3 shows that thermal modification had ambiguous effect on modal frequencies. In the range of low frequencies 0–1600 Hz, the frequency of modes increased on average by about 3.5%. In the range of higher frequencies 2300–3500 Hz the modal frequency decreased by about 10%. The most pronounced changes were noted in the frequencies of modes number 4 and 6, whose frequency decreased by 15 and 12%, respectively. In the range of the highest frequencies (4400–6800 Hz) the modal frequency increased by about 4%. Reduction of the modal frequency was also observed for the wood samples selected for production of xylophone keys (Kang et al., 2016), subjected to thermal modification. In all studies mentioned the modal frequency decreased in the entire band. The change in modal frequency was also observed as result of other methods of wood modification. Yano et al. (1993) have found that a small change in frequency after the process of acetylation was caused mainly by the change in the equilibrium moisture content in the samples conditioned in the same conditions. Changes were also noted in the sound propagation rate.
Fig. 2 presents the example frequency response function (FRF) for the untreated and thermal treated wood samples.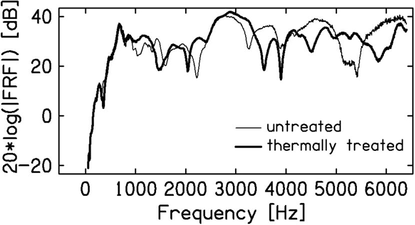
Examples of the FRFs measured for spruce samples before and after thermal treatment.
In both curves the number of peaks corresponding to the characteristic modes is similar, but frequencies of modal peaks differ for thermally treated and not thermally treated samples, as could be expected. For details see Tables 2 and 3. Another analyzed parameter was logarithmic decrement. In Table 4 the experimentally determined logarithmic decrement for spruce wood before thermal modification is presented. To give some insight to obtained values comparison of logarithmic decrement of samples no. 2, 3 and 5 before and after thermal modification are shown in Fig. 3.
Sample number
Number of mode
1
2
3
4
5
6
7
8
Logarithmic decrement, δ [-]
1
0.0376
0.0186
0.0236
0.0345
0.0333
0.0303
0.0299
0.0295
2
0.0416
0.0207
0.0270
0.0332
0.0329
0.0299
0.0291
0.0288
3
0.0451
0.0239
0.0283
0.0416
0.0494
0.0404
0.0370
0.0378
4
0.0455
–
0.0288
0.0393
0.0379
0.0337
0.0327
0.0336
5
0.0472
0.0323
0.0352
0.0516
0.0524
–
–
0.0444
6
–
0.0392
0.0383
0.0564
0.0565
0.0502
0.0473
0.0484
7
0.0491
–
0.0422
–
0.0689
–
–
0.0598
8
0.0555
0.0472
0.0420
0.0668
0.0668
0.0595
0.0547
–
9
0.0551
0.0478
0.0433
0.0640
0.0663
0.0593
0.0558
0.0566
10
0.0583
0.0483
0.0446
0.0733
0.0696
0.0674
0.0618
0.0622
11
0.0585
0.0531
0.0473
0.0724
0.0731
0.0647
–
0.0635
12
–
0.0555
0.0517
–
0.0787
0.0695
–
0.0676
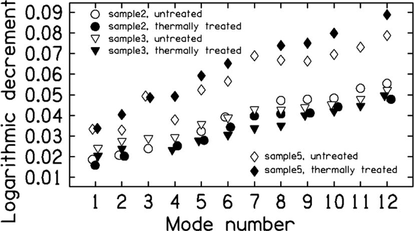
Comparison of logarithmic decrement before and after thermal modification for samples no.2, 3 and 5.
In the entire range of frequencies considered and for each sample studied, the logarithmic decrement increased with increasing resonant frequency. The average logarithmic decrement for all samples was 0.0473. The lowest average values of 0.0387 and 0.0377 were obtained for samples number 2 and 3, respectively. Moreover, the same samples showed the lowest densities 400 and 360 kg/m3. According to literature, the logarithmic decrement of wood suitable for construction of musical instruments should take the lowest possible values (Holz, 1984; Bucur and Böhnke, 1994; Beldan and Pescaru, 1996; Gough, 2000). Thus, it can be concluded that samples no. 2 and 3 belonged to a higher class of wood than the other ones. The highest average logarithmic decrement of 0.0572 was obtained for sample no. 5.
The results are not much different than the literature data. For instance, Buksnowitz (2006) who studied resonant wood in a wide range of resonant frequencies obtained the logarithmic decrement of 0.0404. Haines et al. (1977) who studied the properties of Sitka spruce wood for construction of guitars reported the logarithmic decrement varying in the range 0.025–0.075. Spycher et al. (2008) has reported obtaining the experimental logarithmic decrement of 0.043, while Halachan et al. (2017) who has reported modal analysis of resonant spruce wood obtained the value of 0.026.
Table 5 presents logarithmic decrement determined for spruce wood after thermal modification and after reaching equilibrium moisture content at the same level as before modification.
Sample number
Number of mode
1
2
3
4
5
6
7
8
Logarithmic decrement, δ [-]
1
0.0370
0.0158
0.0198
0.0380
0.0377
0.0293
0.0318
0.0263
2
0.0387
0.0202
0.0231
0.0396
0.0404
0.0277
0.0287
0.0265
3
0.0427
–
–
0.0418
0.0487
0.0440
0.0329
0.0330
4
0.0500
0.0252
0.0226
0.0448
0.0493
0.0330
0.0345
0.0367
5
0.0461
0.0279
0.0271
0.0536
0.0592
0.0356
0.0418
0.0415
6
0.0472
0.0343
0.0299
0.0591
0.0652
0.0574
0.0463
0.0443
7
0.0479
0.0397
0.0331
0.0626
–
0.0578
–
0.0495
8
0.0571
0.0407
0.0344
–
0.0739
0.0585
0.0521
–
9
0.0594
0.0411
0.0394
0.0636
0.0750
0.0587
0.0525
0.0578
10
0.0580
0.0441
0.0414
0.0770
0.0798
0.0647
0.0605
0.0598
11
0.0581
–
0.0439
0.0731
–
0.0691
0.0623
0.0636
12
–
0.0478
0.0490
0.0782
0.0888
0.0693
0.0634
0.0623
Thermal modification at 160 °C caused changes in the logarithmic decrement for each mode and for each sample. For each frequency certain fluctuations of this parameter were observed. The greatest changes were noted for samples no. 2 and 3 for whose logarithmic decrement was reduced on average by 13 and 12%, respectively from 0.0387 to 0.0337 and from 0.0377 to 0.0331. For sample no. 8 this parameter decreased from 0.0484 to 0.0456, so by about 6%. In some samples thermal modification led to an increase in logarithmic decrement, for samples no. 4 and 5 by 8%, while for sample 7 by 6%. For samples no. 1 and 6, the average value of logarithmic decrement did not change. As follows from the above, the process of thermal modification had different effects on logarithmic decrement value. Similar results have been obtained by Kang et al. (2016) who thermally modified for the wood chosen for production of xylophone keys also reported that logarithmic decrement increased or decreased for different samples. Wu et al. (2016) has described similar changes in logarithmic decrement of samples from dawn redwood (Metasequoia glyptostroboides). Different methods of modification can bring different changes in this parameter. For instance Kubojima et al. (1998) have modified the wood for piano boards in nitrogen atmosphere and reported that for each variant analyzed, the logarithmic decrement decreased. Čulík et al. (2014) who modified resonant wood with fluid glass have obtained the opposite results as the logarithmic decrement values significantly increased.
However, some tendency can be observed: logarithmic decrement decreased, which means that from the acoustic point of view – was improved for the samples of the lowest density, samples no. 2 and 3 (400 kg/m3 and 360 kg/m3 before modification; 390 kg/m3 350 kg/m3 after modification). These two samples were classified by luthiers as good and very good. The logarithmic decrement increased (its average value increased) for the samples of the highest density, no. 4 and 5 (480 kg/m3 and 500 kg/m3 before modification; 465 kg/m3 480 kg/m3 after modification), classified by luthiers as of average quality.
One of possible reasons for this phenomenon can be the microcrackings appearing in wood tissue upon its modification. In the process of thermal modification, besides relaxation of growth stress, new stress appears in particular in close vicinity of anatomical elements differing in the thickness of cell walls, so also in the wood density. The tissue of higher density shows greater stiffness and lower deformability, so has a lower tendency to energy dissipation. The stiff elements are characterized by the highest stress because of the tissue coherence, which means that showing lower deformability they are the sites at which microcrackings are likely to form. This mechanism often leads to the cracking of wood at the borders of annual rings (Boonstra et al., 2006; Welzbacher et al., 2011). Other sites of potential wood cracking are the borders between the radial and axial tissues, at which radial cracks may appear. The formation of such structural defects is fostered by different anisotropy of moisture-related deformations of earlywood and latewood; the latewood tracheids undergo almost isotropic shrinking, while the earlywood ones show clearly anisotropic shrinking (Patera et al., 2011; Rafsanjani et al., 2012).
The resonant spruce wood that should show low density and its lowest possible gradient in individual annual rings, should also be less susceptible to developing these defects than the wood of high density and greater density gradient in annual rings. The appearance of additional discontinuities in wood tissue, e.g. crackings, contributes to increasing damping of sound waves.
4 Conclusions
The results of modal analysis of resonant spruce wood samples before and after thermal treatment lead to the following conclusions.
-
Thermal modification of spruce wood has brought about insignificant changes in the mean resonant frequency values. However, analysis of changes in particular frequency ranges revealed that in the range ∼2.3–3.5 kHz, the resonant frequency decreased by over 10%.
-
No significant differences in the number of modes of vibrations for particular resonant boards were found.
-
Thermal modification has different effect on the logarithmic decrement, however, the results show a tendency to improve the acoustic properties of wood samples classifies as of the highest quality.
Acknowledgements
The paper was financed within the framework of Ministry of Science and Higher Education programme ‘Regional Initiative of Excellence’ in years 2019-2022, Project No. 005/RID/2018/19.
Declaration of Competing Interest
The authors declare that they have no known competing financial interests or personal relationships that could have appeared to influence the work reported in this paper.
References
- Beldan, E.C., Pescaru, P., 1996. Research on the acoustic quality classes of resonant spruce wood in Romania. In: Tenth International Symposium on Non-Destructive Testing of Wood, Lausanne Switzerland, August 26–28, 43–52.
- Boonstra, M.J., 2008. A two-stage thermal modification of wood. Ph.D. dissertation in co-supervision Ghent University and Université Henry Poincaré - Nancy 1, 297. https://doi.org/1854/10505.
- Microstructural and physical aspects of heat treated wood. Part 1. Softwoods. Maderas, Cienc. Tecnol.. 2006;8(3):193-208.
- [CrossRef] [Google Scholar]
- BN-70/9221-06. Drewno rezonansowe z drzew iglastych. (in Polish).
- Bucur, V., 2006. Acoustics of Wood, second ed. Springer Verlag. https://doi.org/10.1007/3-540-30594-7.
- Factors affecting ultrasonic measurements in solid wood. Ultrasonics. 1994;32:385-390.
- [CrossRef] [Google Scholar]
- Buksnowitz, C., 2006. Resonant wood of Picea abies. Doctoral Thesis - Institute of Wood Science and Technology Vienna University of Natural Resources and Applied Life Sciences - BOKU Vienna, 211 pp.
- Čulík M., Danihelová A., Danihelová Z., Spišiak D., 2014. Physical-acoustical characteristics of spruce wood modified with the solution of water glass. In: Conference: 3rd Conference on Building Physics and Applied Technology in Architecture and Building Structures At: Vienna.
- Ewins D.J., 1995. Modal Testing: Theory and Practice, Research Studies Press Ltd., Taunton, Somerset, England, 1-313.
- González-Peña, M.M., Hale, M.D.C., 2009. Colour in thermally modified wood of beech, Norway spruce and Scots pine. Part 2: Property predictions from colour changes. Holzforschung. https://doi.org/10.1515/HF.2009.077.
- González-Peña, M.M., Hale, M.D.C., 2007. The relationship between mechanical performance and chemical changes in thermally modified wood. In: Hill, C.A.S. (Ed.), The Third European Conference on Wood Modification, 15–16th October, Cardiff, UK.
- The effects of heat treatment on physical and technological properties and surface roughness of Camiyanı Black Pine (Pinus nigra Arn. subsp. pallasiana var. pallasiana) wood. Bioresour Technol. 2008
- [CrossRef] [Google Scholar]
- Mechanical properties of Sitka spruce for guitars. J. Acous. Soc. Am.. 1977;61:S35.
- [CrossRef] [Google Scholar]
- Physico-acoustic characteristics of spruce and larche wood. Wood Res.. 2017;62(2):235-242.
- [Google Scholar]
- On some relations between anatomic properties and acoustical qualities of resonant wood. Holztechnologie. 1984;25(1):31-36.
- [Google Scholar]
- ISO 13061-2:2014. Physical and mechanical properties of wood — test methods for small clear wood specimens — Part 2: determination of density for physical and mechanical tests.
- Effect of heat treatment on the acoustic properties of a wooden xylophone keyboard. J. Fac. Agriculture Kyushu Univ.. 2016;61(1):157-163. https://doi.org/2324/1564098
- [Google Scholar]
- Kollmann, F., Côté, W.A., 1968. Principles of Wood Science and Technology. B. Heideberg. https://doi.org/10.1007/978-3-642-87928-9.
- Vibrational properties of Sitka spruce heat-treated in nitrogen gas. J. Wood Sci.. 1998;44(1):73-77.
- [CrossRef] [Google Scholar]
- Differences in the modal and structural parameters of resonant and non-resonant wood of spruce (Picea abies L.) Acta Phys. Pol. A. 2015;127(1):110-113.
- [CrossRef] [Google Scholar]
- Investigation of modal behaviour of resonant Spruce wood samples (Picea abies L.) Arch. Acoust.. 2017;42(1):23-28.
- [CrossRef] [Google Scholar]
- Properties of thermally modified Ash Wood (Fraxinus americana) in the aspect of its affinity to water. Ann. WULS For. Wood Technol.. 2010;72:27-31.
- [Google Scholar]
- On physical criteria for the selection of wood for soundboards of musical instruments. Rheol. Acta. 1984;23:652-656.
- [CrossRef] [Google Scholar]
- Patera A., Griffaa M., Deromeb D., Carmelieta J., 2011. Analysis of Latewood/Earlywood Coupling Effects on Swelling/Shrinkage by Synchrotron Radiation Phase Contrast X-ray Tomographic Microscopy and 3D image analysis. COST Action FP0802. April 27‐28, 2011 Vila Real, Portugal.
- Computational up-scaling of anisotropic swelling and mechanical behavior of hierarchical cellular materials. Compos. Sci. Technol.. 2012;72(6):744-751.
- [CrossRef] [Google Scholar]
- Superior wood for violins - wood decay fungi as a substitute for cold climate. New Phytol.. 2008;179:1095-1104.
- [CrossRef] [Google Scholar]
- Mechanical and optical investigation of dynamic behavior of violins at modal frequencies. Appl. Opt.. 2009;48:C165-C170.
- [CrossRef] [Google Scholar]
- Modal parameters of two violins with different varnish layers and subjective evaluation of their sound quality. Arch. Acoust.. 2013;38(1):75-81.
- [CrossRef] [Google Scholar]
- Assessment of resonant wood quality by comparing its physical and histological properties. Wood Sci. Technol.. 2008;42:325-342.
- [CrossRef] [Google Scholar]
- A comparison of wood density between classical Cremonese and modern violins. PLoS One. 2008;3(7):e2554
- [CrossRef] [Google Scholar]
- Viitaniemi P., Jämsä S., Ek P., Viitanen H., 1997. Pat.US-5678324. Method for improving biodegradation resistance and dimensional stability of cellulosic products. Appl.545791, 13.5.1994. Publ. 21.10.1997.
- Microstructure, strength and structural integrity of head-trated beech and spruce wood. Wood Mat. Sci. a. Eng.. 2011;6(4):219-227.
- [CrossRef] [Google Scholar]
- Influence of different pretreatments on the acoustic properties of dawn redwood (Metasequoia glyptostroboides Hu et Cheng) BioResources. 2016;11(1):2734-2743.
- [CrossRef] [Google Scholar]
- Stabilization of acoustical properties of wooden musical instruments by acetylation. Wood Fiber Sci.. 1993;25:395-403.
- [Google Scholar]


