

Translate this page into:
Mitigation of diabetes type II-induced nephropathy by ellagic acid nanoformulations: Amended glycemic control, oxidative stress, inflammation, and induced apoptosis
⁎Corresponding authors at: Pharmaceutical Research Institute, Albany College of Pharmacy and Health Sciences, 1 Discovery Drive, Rensselaer, NY 12144, USA (S. Mousa) and King Fahd Medical Research Center, King Abdulaziz University, Jeddah, Saudi Arabia. Yousef Abdul Latif Jameel Scientific Chair of Prophetic Medicine Application, Faculty of Medicine, King Abdulaziz University, Jeddah, Saudi Arabia (Steve Harakeh). sharakeh@gmail.com (Steve Harakeh), shaker.mousa@acphs.edu (Shaker Mousa)
-
Received: ,
Accepted: ,
This article was originally published by Elsevier and was migrated to Scientific Scholar after the change of Publisher.
Peer review under responsibility of King Saud University.
Abstract
Diabetic nephropathy is a significant medical condition that arises from elevated blood sugar levels associated with both type I and type II diabetes. Recent research has indicated that ellagic acid (EA), either alone or in combination with other medications, can provide anti-diabetic benefits. This study aimed to explore the effects of EA and EA nanoformulations (EN) on nephropathy induced by type II diabetes in rats, while also investigating the underlying mechanisms at play. To induce type II diabetes, rats were fed a high-fat diet for four weeks, followed by a single intraperitoneal dose of streptozotocin (35 mg/kg), and continued on the high-fat diet for an additional four weeks. Diabetic rats were then treated with Metformin (M), EA, EN, EA + M, or EN + M for four weeks. The findings revealed that treatment with EN and the combination of M led to significant reductions in serum urea and creatinine levels, indicating an improvement in renal function. Additionally, EN and/or M effectively mitigated lipid peroxidation (LPO) levels in the affected kidneys, reduced fasting serum glucose, and lowered C-reactive protein (CRP) levels. Moreover, EN and/or M demonstrated the ability to prevent diabetes-induced histological alterations in the kidney glomeruli and tubules, as well as reduce collagen mesangial matrix formation. The presence of caspase 3, an apoptotic mediator, was significantly reduced in the kidneys of diabetic rats treated with EN and/or M. In conclusion, EN and/or M have the potential to prevent nephropathy induced by type II diabetes by enhancing glycemic control, reducing oxidative stress and inflammation, and scavenging free radicals, all of which contribute to apoptotic changes in kidney tissue.
Keywords
Diabetes type II
Kidney
Ellagic acid
Nanoformulations
Lipid peroxidation
C reactive protein
Caspase 3

1 Introduction
Diabetic nephropathy is an extremely critical health concern that arises from a multifaceted microvascular disease, which is primarily a result of both type I and type II diabetes. This condition can lead to significant damage to the kidneys and can even result in complete kidney failure if not diagnosed and treated early (Selby and Taal, 2020; Lim, 2014; Faselis, 2020). Globally, diabetic nephropathy stands as the primary cause of chronic renal disease and end-stage kidney failure (Ghaderian, 2015). Around 21% of individuals living with type I diabetes for a duration of 17 years are affected by chronic renal disease. Additionally, diabetic nephropathy is observed in approximately 20% to 40% of individuals with type II diabetes (Gheith, 2016; Piscitelli, 2017).
Multiple studies have provided compelling evidence indicating that elevated blood glucose levels (hyperglycemia) serve as a significant and modifiable risk factor for the development of diabetic nephropathy. In line with a significant body of evidence, high levels of free radicals and their link to oxidative stress are key factors involved with the pathophysiology and course of diabetes micro- and macrovascular complications (Chawla et al., 2016). Various mechanisms have been suggested to explain the development of diabetic nephropathy, which involve the generation of oxygen free radicals, the accumulation of advanced glycation end products, and the activation of intracellular signaling molecules (Nowotny, 2015). C-reactive protein (CRP) is a protein that is synthesized and released as part of the acute-phase response in reaction to inflammation and damage to tissues (Szalai and McCrory, 2002). In that regards, excess levels of CRP are linked to the occurrence of renal microalbuminuria and kidney dysfunction in type II diabetic patients revealing an association between CRP and the pathogenesis of diabetic nephropathy (Overgaard, 2013; Wang, 2013). Apoptosis is repeatedly associated with diabetic nephropathy. This is a programmed cell death process and is induced by caspases 3, 6, and 7 affecting over 600 substrates. A recently published study found that Z-DEVD-FMK, a specific caspase-3 inhibitor, improved albuminuria, renal function, and tubular interstitial fibrosis (Wen, 2020).
Natural herbs are traditionally used in the treatment of a variety of human health problems, including diabetes (Das and Ghosh, 2017). Antioxidants found in various medicinal plants help reduce the oxidative stress caused by diabetes. Traditional herbal medicine for diabetes is highly suitable for oral treatment due to its affordability, effectiveness, low toxicity, minimal or negligible side effects, and endorsement by the World Health Organization (WHO) for further study and utilization (Day, 1998). Pomegranates, strawberries, blackberries, blackcurrants, raspberries, and grapes, as well as walnuts and almonds, are good dietary sources of ellagic acid (EA), a polyphenolic component. (Zhou, 2016). Several studies showed that EA has positive health benefits against a variety of cancers, cardiovascular illnesses, and neurological disorders that have been linked to oxidative damage. In addition, to these antioxidant and antimicrobial benefits, EA also promotes wound healing (Ceci, 2020). Based on human and animal research, ellagic acid has demonstrated a range of biological effects, including antioxidant and anti-inflammatory properties (Qiu, 2013). Numerous investigations have recently indicated that EA, alone or in conjunction with other medicines, has anti-diabetic properties (Nankar and Doble, 2017; Savi, 2017; Polce, 2018; Harakeh, 2020). There has been limited exploration in the literature regarding the protective effects of ellagic acid (EA) on renal damage, specifically its role in mitigating diabetic nephropathy (Zhou, 2019). The clinical applications of ellagic acid (EA) have been limited due to its chemical nature, which results in poor water solubility (9.7 ± 3.2 g/ml) and a pharmacokinetic profile characterized by limited absorption rate and short plasma half-life (1 h after ingestion of pomegranate juice) (Ceci, 2020), The objective of this research was to enhance the bioavailability and optimize the pharmacokinetics of ellagic acid (EA) through the utilization of a nano delivery system. The study aimed to investigate the implications of this improved formulation in the context of type II diabetes, specifically focusing on its potential effects on Streptozotocin (STZ)-induced diabetic nephropathy in rats. Furthermore, the study sought to elucidate the underlying mechanisms involved in comparison to the effects of EA alone.
2 Materials and methods
2.1 Drugs and Chemicals
STZ and EA were obtained from Sigma Chemicals Co. (St. Louis, Missouri, USA). Glucophage tablets containing 500 mg metformin (M) were purchased from Alnahdi Pharmacy, Jeddah, Saudi Arabia. The EN used in the study was produced and characterized following the same methods as described in our previous research (El-Shitany, 2019).
2.2 Laboratory animals and managements
A total of twenty-two adult male Sprague-Dawley rats, with weights ranging from 175.5 to 208.3 g, were obtained from the animal house of King Fahd Research Center, King Abdulaziz University, Jeddah, Saudi Arabia. The rats were housed at a controlled room temperature of 25 ± 2 °C. During an adaptation period of one week, they were provided with unlimited access to food and water. The welfare and treatment of the rats followed the guidelines outlined in the Declaration of Helsinki for the use of laboratory animals and complied with the NIH criteria (Touitou, 2004).
2.3 Induction of type II diabetes model
The establishment of the type II diabetes model involved an 8-week administration of a high-fat diet. After 4 weeks, a single dose of STZ (35 mg/kg) was injected into the abdominal cavity of the rats (Guo, 2018) hree days following the STZ injection, blood glucose levels were measured, and rats with a glucose level of 220 mg/dl or higher were classified as diabetic.
For a duration of four weeks after diabetes induction, the rats were treated with different formulations: the standard ellagic acid (EA), nano-formulated ellagic acid (EN), and their combination with metformin (EA + M and EN + M). The rats were divided into several groups: control (C) group (3 rats), diabetic (D) group (4 rats), M group (3 rats), EA group (3 rats), EN group (3 rats), EA + M group (3 rats), and EN + M group (3 rats). The doses used were as follows: M dose (300 mg/kg) [Katakam et al., 2000], E dose (10 mg/kg) [Amin et al., 2017], and EN dose (10 mg/kg) (Harakeh, 2020). At the conclusion of the experiment, changes in body weight were recorded for all the animals.
2.4 Sample collection
Fasting blood samples were collected from all anesthetized rats directly from the heart into non-heparinized test tubes. The blood samples were centrifuged to separate the serum, which was subsequently frozen and stored at −80 °C for further analysis. Following the blood collection, the animals were euthanized by cervical dislocation. The abdomen was opened, and the kidneys were carefully excised, washed with 0.9% normal saline solution, and weighed. The kidneys were then either frozen at −80 °C or preserved in 10% neutral buffered formalin solution for subsequent experimentation.
2.5 Calculation of kidney index (%)
The right and left kidneys weight was divided by the animal final body weight and multiplied by 100.
2.6 Assay of fasting serum glucose levels
The quantification of fasting serum glucose was conducted using a colorimetric kit obtained from Reactivos GPL, located in Barcelona, Spain. The measurement procedure followed the instructions provided by the manufacturer, ensuring adherence to the recommended guidelines for accurate and reliable results.
2.7 Assay of serum creatinine and urea levels
Serum creatinine and urea levels were determined using the Crescent Diagnostics kit from Saudi Arabia, following the guidelines provided by the manufacturer. The measurement of creatinine and urea in the serum samples was performed according to the recommended instructions of the kit.
2.8 Assay of serum CRP levels
Serum C-reactive protein (CRP) levels were assessed using the fully automated ELISA DSX best 2000® microtiter plate system and ELISA kits specifically designed for CRP (cat. No. MBS2505217), following the instructions provided by the manufacturer.
2.9 Assay of kidney lipid peroxidation product (LPO) and total antioxidants capacity (TAC) levels
The frozen kidneys were homogenized in ice-cold phosphate buffer (pH 7.4) and 2% triton X-100 at a concentration of 50% (w/v). Afterward, the homogenates were centrifuged at 10,000 rpm at 4 °C for 10 min. The resulting supernatants were utilized to measure lipid peroxidation (LPO) and total antioxidant capacity (TAC) using kits provided by Biodiagnostic Egypt, following the manufacturer's instructions.
3 Histopathology and immunohistochemistry assays of kidneys
The kidney sections, fixed with formalin, were subjected to staining with hematoxylin and eosin (H&E) to visualize the tissue morphology. Additionally, immunohistochemical staining for caspase-3 was performed on separate sections using caspase-3 antibodies obtained from Lab Vision (Fremont, Canada). The immunoperoxidase reaction utilizing peroxidase/anti-peroxidase (PAP) was employed for this purpose. (Sinclair et al., 1981).
3.1 Statistical analysis
The data were expressed as mean ± standard error and analyzed using the GraphPad Prism version 5 statistical software (New York, USA). To determine statistical differences between groups, the one-way analysis of variance (ANOVA) test followed by Tukey's multiple comparison test was employed. The significance level was set at p ≤ 0.05.
4 Results
4.1 Effect of EA, EN, EA + M, and EN + M on Rats’ final body Weights, kidney Weights, kidney Indices, and serum glucose levels
The findings presented in Table 1 indicate that the induction of type II diabetes resulted in a significant decrease in the rats' final body weights (p < 0.01) and a substantial increase in fasting glucose levels (p < 0.001) eight weeks after diabetes induction, compared to the control group. Data are presented as mean ± standard error. C: control group, D: diabetes group, M: metformin group, EA: ellagic acid group, EN: nanoformulated ellagic acid group, EA + M: ellagic acid + metformin group, and EN + M: nanoformulated ellagic acid + metformin group.
Experimental groups
Final body weight (g)
Kidney’s weight
(g)Kidney index (%)
Serum glucose
(mg/dL)
C
188.4 ± 1.4
0.79 ± 0.5
0.42 ± 0.03
109.2 ± 4.6
D
179.6 ± 1.9a
0.85 ± 0.8
0.48 ± 0.05
444.3 ± 6.6a
M
206.8 ± 0.9b
0.80 ± 0.2
0.39 ± 0.09
318.5 ± 18.9b
EA
193.7 ± 0.5b, c
0.69 ± 0.2
0.36 ± 0.08
440.1 ± 11.5c
EN
205.8 ± 0.7b, d
0.71 ± 0.1
0.35 ± 0.06
321.1 ± 11.1b, d
EA + M
196.4 ± 0.5b, c
0.89 ± 0.1
0.45 ± 0.06
396.2 ± 1.7c
EN + M
202.7 ± 0.2b
0.63 ± 0.0
0.31 ± 0.02
358.7 ± 26.7b
Regarding fasting serum glucose levels, treatment with EN and EN + M led to significant reductions in serum glucose levels (p < 0.001 and p < 0.01, respectively) compared to the D group levels. However, EA alone and in combination with M showed no effect on fasting serum glucose levels when compared to the untreated D group. There were no significant differences observed in the glucose-lowering effect between M and EN, as well as between M and EN + M. Additionally, EN significantly decreased fasting serum glucose levels (p < 0.01) compared to the EA group.
In terms of final body weights, treatment with EA, EN, EA + M, and EN + M significantly increased the rats' final body weights (p < 0.001 for all comparisons) compared to the values observed in the D group. Notably, EN significantly increased the rats' body weights (p < 0.001) compared to the EA group. However, the final body weights of rats in the EA and EA + M groups remained significantly lower (p < 0.001) compared to the M group. No significant differences were observed in kidney weight and kidney indices among all experimental groups (Table 1).
4.2 Effect of EA, EN, EA + M, and EN + M on Rats’ serum urea and creatinine levels
The results presented in Table 2 showed that induction of type II diabetes significantly increased the rats’ serum urea (p < 0.001) as well as the level of serum creatinine levels (p < 0.001) 8 weeks after diabetes induction in comparison to the C group values. Data are presented as mean ± standard error. C: control group, D: diabetes group, M: metformin group, EA: ellagic acid group, EN: nanoformulated ellagic acid group, E + M: ellagic acid + metformin group, and EN + M: nanoformulated ellagic acid + metformin group.
Experimental groups
Urea (mg/dL)
Creatinine (mg/dL)
C
24.0 ± 1.7
0.26 ± 0.02
D
62.5 ± 6.1a
0.60 ± 0.04a
M
42.0 ± 4.0b
0.55 ± 0.04
EA
44.3 ± 0.7b
0.52 ± 0.05
EN
34.7 ± 4.5b
0.43 ± 0.03b
EA + M
44.0 ± 2.5b
0.49 ± 0.02
EN + M
30.7 ± 0.7b
0.42 ± 0.02b
In terms of serum urea levels, the administration of EA, EN, EA + M, and EN + M to rats resulted in significant reductions (p < 0.05, p < 0.01, p < 0.05, and p < 0.001, respectively) compared to the values observed in the D group. Notably, there were no significant differences observed in the ability of EA compared to EN, M compared to EN, and M compared to EN + M in reducing urea levels.
Regarding serum creatinine levels, the administration of EN and EN + M to rats resulted in a significant reduction (p < 0.05 for both) compared to the values observed in the D group. M, EA, and EA + M showed no effect on serum creatinine levels compared to the D group values (Table 2).
4.3 Effect of EA, EN, EA + M, and EN + M on rats’ kidney histopathology (H & E-stained sections)
The C group kidney sections showed normal renal corpuscle and its glomeruli. Adjacent kidney tubules showed narrow lumen and intact cuboidal lining epithelium. The kidney sections of the D group exhibited noticeable disorganization of renal corpuscles, characterized by atrophy of glomerular capillaries. Additionally, the renal tubules displayed degenerated epithelium with low levels of apoptosis, along with significant tubular dilatation accompanied by luminal casts. The M group kidney sections showed marked amelioration of diabetic changes in renal corpuscles and tubules however, some tubules still showed dilated lumen and atrophied low epithelium. The E group kidney sections showed potential preservation of histological structure of renal corpuscle and glomeruli. Some tubules still show dilated lumen and low epithelial lining. The EN, EA + M, and EN + M groups’ kidney sections showed more preservation of normal structure of both renal corpuscle’s glomeruli and renal tubules (Fig. 1).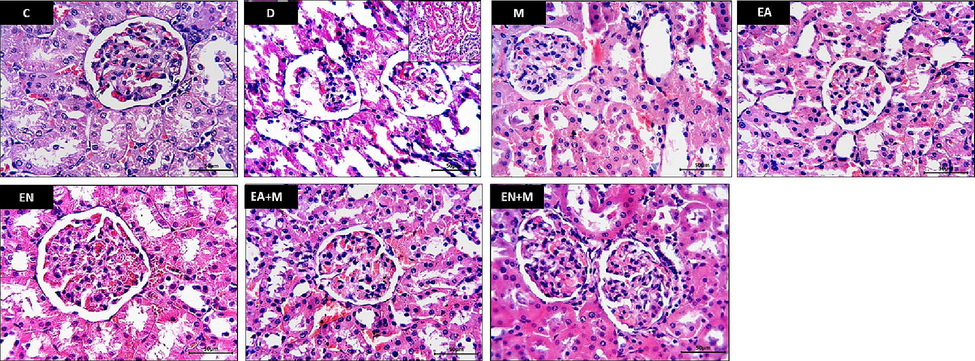
Effect of EA, EN, EA + M, and EN + M on rats’ kidney histopathology determined in all experimental groups. Photos presented H & E-stained sections photographed at x400 magnification (Bar = 50 µm). C: control group, D: diabetes group, M: metformin group, EA: ellagic acid group, EN: nano-formulated ellagic acid group, EA + M: ellagic acid + metformin group, and EN + M: nano-formulated ellagic acid + metformin group.
4.4 Effect of EA, EN, EA + M, and EN + M on rats’ kidney glomerular matrix (Masson’s trichrome stained sections)
The D group kidney sections showed an increase in blue stained mesangial substance among damaged glomerular capillaries compared to normal appearance in the C group sections. Mild or no change in the amount of blue stained interglomerular substance was observed in the sections of the M and EA groups in comparison to the D group sections. Restoration of normal appearance of staining feature of interglomerular mesangial substance was observed in the EN, EA + M, and EN + M groups’ kidney sections with marked preservation of normal appearance in the EN, EN + M groups’ kidney sections (Fig. 2).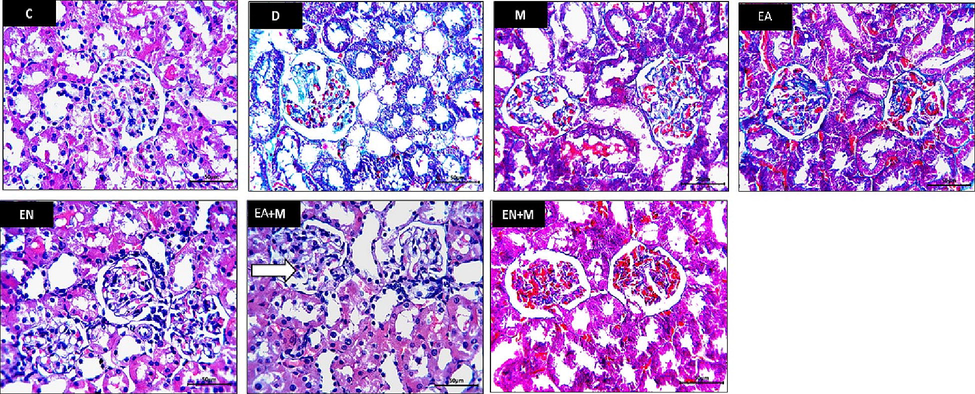
The impact of EA, EN, EA + M, and EN + M on kidney collagen formation was evaluated in all experimental groups. Photos presented Masson’s trichrome stained sections photographed at x400 magnification (Bar = 50 µm). C: control group, D: diabetes group, M: metformin group, EA: ellagic acid group, EN: nano-formulated ellagic acid group, EA + M: ellagic acid + metformin group, and EN + M: nano-formulated ellagic acid + metformin group.
4.5 Effect of EA, EN, EA + M, and EN + M on rats’ kidney LPO and TAC levels
The findings depicted in Fig. 3 demonstrate a significant increase in kidney LPO (p < 0.001) and a noteworthy decrease in kidney TAC levels (p < 0.001) eight weeks after inducing type II diabetes in the rats, in comparison to the values observed in the control group. Regarding kidney LPO levels, treatment with M, EN, and EN + M led to significant reductions (p < 0.05, p < 0.05, and p < 0.01, respectively) in kidney LPO compared to the D group values. However, neither EA alone nor in combination with M showed any effect on kidney LPO levels compared to the D group values. Notably, there were no significant differences observed in the ability of M, EN, and EN + M to lower LPO levels.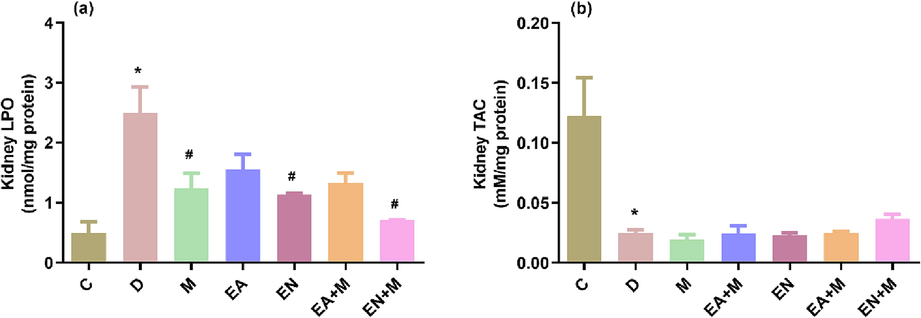
The effects of EA, EN, EA + M, and EN + M on rats’ kidney lipid peroxidation product (LPO) and total antioxidants capacity (TAC) levels determined in all experimental groups. Data are presented as mean ± standard error. C: control group, D: diabetes group, M: metformin group, EA: ellagic acid group, EN: nano-formulated ellagic acid group, EA + M: ellagic acid + metformin group, and EN + M: nanoformulated ellagic acid + metformin group. *Significant against C and #significant against D (p ≤ 0.05).
Concerning the kidney TAC levels, treatment of rats with EA, EN, EA + M, and EN + M showed no effect on kidney TAC levels in comparison to the D group values (Fig. 3).
4.6 Effect of EA, EN, EA + M, and EN + M on rats’ serum CRP levels
The results presented in Fig. 4 showed that induction of type II diabetes significantly increased the rats’ serum CRP level (p < 0.001) 8 weeks after diabetes induction compared to the control group.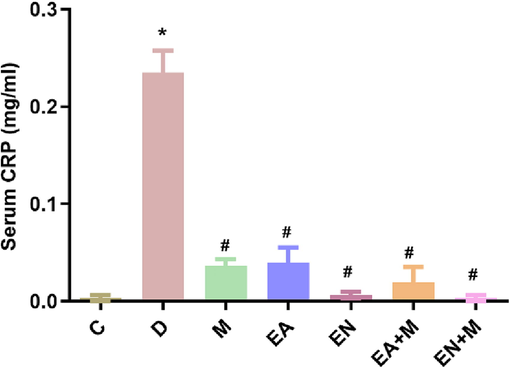
The effect of EA, EN, EA + M, and EN + M on rats’ serum C reactive protein (CRP) levels determined in all experimental groups. Data are presented as mean ± standard error. C: control group, D: diabetes group, M: metformin group, EA: ellagic acid group, EN: nanoformulated ellagic acid group, EA + M: ellagic acid + metformin group, and EN + M: nanoformulated ellagic acid + metformin group. *Significant against C and #significant against D (p ≤ 0.05).
Treatment of rats with M, EA, EN, EA + M, and EN + M significantly decreased the serum CRP (p < 0.001 all) in comparison with the D group values. No differences were found between the CRP lowering action of M, EA, EN, EA + M, and EN + M (Fig. 4).
4.7 Effect of EA, EN, EA + M, and EN + M on rats’ kidney caspase-3 expression
In the kidney sections of the C group, minimal or no immune-expression of caspase-3 was observed in both renal corpuscles and tubules. Conversely, the kidney sections of the D group exhibited a significant caspase-3 immune-expression in the damaged tubules, along with mild caspase-3 immune-expression in glomerular capillaries. Notably, the kidney sections of the EA, EN, EA + M, and EN + M groups displayed notable reductions in caspase-3 immune-expression in the renal corpuscles and tubules, as depicted in Fig. 5.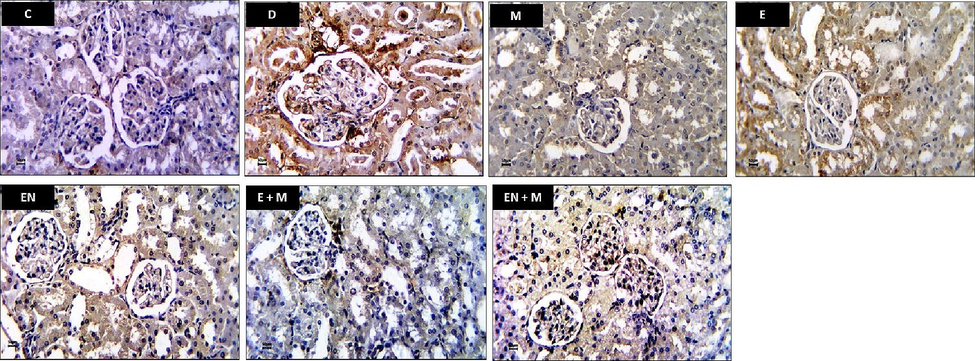
Effect of EA, EN, EA + M, and EN + M on rats’ kidney caspase-3 expression determined in all experimental groups. Photos presented caspase-3 immunostained sections photographed at x400 magnification (Bar = 50 µm). C: control group, D: diabetes group, M: metformin group, EA: ellagic acid group, EN: nanoformulated ellagic acid group, EA + M: ellagic acid + metformin group, and EN + M: nanoformulated ellagic acid + metformin group.
5 Discussion
Diabetic nephropathy represents a significant complication arising from both type I and type II diabetes, and it stands as the primary cause of renal disease on a global scale. (Xue, 2017. 2017.). The combination of a high-fat diet and STZ-induced type II diabetes in rats was found to be associated with impaired kidney function. The renal effects were clearly manifested through notable elevations in serum urea and creatinine levels, along with the disruption of renal corpuscles and the occurrence of glomerular capillary atrophy. Low deteriorated epithelium was found in the renal tubules, as well as tubular dilatation and luminal casts. These findings are consistent with prior research that attributed impaired kidney functions (increase in blood urea and creatinine levels) in STZ-induced diabetes to marked glomerular deformity such as fibrosis congestion and tubular necrosis observed in histological evaluation and inter-tubular bleeding (Ahmed, 2019). LPO induced by oxidative stress was well known to be linked to renal damage in diabetic status. Increased oxidative stress and weakened antioxidant defense systems can predispose to kidney damage induced by diabetes. In the current investigation, it was observed that the level of LPO (lipid peroxidation) in the kidneys of diabetic rats exhibited a significant increase, whereas the level of TAC (total antioxidant capacity) demonstrated a significant reduction, thus corroborating previous findings. Consistent with these results, De Brito Amaral et al. also reported a notable rise in LPO levels in the kidneys of rats with STZ-induced diabetic nephropathy when compared to normal control rats (Amaral, 2018.). Additionally, Ziamajidi et al. confirmed that the administration of nicotinamide/STZ led to an elevation in LPO levels and an excess of total oxidative stress markers in diabetic rats (Ziamajidi, 2017). Prolonged elevation of blood glucose levels can result in an escalation of oxygen free radicals, which play a role in the development of various diabetic complications, including nephropathy (Ahmed, 2019). The cell’s antioxidant defenses are depleted by increased free oxygen radicals, making the cell vulnerable to oxidative damage. Oxygen-free radicals also attack and oxidize lipids, DNA, and proteins, causing changes in cell structure and function and causing necrosis and mutations in genes that causes apoptosis (Poljsak et al., 2013; Nita and Grzybowski, 2016; Sharifi-Rad, 2020; Juan, 2021; Reetu, 2022).
Furthermore, inflammatory processes and cellular apoptosis can contribute to the progression of histological and functional changes in the renal parenchyma, ultimately resulting in renal dysfunction and deterioration in the histological structure in individuals with diabetes (Ahmed, 2019). Consistent with previous findings, diabetic rats in this study exhibited a notable increase in the expression of caspase-3, a validated marker of apoptosis, as confirmed by immunohistochemical analysis. Additionally, there was a significant elevation in the serum inflammation marker CRP, along with evident deposition of mesangial matrix in the kidney glomeruli, as observed through Masson's trichrome staining. These observations align with the results reported by Sha et al. (2017) and Ahmed et al. (2019), who similarly identified augmented immunostaining of apoptotic mediators p53 and caspase-3 in the kidneys of STZ-induced diabetic rats, employing immunohistochemical techniques (Ahmed, 2019). The findings of this study are consistent with the results reported by Sha et al. (2017), indicating that apoptosis could potentially contribute to the development of STZ-induced nephropathy in rats (Sha, 2017). According to the findings of You et al. (2016), human CRP (C-reactive protein) appears to have a significant involvement in the progression of type II diabetic nephropathy. This was demonstrated by the development of more severe renal complications, such as elevated blood glucose levels, microalbuminuria, and notable kidney inflammation and fibrosis, in CRPtg-db/db mice (You, 2016). CRP is increased by hyperglycemia in diabetic situations. It synergistically increases hyperglycemia-mediated renal inflammatory processes linked to fibrosis in mouse models of in vitro and SZ-induced diabetes type I (Liu, 2011).
The present study demonstrated that the administration of EN (nanoformulated E) and/or M (metformin) to diabetic rats yielded notable improvements in renal function. This was evidenced by a significant decrease in serum creatinine and urea levels, along with a visible enhancement in kidney histological characteristics. Furthermore, the EN treatment was linked to significant improvements in glycemic control, renal LPO (lipid peroxidation), caspase 3 levels, and serum CRP (C-reactive protein), ultimately leading to significant enhancements in renal function, as well as improvements in the histological structure and integrity, when compared to both the EA (ethyl acetate) group and the M group. Regular forms EA and/or M enhanced renal function, histological structure, and integrity, as well as lowering serum urea and CRP and caspase-3 expression. According to our findings, nanoformulations EA have antihyperglycemic, creatinine-lowering, and antioxidant properties, but normal forms EA have none. In a study by Zhou et al. (2019) involving STZ-induced nephropathy in rats, it was observed that only the highest dosage of EA (150 mg/kg) significantly decreased serum creatinine levels, while it did not have any impact on serum blood urea nitrogen. Similarly, the researchers found that EA at doses of 50, 100, and 150 mg/kg had no effect on kidney malondialdehyde levels, which serve as a marker for lipid peroxidation (Zhou, 2019). According to Zhou et al., regular forms EA showed a dose-dependent (50, 100, 1nd 150 mg/kg) lowering effect of blood glucose levels after 8 weeks of diabetes establishment (Zhou, 2019). Fasting plasma glucose was improved by EA (30 mg/kg) after 3 weeks, which is comparable to M or a moderate dose of pioglitazone. Previous studies have indicated that the simultaneous administration of EA (10 mg/kg) and pioglitazone (10 mg/kg) exhibited a synergistic effect (Nankar and Doble, 2017). Furthermore, other studies have demonstrated that an eight-week treatment with EA (50 mg/kg) resulted in a comparable reduction in fasting plasma glucose levels to that achieved by subcutaneous neutral protamine hawthorn (NPH) insulin administration at a dosage of 6 UI/day (Farbood, 2019). This might explain why 10 mg/kg EA, nearly a low dose used in this study, had no antidiabetic effect when used alone or combined with M.
E (180 mg/day) was recently found to lower CRP, malondialdehyde, enhance TAC, and improve glycemic indices in type II diabetes individuals (Ghadimi, 2021). EA (100 mg/kg) prevented STZ-induced diabetic nephropathy, hyperglycemia, oxidative stress, inflammation and apoptosis (cleaved caspase-3) (ALTamimi et al., 2021). This study revealed that EA’s regular and nanoformulations protected against kidney damage associated with STZ-diabetes. However, the regular formula had no hypoglycemic effect, indicating the existence of another mechanism for this protective effect on the kidneys. The renal protective effect of EA is independent of its hypoglycemic effect (ALTamimi et al., 2021). In our opinion, the protective effect of EA regular and nanoformulations is due to its anti-inflammatory effect, inhibiting oxygen free radicals, and preventing programmed cell death. Compared with the previously reported doses of EA as an antihyperglycemic, which prevented renal deterioration in humans and animals, the nano EA-dose used in this study is sufficient despite its smallness, which is one-third of the lowest dose previously used for the regular EA.
6 Conclusion
The results of this study demonstrated that the EN (nanoformulated E) exhibited a beneficial effect in mitigating kidney damage associated with type II diabetes. Notably, even at a lower dose than the standard EA doses, the EN demonstrated a significant impact, underscoring the enhanced anti-diabetic effectiveness of the nanoformulated E. This protective effect on the kidneys can be attributed to its hypoglycemic properties as well as its modulation of antioxidant, anti-inflammatory, and anti-apoptotic pathways.
6.1 Animal protocol approval
The current study's protocol adhered to the guidelines established by the animal care facility at KAU, in compliance with all regulations outlined by “The National Committee of Bio and Medical Ethics- King Abdulaziz City for Science and Technology.”
Acknowledgment
The Deanship of Scientific Research (DSR) at King Abdulaziz University in Jeddah provided funding for this project under grant number G: 740-141-1441. The authors express their gratitude to the DSR for their technical and financial assistance.
Declaration of Competing Interest
The authors declare that they have no known competing financial interests or personal relationships that could have appeared to influence the work reported in this paper.
References
- Effects of enalapril and paricalcitol treatment on diabetic nephropathy and renal expressions of TNF-α, p53, caspase-3 and Bcl-2 in STZ-induced diabetic rats. PLoS One. 2019;14(9):e0214349.
- [Google Scholar]
- Ellagic acid protects against diabetic nephropathy in rats by regulating the transcription and activity of Nrf2. J. Funct. Foods. 2021;79:104397
- [Google Scholar]
- Previous exercise training reduces markers of renal oxidative stress and inflammation in streptozotocin-induced diabetic female rats. Journal of diabetes research. 2018;2018
- [Google Scholar]
- Strategies to improve ellagic acid bioavailability: from natural or semisynthetic derivatives to nanotechnological approaches based on innovative carriers. Nanotechnology. 2020;31(38):382001
- [Google Scholar]
- Microvasular and macrovascular complications in diabetes mellitus: distinct or continuum? Indian journal of endocrinology and metabolism. 2016;20(4):546.
- [Google Scholar]
- Structured DAG oil ameliorates renal injury in streptozotocin-induced diabetic rats through inhibition of NF-κB and activation of Nrf2 pathway. Food Chem. Toxicol.. 2017;100:225-238.
- [Google Scholar]
- Traditional plant treatments for diabetes mellitus: pharmaceutical foods. Br. J. Nutr.. 1998;80(1):5-6.
- [Google Scholar]
- Nanoparticles Ellagic Acid Protects Against Cisplatin-induced Hepatotoxicity in Rats Without Inhibiting its Cytotoxic Activity. Int. J. Pharmacol.. 2019;15(4):465-477.
- [Google Scholar]
- Ellagic acid protects against diabetes-associated behavioral deficits in rats: Possible involved mechanisms. Life Sci.. 2019;225:8-19.
- [Google Scholar]
- Microvascular complications of type 2 diabetes mellitus. Curr. Vasc. Pharmacol.. 2020;18(2):117-124.
- [Google Scholar]
- Diabetes and end-stage renal disease; a review article on new concepts. J. Renal Inj. Prev.. 2015;4(2):28.
- [Google Scholar]
- Randomized double-blind clinical trial examining the Ellagic acid effects on glycemic status, insulin resistance, antioxidant, and inflammatory factors in patients with type 2 diabetes. Phytother. Res.. 2021;35(2):1023-1032.
- [Google Scholar]
- Diabetic kidney disease: world wide difference of prevalence and risk factors. Journal of nephropharmacology. 2016;5(1):49.
- [Google Scholar]
- Stability of a type 2 diabetes rat model induced by high-fat diet feeding with low-dose streptozotocin injection. Journal of Zhejiang University-Science B. 2018;19(7):559-569.
- [Google Scholar]
- Antidiabetic effects of novel ellagic acid nanoformulation: Insulin-secreting and anti-apoptosis effects. Saudi Journal of Biological Sciences. 2020;27(12):3474-3480.
- [Google Scholar]
- The chemistry of reactive oxygen species (ROS) revisited: outlining their role in biological macromolecules (DNA, lipids and proteins) and induced pathologies. Int. J. Mol. Sci.. 2021;22(9):4642.
- [Google Scholar]
- Diabetic nephropathy–complications and treatment. Int. J. Nephrol. Renov. Dis.. 2014;7:361.
- [Google Scholar]
- C-reactive protein promotes diabetic kidney disease in a mouse model of type 1 diabetes. Diabetologia. 2011;54(10):2713-2723.
- [Google Scholar]
- Hybrid drug combination: Anti-diabetic treatment of type 2 diabetic Wistar rats with combination of ellagic acid and pioglitazone. Phytomedicine. 2017;37:4-9.
- [Google Scholar]
- The role of the reactive oxygen species and oxidative stress in the pathomechanism of the age-related ocular diseases and other pathologies of the anterior and posterior eye segments in adults. Oxid. Med. Cell. Longev.. 2016;2016
- [Google Scholar]
- Advanced glycation end products and oxidative stress in type 2 diabetes mellitus. Biomolecules. 2015;5(1):194-222.
- [Google Scholar]
- Serum amyloid A and C-reactive protein levels may predict microalbuminuria and macroalbuminuria in newly diagnosed type 1 diabetic patients. J. Diabetes Complications. 2013;27(1):59-63.
- [Google Scholar]
- Predictors of chronic kidney disease in type 1 diabetes: a longitudinal study from the AMD Annals initiative. Sci. Rep.. 2017;7(1):1-9.
- [Google Scholar]
- Ellagic acid alleviates hepatic oxidative stress and insulin resistance in diabetic female rats. Nutrients. 2018;10(5):531.
- [Google Scholar]
- Achieving the balance between ROS and antioxidants: when to use the synthetic antioxidants. Oxid. Med. Cell. Longev.. 2013;2013
- [Google Scholar]
- In vitro antioxidant and antiproliferative effects of ellagic acid and its colonic metabolite, urolithins, on human bladder cancer T24 cells. Food Chem. Toxicol.. 2013;59:428-437.
- [Google Scholar]
- In-silico studies for targeting PPARγ for the Type II Diabetes Mellitus. Mater. Today:. Proc.. 2022;57:44-48.
- [Google Scholar]
- In vivo administration of urolithin A and B prevents the occurrence of cardiac dysfunction in streptozotocin-induced diabetic rats. Cardiovasc. Diabetol.. 2017;16(1):1-13.
- [Google Scholar]
- An updated overview of diabetic nephropathy: Diagnosis, prognosis, treatment goals and latest guidelines. Diabetes Obes. Metab.. 2020;22:3-15.
- [Google Scholar]
- Alteration of oxidative stress and inflammatory cytokines induces apoptosis in diabetic nephropathy. Mol. Med. Rep.. 2017;16(5):7715-7723.
- [Google Scholar]
- Lifestyle, oxidative stress, and antioxidants: Back and forth in the pathophysiology of chronic diseases. Front. Physiol.. 2020;11:694.
- [Google Scholar]
- Immunoperoxidase staining of formalin-fixed, paraffin-embedded, human renal biopsies with a comparison of the peroxidase-antiperoxidase (PAP) and indirect methods. J. Clin. Pathol.. 1981;34(8):859-865.
- [Google Scholar]
- Varied biologic functions of c-reactive protein. Immunol. Res.. 2002;26(1):279-287.
- [Google Scholar]
- Ethical principles and standards for the conduct of human and animal biological rhythm research. Chronobiol. Int.. 2004;21(1):161-170.
- [Google Scholar]
- Positive association between high-sensitivity C-reactive protein and incidence of type 2 diabetes mellitus in Japanese workers: 6-year follow-up. Diabetes Metab. Res. Rev.. 2013;29(5):398-405.
- [Google Scholar]
- Caspase-3 promotes diabetic kidney disease through gasdermin E-mediated progression to secondary necrosis during apoptosis. Diabetes, metabolic syndrome and obesity: targets and therapy. 2020;13:313.
- [Google Scholar]
- Mechanistic insight and management of diabetic nephropathy: recent progress and future perspective. Journal of diabetes research 2017. 2017.
- [Google Scholar]
- C-reactive protein promotes diabetic kidney disease in db/db mice via the CD32b-Smad3-mTOR signaling pathway. Sci. Rep.. 2016;6(1):1-14.
- [Google Scholar]
- Dietary natural products for prevention and treatment of liver cancer. Nutrients. 2016;8(3):156.
- [Google Scholar]
- Ellagic acid attenuates streptozocin induced diabetic nephropathy via the regulation of oxidative stress and inflammatory signaling. Food Chem. Toxicol.. 2019;123:16-27.
- [Google Scholar]
- Effects of garlic extract on TNF-α expression and oxidative stress status in the kidneys of rats with STZ+ nicotinamide-induced diabetes. Pharm. Biol.. 2017;55(1):526-531.
- [Google Scholar]


