Translate this page into:
Microtremor measurements in Yanbu city of Western Saudi Arabia: A tool for seismic microzonation
*Corresponding author m_fnais@yahoo.com (M.S. Fnais) mfnais@ksu.edu.sa (M.S. Fnais)
-
Received: ,
Accepted: ,
This article was originally published by Elsevier and was migrated to Scientific Scholar after the change of Publisher.
Abstract
Microtremor measurements are one of the most popular world-wide tool for estimation of site response especially within the urban area. This technique has been applied over 85 sites distributed regularly through Yanbu metropolitan area with an ultimate aim of seismic hazard microzonation for ground-shaking site effects. The horizontal to vertical spectral analysis (H/V) was carried out over all the sites to estimate both the fundamental resonance frequency and its corresponding amplification for the ground vibration. In most sites, H/V curve for amplitude spectra display a clear peak suggesting the presence of a soil-bedrock impedance contrast. Other sites, however, show more than one peak indicating the presence of more than one impedance contrast through sedimentary cover. The estimated values of fundamental frequency range from 0.25 Hz up to 7.9 Hz increases with decreasing depths of basement rock. It has lower values at the central zone extending from north to south compared to the eastern and western parts of Yanbu area. On the other hand, the estimated values of amplification factor ranges from the value of 2 to 5, where the higher values prevailing through the central zone with increasing thickness of sediments. Analyses of the acquired data set have clearly shown that, both of two parameters vary considerably through Yanbu city. This could be due to lateral variations in soil thickness and/or variations in the soil type at Yanbu area. These results show the 2D and 3D effect of basin geometry. The estimated values for the fundamental frequency from microtremor data are compared with that from shear-wave velocity structure within the area of interest and show an excellent agreement.
Keywords
Microtremor
Yanbu city
Earthquakes
Microzonation
1 Introduction
Yanbu city represents one of marine ports of western Saudi Arabia where it is located along the Red Sea eastern coast. It belongs to Al-Madinah province about 350 km north of Jeddah city (Fig. 1).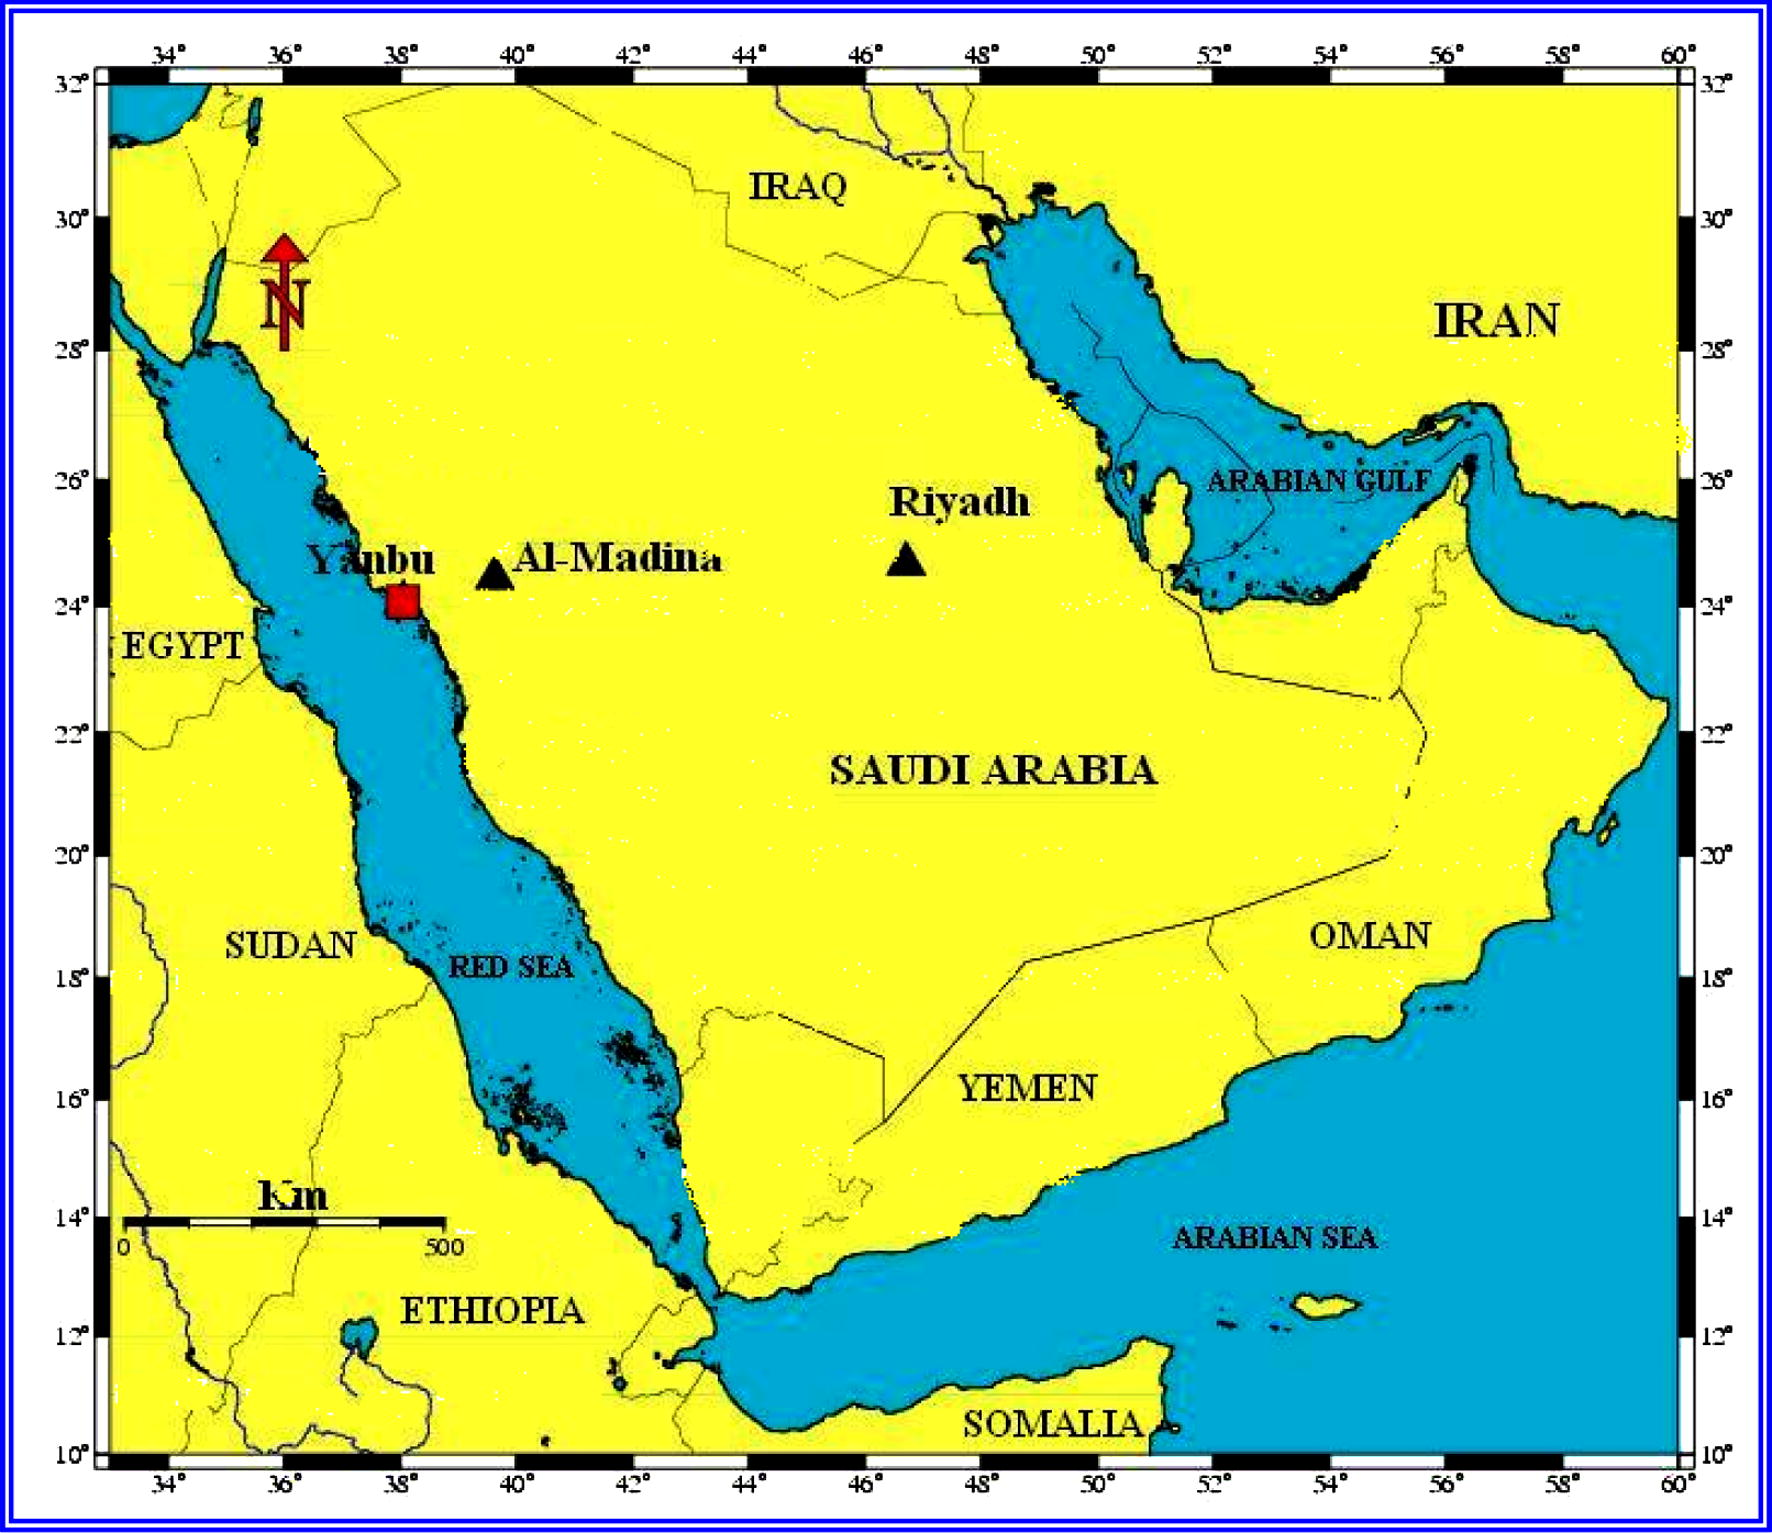
Location map for Yanbu city.
The central part of the city refers to the old town, while modern Yanbu is a short distance away. In 1975, the Saudi government selected both Yanbu and Al-Jubail, both small towns on the Persian Gulf coast, to be developed as modern industrial cities and established the Royal Commission for Jubail and Yanbu. The town is expanding as an industrial and commercial center with three large oil refineries, a petrochemical complex, and a large desalination plant that plays an important role in diversifying Saudi Arabia's economic base.
The behavior of the ground motion during an earthquake is generally well explained by the geological surface structure in the place where the phenomenon is studied. Past and recent observations have shown that the damage caused by strong earthquakes is more important in sedimentary basins than on hard rock structures. Unfortunately, Yanbu city lies within the Red Sea's active tectonic environment and is affected by the present-day geodynamic processes acting in the Red Sea region. The resulting structures either normal or transform faults run parallel to and/or across the Red Sea. Some of these faults extend inland over tens or hundreds of kilometers (Al-Shanti, 1966; Pallister, 1984). The relative movements along such faults can cause large and damaging earthquakes. Historical information (Poirier and Taher, 1980; Ambraseys and Milville, 1983; Ambraseys et al., 1994) in association with the recent studies (Merghelani, 1981; El-Isa and Al-Shanti, 1989; Al-Amri, 1995) around Yanbu have revealed its significant level of earthquake activity which should be taken into account for the strategic plans in the future. Recently, the city was affected by the occurrence of the moderate earthquake at Harat Lunayyir (Mw 5.7) earthquake swarm on May 19, 2009 (Al-Amri and Fnais, 2009). Earthquake ground-shaking intensity has been participated at Yanbu city (MMI = 5) in spite of 130 km distance from the earthquake location.
It is well known that, local site effects play an important role in the damage occurring during a destructive earthquake (Singh et al., 1988; Graves, 1993; Bakir et al., 2002; Sørensen et al., 2006). The lateral variation in the site effects are mainly due to the local site conditions such as type and nature of sediments, water saturation, basin geometry, and thickness of sediments. In addition, it is realized that the presence of sharp lithological boundaries between the bedrocks and the overlying sediments cause strong impedance contrasts that affect the local site responses. Different approaches have been carried out to evaluate the local site response (Nakamura, 1989; Lermo and Chavez-Garcia, 1993; Field and Jacob, 1995). In this study, the evaluation of the local site effects for Yanbu metropolitan city was conducted according to the most popular and world-wide approach through the calculation of the horizontal to vertical spectral ratio (HVSR) for the recorded ambient vibrations. These spectral ratios show the fundamental frequency and the associated amplification factor. As proved through the intensive investigations, thick sedimentary cover usually generates amplitude spectra with peaks at low frequencies (<3 Hz) while thin sediments generate peaks at high frequencies (>10 Hz). The broad spectrum with constant amplitude is usually associated with the crystalline outcrops (Nakamura, 1989, 2000; Bard, 1994; Bard et al., 2004). Then, the estimated fundamental frequencies and the corresponding amplifications are compared with the surface geology.
2 Geological and tectonic setting
The available geological information for Yanbu city and the surrounding area comes from the geologic map of Yanbu (Fig. 2) with scale 1:250,000 (Pellaton, 1979). Most of the area is occupied by outcrops of tertiary–quaternary marine and continental coastal plain sediments. Marine quaternary deposits are represented mainly by reef terraces which lie several meters above sea level. Sand and mud in the lower zones are intermixed with contemporaneous alluvial material. While continental quaternary deposits are represented by: (1) sandy mantle covering a wide area which has a composite origin incorporating fluviatile and Aeolian transport; (2) gravely or sandy spreads dissected by very close drainage; and (3) gravely spreads related to the degradation of the older terraces.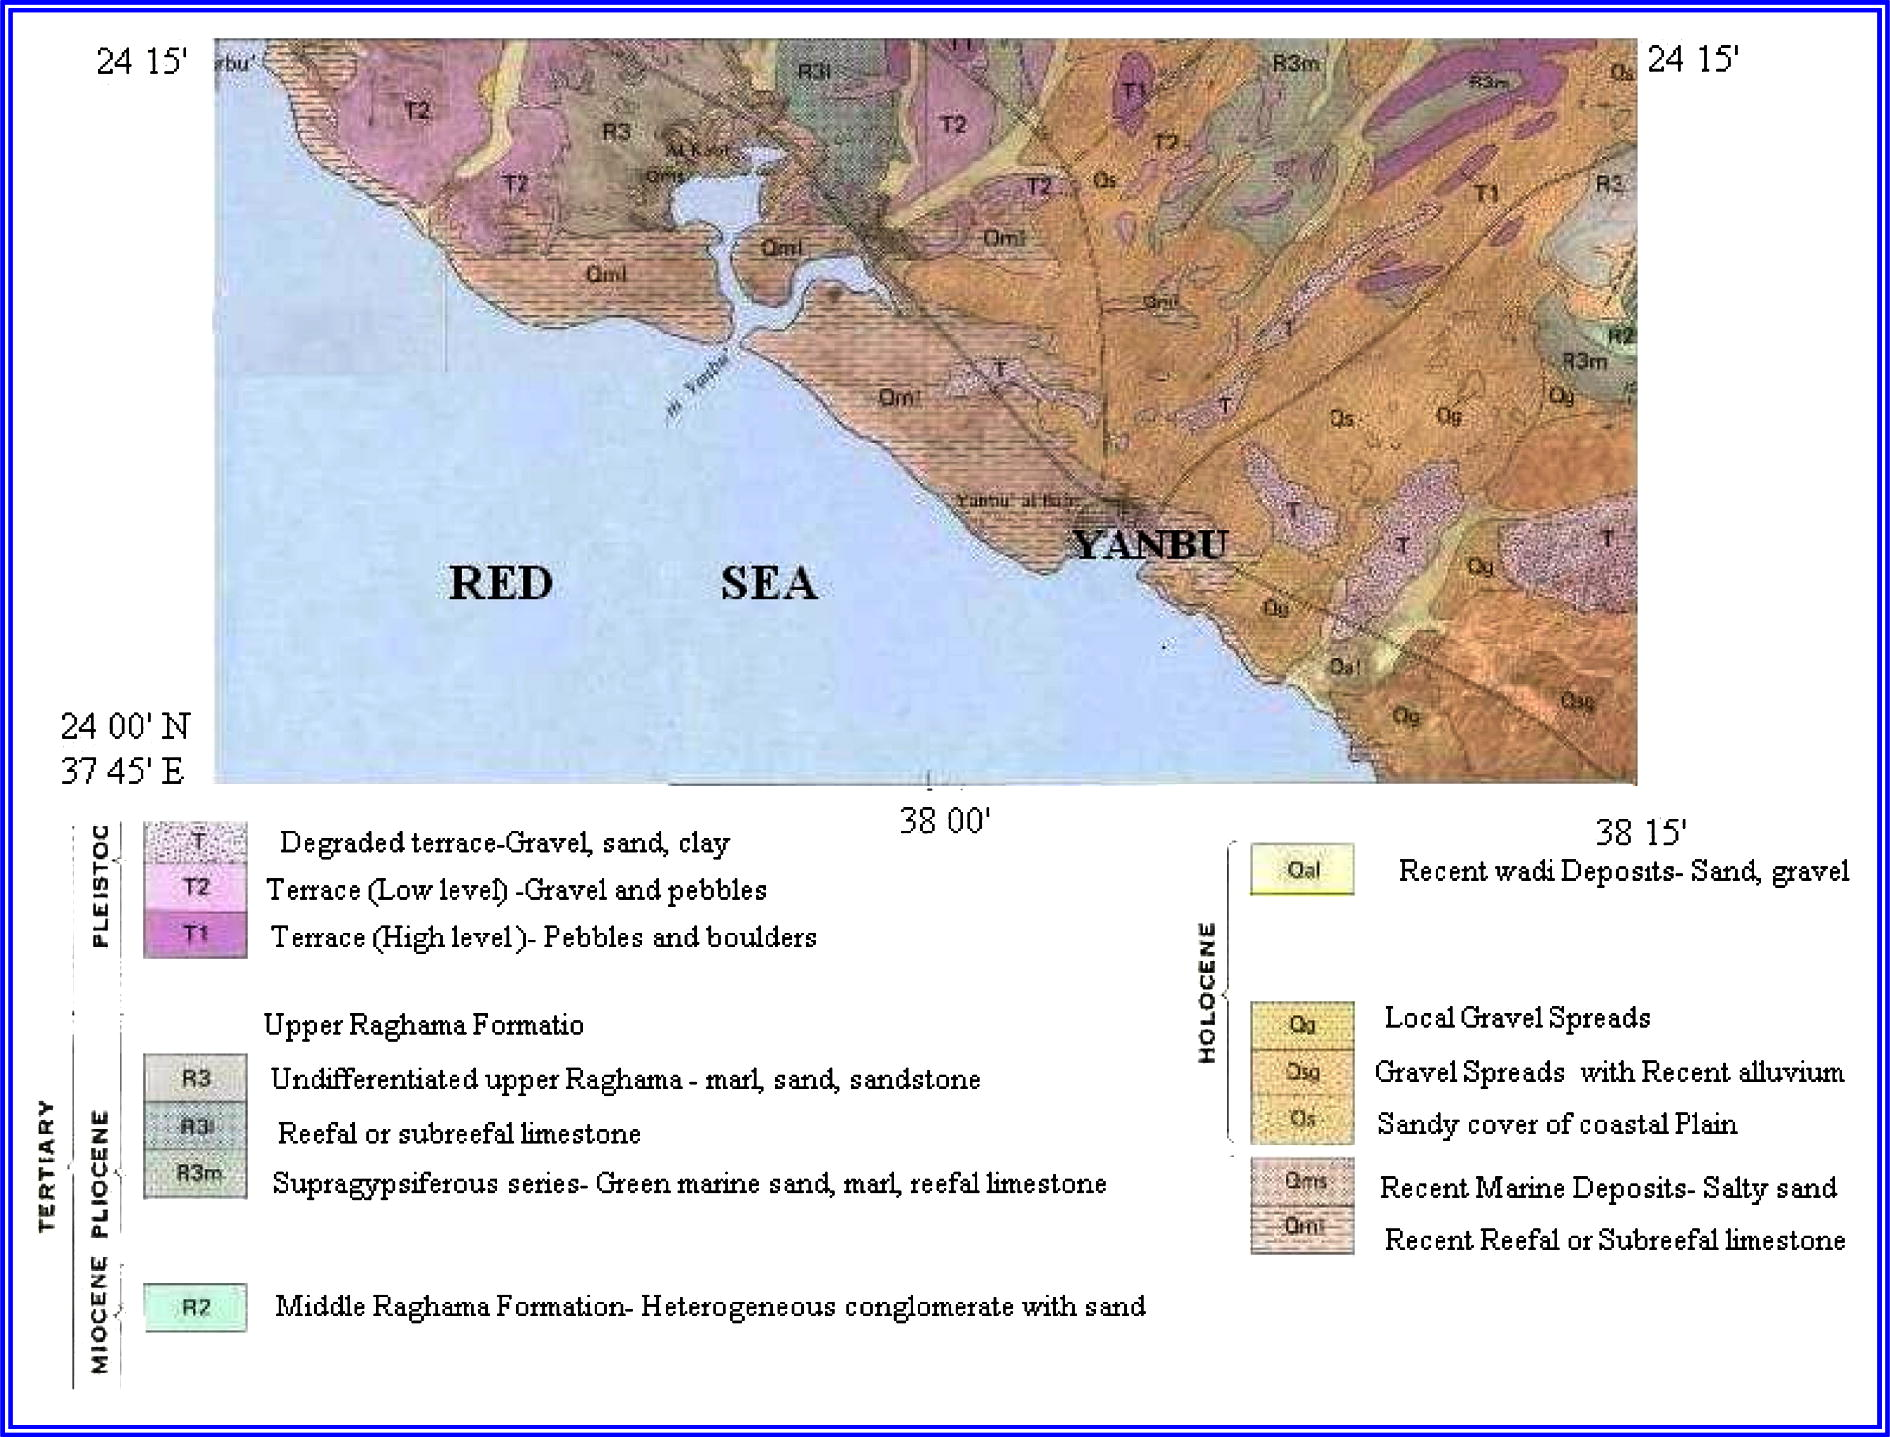
Geologic map for Yanbu area.
The distribution of tertiary sediments was controlled by the syndepositional section across the coastal plain from the Precambrian basement in the east to the coast in the west would be: (1) beds of shale and conglomerate sandstone alternating with siltstone, (2) thin tertiary reefal limestone with the Miocene coral, rising above the coastal plain and alternating with sandstone and silts, (3) shale covered by sand and gravel, and (4) raised reef limestone terraces of quaternary age.
Depending on the lithological variations through 106 boring logs in the city of Yanbu (Al-Haddad et al., 2001), the subsurface soil column at Yanbu city can be classified as an extremely variable complex and is composed of the following profiles:
Extremely loose to loose fine to medium sand deposits from the surface to 15 m depth with a very shallow groundwater table (less than 1 m).
Thin top layer of compact shattered coral (2–5 m with SPT-N values from 20 to 50) underlain by thick layer of very loose to loose fine sand with some gravel and/or silt (6–8 m with SPT-N values between 5 and 25) below the ground level.
A dense to very dense layer of silty sand with gravel and cobbles.
Coral limestone interbedded with coralline sand and fines. It is of medium dense to very dense especially at deeper depths (35 km south of Yanbu).
3 Data acquisition and processing
Seismic noise measurements were acquired at 85 sites during the period from 3rd to 20th August 2009 at the intersected points of two mutually perpendicular sets of profiles covering the metropolitan zone of Yanbu city (Fig. 3 and Table 1).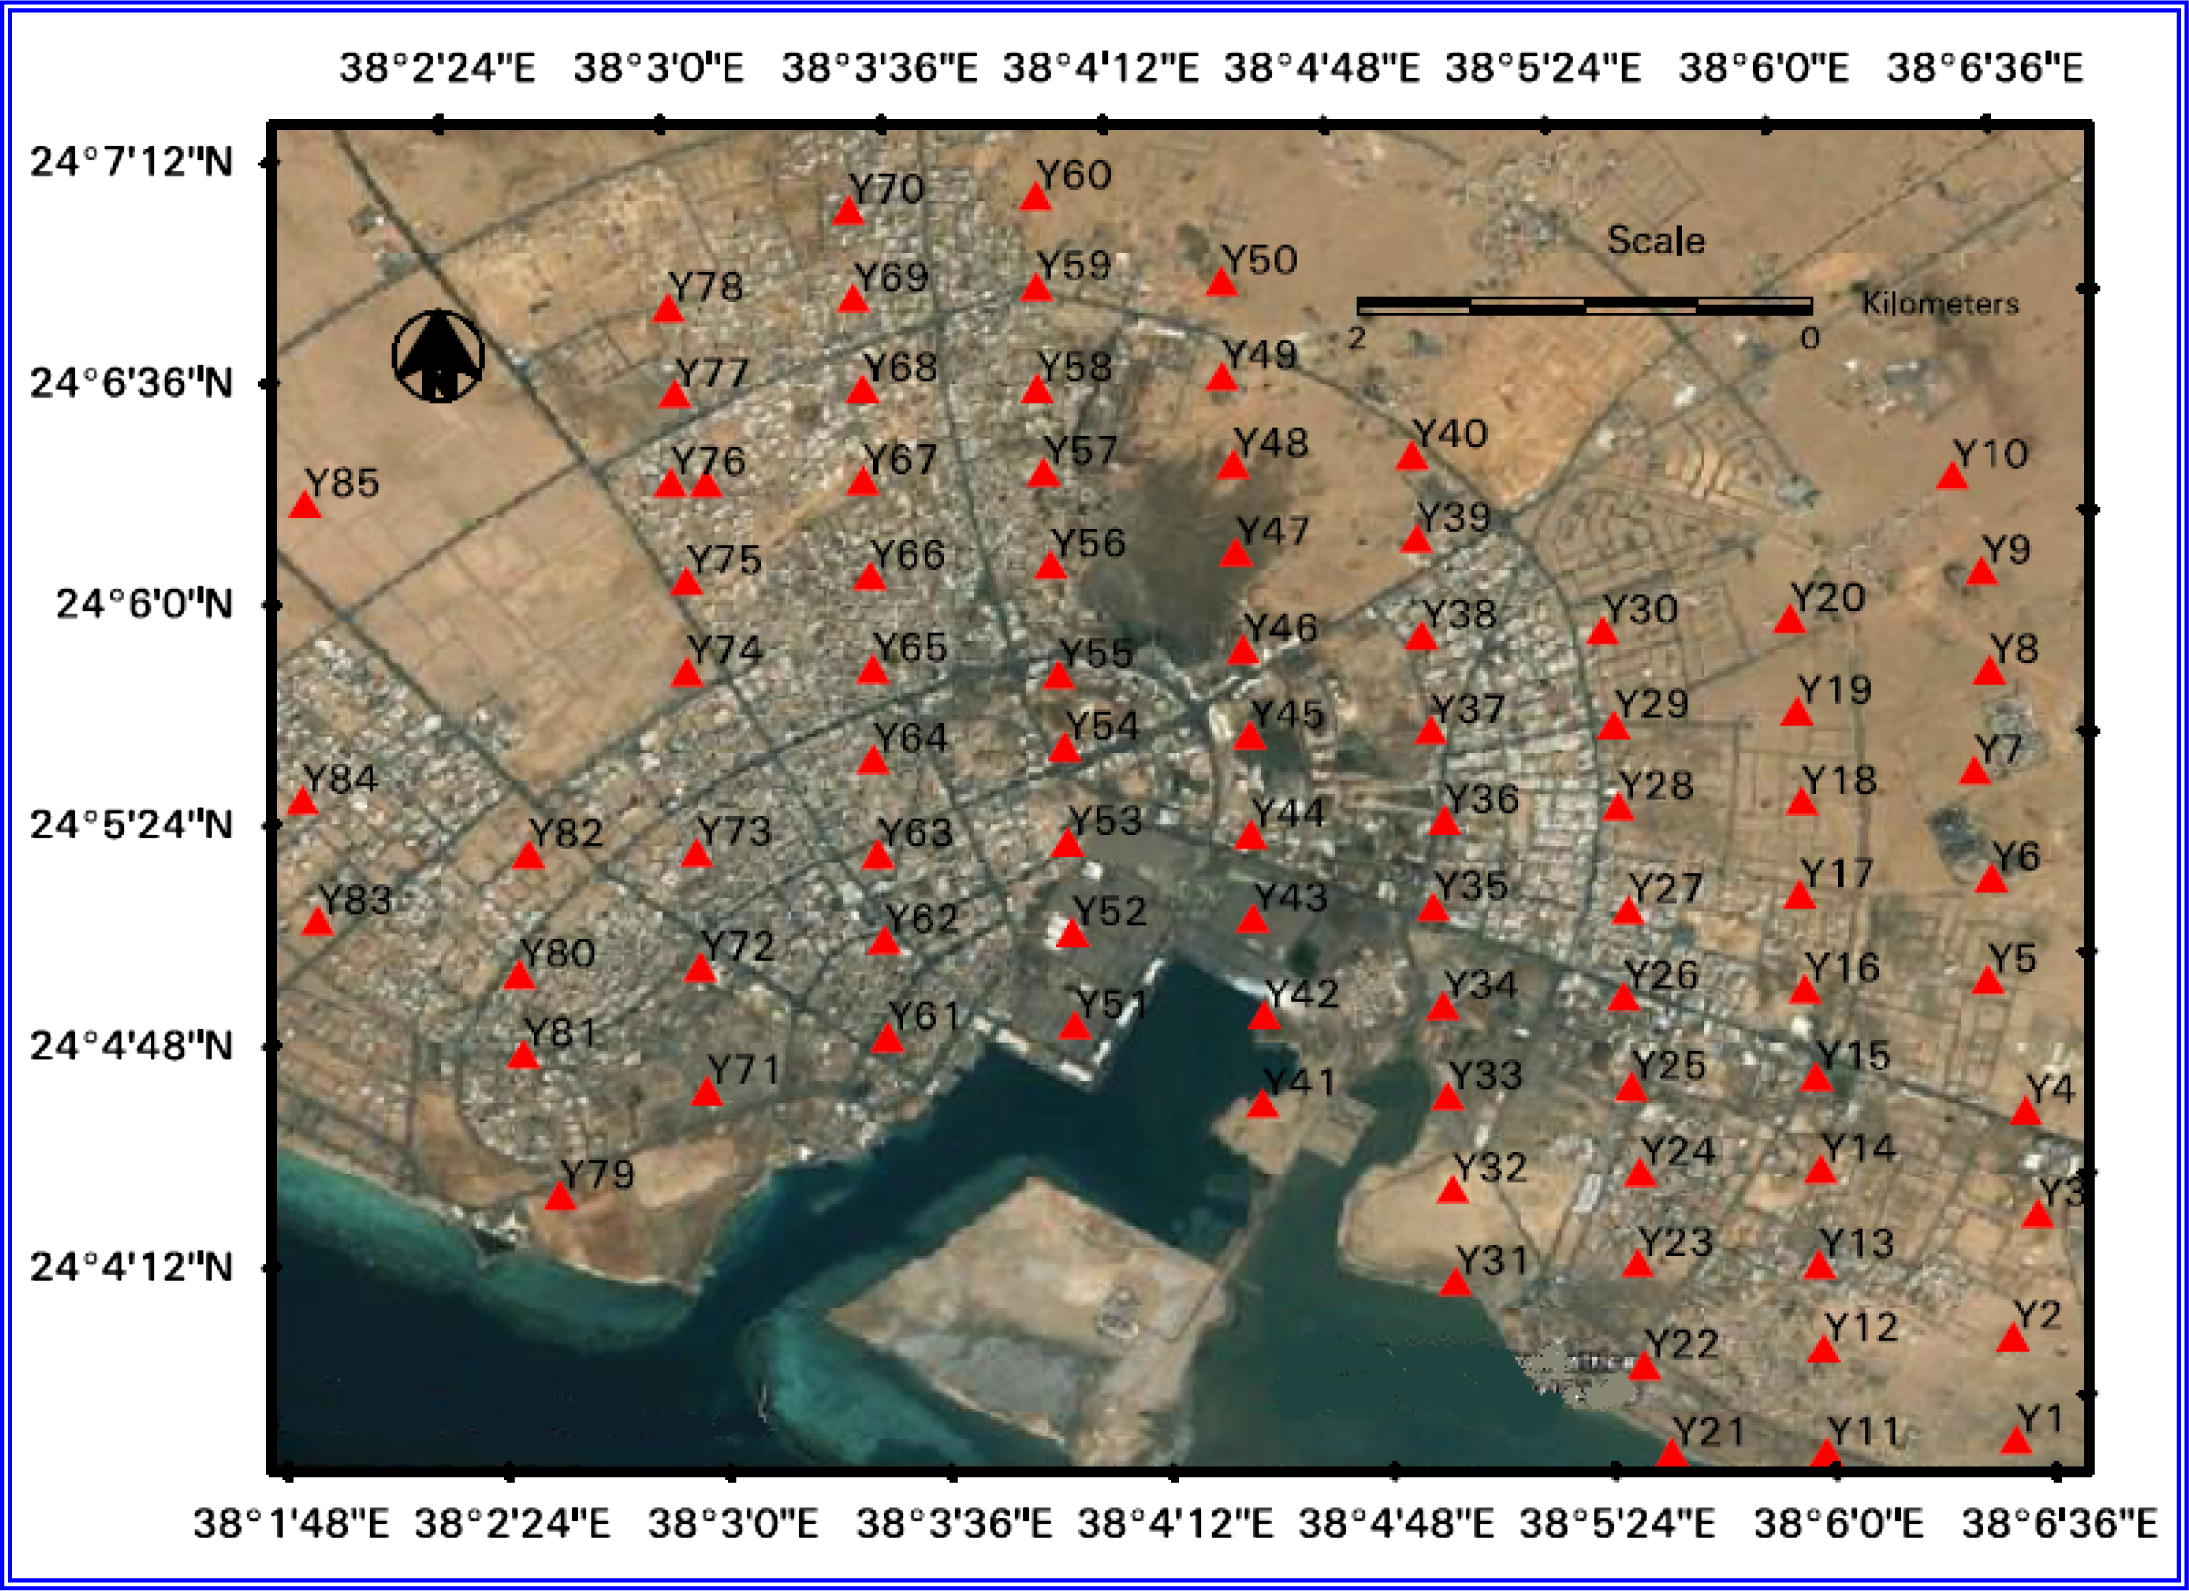
Distribution of microtremor measurements at Yanbu area.
Station code
Date
Latitude (°)
Longitude (°)
Location
Y1
3 August 2009
38.1082
24.0581
Empty Land
Y2
3 August 2009
38.1083
24.0628
Empty Land
Y3
3 August 2009
38.1097
24.0683
Balbeed Company
Y4
3 August 2009
38.1094
24.0730
Empty Land
Y5
3 August 2009
38.1080
24.0790
Empty Land
Y6
4 August 2009
38.1084
24.0836
Holiday Inn Hotel
Y7
4 August 2009
38.1079
24.0885
Empty Land
Y8
4 August 2009
38.1088
24.0930
Empty Land
Y9
4 August 2009
38.1087
24.0975
Empty Land
Y10
4 August 2009
38.1076
24.1019
Empty Land
Y11
5 August 2009
38.0996
24.0580
Jeddah Road
Y12
5 August 2009
38.0997
24.0627
Empty Land
Y13
5 August 2009
38.0997
24.0665
Empty Land
Y14
5 August 2009
38.1000
24.0708
Empty Land
Y15
5 August 2009
38.1000
24.0750
Almajd Club
Y16
6 August 2009
38.0997
24.0790
Empty Land
Y17
6 August 2009
38.0997
24.0833
Empty Land
Y18
6 August 2009
38.1000
24.0875
Empty Land
Y19
6 August 2009
38.1000
24.0916
Empty Land
Y20
6 August 2009
38.0999
24.0958
Empty Land
Y21
7 August 2009
38.09261
24.05833
Empty Land
Y22
7 August 2009
38.09156
24.06236
Empty Land
Y23
7 August 2009
38.09192
24.05
Empty Land
Y24
7 August 2009
38.09183
24.07111
Empty Land
Y25
7 August 2009
38.09164
24.075
Playground
Y26
8 August 2009
38.0915
24.0791
Jeddah Road
Y27
8 August 2009
38.0919
24.083
Empty Land
Y28
8 August 2009
38.0917
24.0877
Empty Land
Y29
8 August 2009
38.0917
24.0914
Empty Land
Y30
8 August 2009
38.0914
24.0957
Empty Land
Y31
9 August 2009
38.0832
24.0666
Radison Sas Hotel
Y32
9 August 2009
38.0833
24.0708
Empty Land
Y33
9 August 2009
38.0833
24.075
Empty Land
Y34
9 August 2009
38.0833
24.0791
Mercury Exhibit
Y35
9 August 2009
38.0831
24.0836
Jeddah Road
Y36
10 August 2009
38.0838
24.0875
Empty Land
Y37
10 August 2009
38.0834
24.0916
Empty Land
Y38
10 August 2009
38.0832
24.0959
Empty Land
Y39
10 August 2009
38.0832
24.1003
Empty Land
Y40
10 August 2009
38.0832
24.1041
Empty Land
Y41
11 August 2009
38.0749
24.0751
Yanbu Port
Y42
11 August 2009
38.0752
24.0791
Yanbu Port
Y43
11 August 2009
38.0749
24.0835
Yanbu Port
Y44
11 August 2009
38.0750
24.0873
Danat Yanbu Hotel
Y45
11 August 2009
38.0752
24.0918
Empty Land
Y46
12 August 2009
38.0751
24.0957
Empty Land
Y47
12 August 2009
38.0750
24.1001
Sabhkat area
Y48
12 August 2009
38.0751
24.1041
Sabkhat area
Y49
12 August 2009
38.0748
24.1081
Empty Land
Y50
12 August 2009
38.0750
24.1124
Empty Land
Y51
13 August 2009
38.0666
24.0791
Yanbu Port
Y52
13 August 2009
38.0667
24.0833
Al-Maktaba
Y53
13 August 2009
38.0667
24.0874
Empty Land
Y54
13 August 2009
38.0668
24.0917
Empty Land
Y55
13 August 2009
38.0667
24.095
Empty Land
Y56
14 August 2009
38.0666
24.1000
Empty Land
Y57
14 August 2009
38.0665
24.1042
Empty Land
Y58
14 August 2009
38.0664
24.1080
Empty Land
Y59
14 August 2009
38.0666
24.1126
Empty Land
Y60
14 August 2009
38.0668
24.1167
Empty Land
Y61
15 August 2009
38.0581
24.0790
Old City
Y62
15 August 2009
38.0582
24.0834
Historical Gate
Y63
15 August 2009
38.0581
24.0873
Schools compound
Y64
15 August 2009
38.0581
24.0916
Playground zone
Y65
15 August 2009
38.0583
24.0957
Empty Land
Y66
16 August 2009
38.0584
24.0999
Empty Land
Y67
16 August 2009
38.0583
24.10422
Empty Land
Y68
16 August 2009
38.0585
24.1084
Empty Land
Y69
16 August 2009
38.0583
24.1125
Empty Land
Y70
16 August 2009
38.0583
24.1165
Empty Land
Y71
17 August 2009
38.0563
24.0763
Empty Land
Y72
17 August 2009
38.0498
24.0826
Empty Land
Y73
17 August 2009
38.053
24.088
Empty Land
Y74
17 August 2009
38.0499
24.096
Empty Land
Y75
17 August 2009
38.0501
24.1001
Empty Land
Y76
17 August 2009
38.0823
24.0446
Governorate Build
Y77
18 August 2009
38.05
24.1086
Water Authority
Y78
18 August 2009
38.0499
24.1125
Empty Land
Y79
18 August 2009
38.0516
24.0807
Educational Build
Y80
19 August 2009
38.0416
24.0827
Empty Land
Y81
19 August 2009
38.0416
24.0791
Al-Shate School
Y82
19 August 2009
38.0375
24.0833
Obeida School
Y83
20 August 2009
38.0326
24.0856
Empty Land
Y84
20 August 2009
38.0304
24.0913
Al-Waleed School
Y85
20 August 2009
38.0387
24.1792
Noise measurements were collected (Fig. 4) using five digital stations of 24-bit Quanterra Q330 digitizer equipped with high-performance portable Very Broad-Band (VBB) triaxial Streckeisen STS-2 velocimeter (with flat response from 8.33 mHz up to 50 Hz) with GPS timing. Generally known is the fact that man-made seismic noise represents a problem for seismic noise survey especially within densely urbanized areas in the form of traffic or industrial activities. To avoid recording of such transient signals into the measurements, special precautions should be taken whenever possible to measure as far as possible away from sites close to heavily traffic streets, boulevards and heavy-duty machines. In some cases, there are no possibilities in finding an appropriate site, then the measurements should be acquired in the early morning when there is relatively little human activity throughout the city. During the acquiring period of data the used seismometers have been installed in the early morning to collect the desired data after twenty-four hours of continuous recording. The measuring points are spread out within a range of 450 m vertically and 900 m horizontally forming a regular grid to achieve good quality of the contour maps for the fundamental frequency and amplification factor (Fig. 3).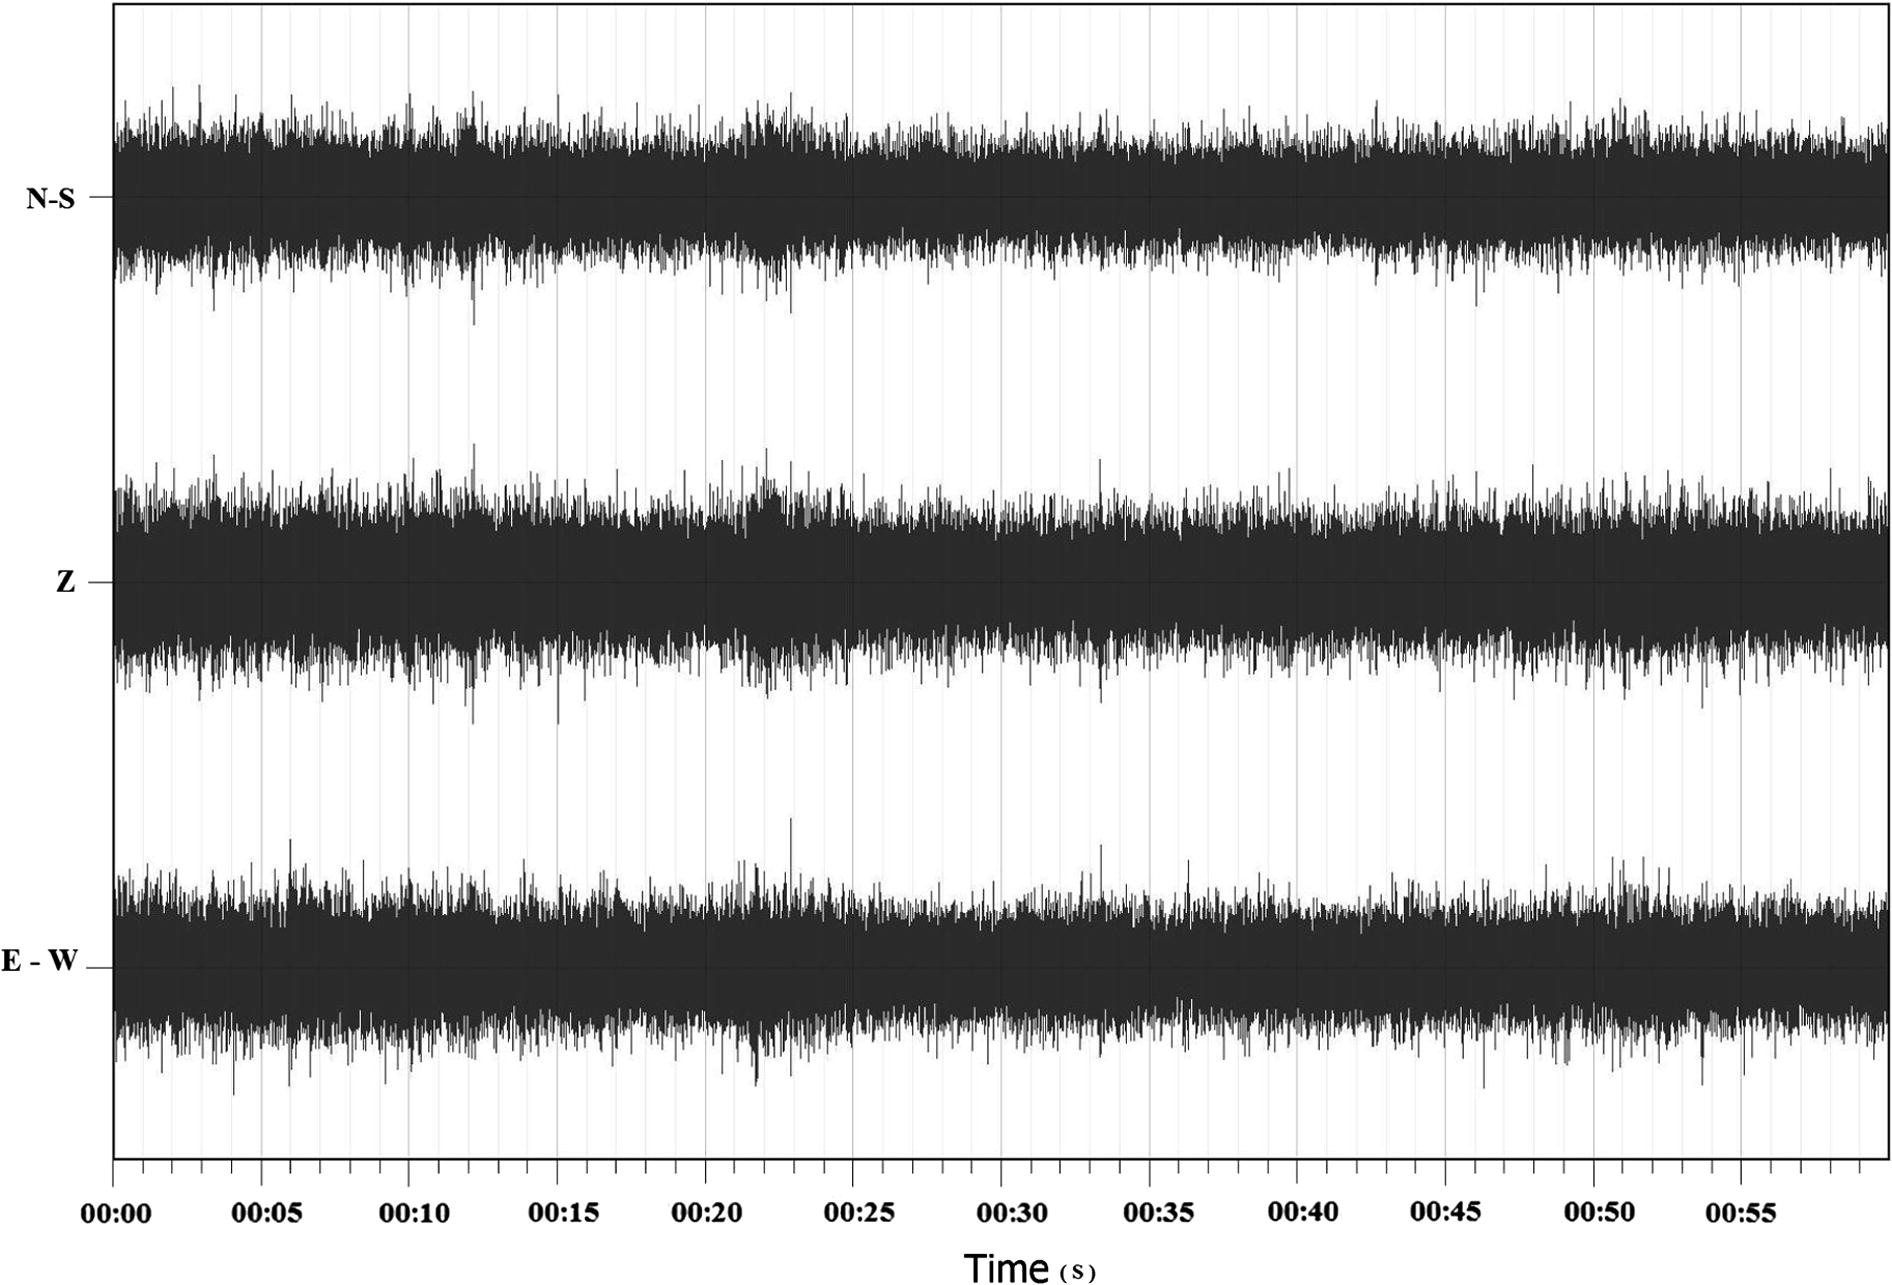
Microtremor record at Yanbu city.
Throughout the current work, all the sensors used were calibrated, installed in good coupling with soil, isolated thermally well against temperature changes using thick foam box and covered to reduce the interference of wind. Then, these sensors were oriented horizontally and vertically leveled. Ambient seismic noise was recorded with 200 Hz sampling rate for 24 h of continuous recording. This long duration of recording guarantees the statistical stabilization of the signal (Picozzi et al., 2005, 2008). All the experimental conditions for the current work were controlled mainly by the precautions of European SESAME research project (Chatelain et al., 2008; Guillier et al., 2008). Keeping in mind, higher fundamental resonance frequencies would be observed on sites having thin sediments, whereas the lower values of fundamental frequencies would be observed over the thick sediments (Nakamura, 1989; Atakan 1995; Lacave et al., 1999; Bard et al., 2004).
The collected data have been processed using the J-SESAME software developed within the framework of the great European project SESAME. The H/V spectral ratios were computed according to the following methodology: (1) base-line correction; (2) band-pass filtering to retain the frequencies in the range from 0.2 to 20 Hz; (3) windows of 50 s length were automatically selected using an anti-STA/LTA trigger algorithm and tapered with a 5% cosine function before the computation of spectra; (4) Fourier spectra were calculated for each noise component and smoothed using Konno–Omachi window having a smoothing constant b-value of 30; (5) the resulting spectral amplitudes of horizontal components were geometrically averaged and divided by the vertical spectra to calculate the H/V function. Moreover, stability of the peak in the H/V curve have been checked through three tests conducted at every measuring point, where the same frequency peaks were picked for each site at different times. Sensitivity tests were also carried out on the selected time window lengths during the data processing; the results declared low dependence of the window length and therefore, a high stability was achieved.
The reliability of the actual H/V curve obtained with the selected recordings should be tested throughout the following consequences: (i) for a peak to be significant, it is recommended checking that the following condition is fulfilled: f0 > 10/lw (window length). This condition means that, at the frequency of interest, at least 10 significant cycles in each window should be present, (ii) large number of windows and of cycles is needed. The total number of significant cycles: nc = lw · nw · f0 be larger than 200, and (iii) an acceptably low level of scattering between all windows is needed. Large standard deviation values often mean that ambient vibrations are strongly non-stationary and undergo some kind of perturbations, which may significantly affect the physical meaning of the H/V peak frequency. Therefore it is recommended that σA(f) be lower than a factor of 2 (for f0 > 0.5 Hz), or a factor of 3 (for f0 < 0.5 Hz), over a frequency range at least equal to [0.5f0 and 2f0].
Generally, as noticed in urban environments that, the H/V curves exhibit local narrow peaks – or troughs of industrial origin, related to some kind of machinery (turbine and/or generators). Such perturbations are recognized by the following general characteristics: (i) they may exist over a significant area (in other terms, they can be seen up to distances of several kilometers from their source), (ii) as the source is more or less “permanent” (at least within working hours), the original (non smoothed) Fourier spectra should exhibit sharp narrow peaks at the same frequency for all the three components, (iii) reprocessing with less and less smoothing: in the case of industrial origin, the H/V peak should become sharper and sharper (while this is not the case for a site effect peak linked with the soil characteristics), (iv) if other measurements have been performed in the same area, determine whether a peak exists at the same frequencies with comparable sharpness (the amplitude of the associated peak, even for fixed smoothing parameters, may vary significantly from site to site, being transformed sometimes into a trough), and (v) another very effective check is to apply the random decrement technique (Dunand et al., 2002) to the ambient vibration recordings in order to derive the “impulse response” around the frequency of interest: if the corresponding damping (z) is very low (below 1%), an anthropic origin may be assumed almost certainly, and the frequency should not be considered in the interpretation.
4 Results and discussion
H/V spectral ratios for the selected windows have been computed at 85 of surveyed sites (Fig. 5a–c). The presence of clear peak of H/V curve (Fig. 5a) is considered as an indicative of the impedance contrast between the uppermost surface soil and the underlying hard rock, where large peak values are generally associated with sharp velocity contrasts (Bard et al., 2004) and is likely to amplify the ground motion. Fig. 5b illustrates two of peaks that reflect the presence of two large impedance contrasts while, Fig. 5c present some of broad peak or plateau-like curve and this could be related to the presence of an underground sloping of the interface between softer and harder layers. These results declared that the underground structure of the site exhibits significant lateral variations in thickness and dynamic properties, which lead to a significant 2D or 3D effects.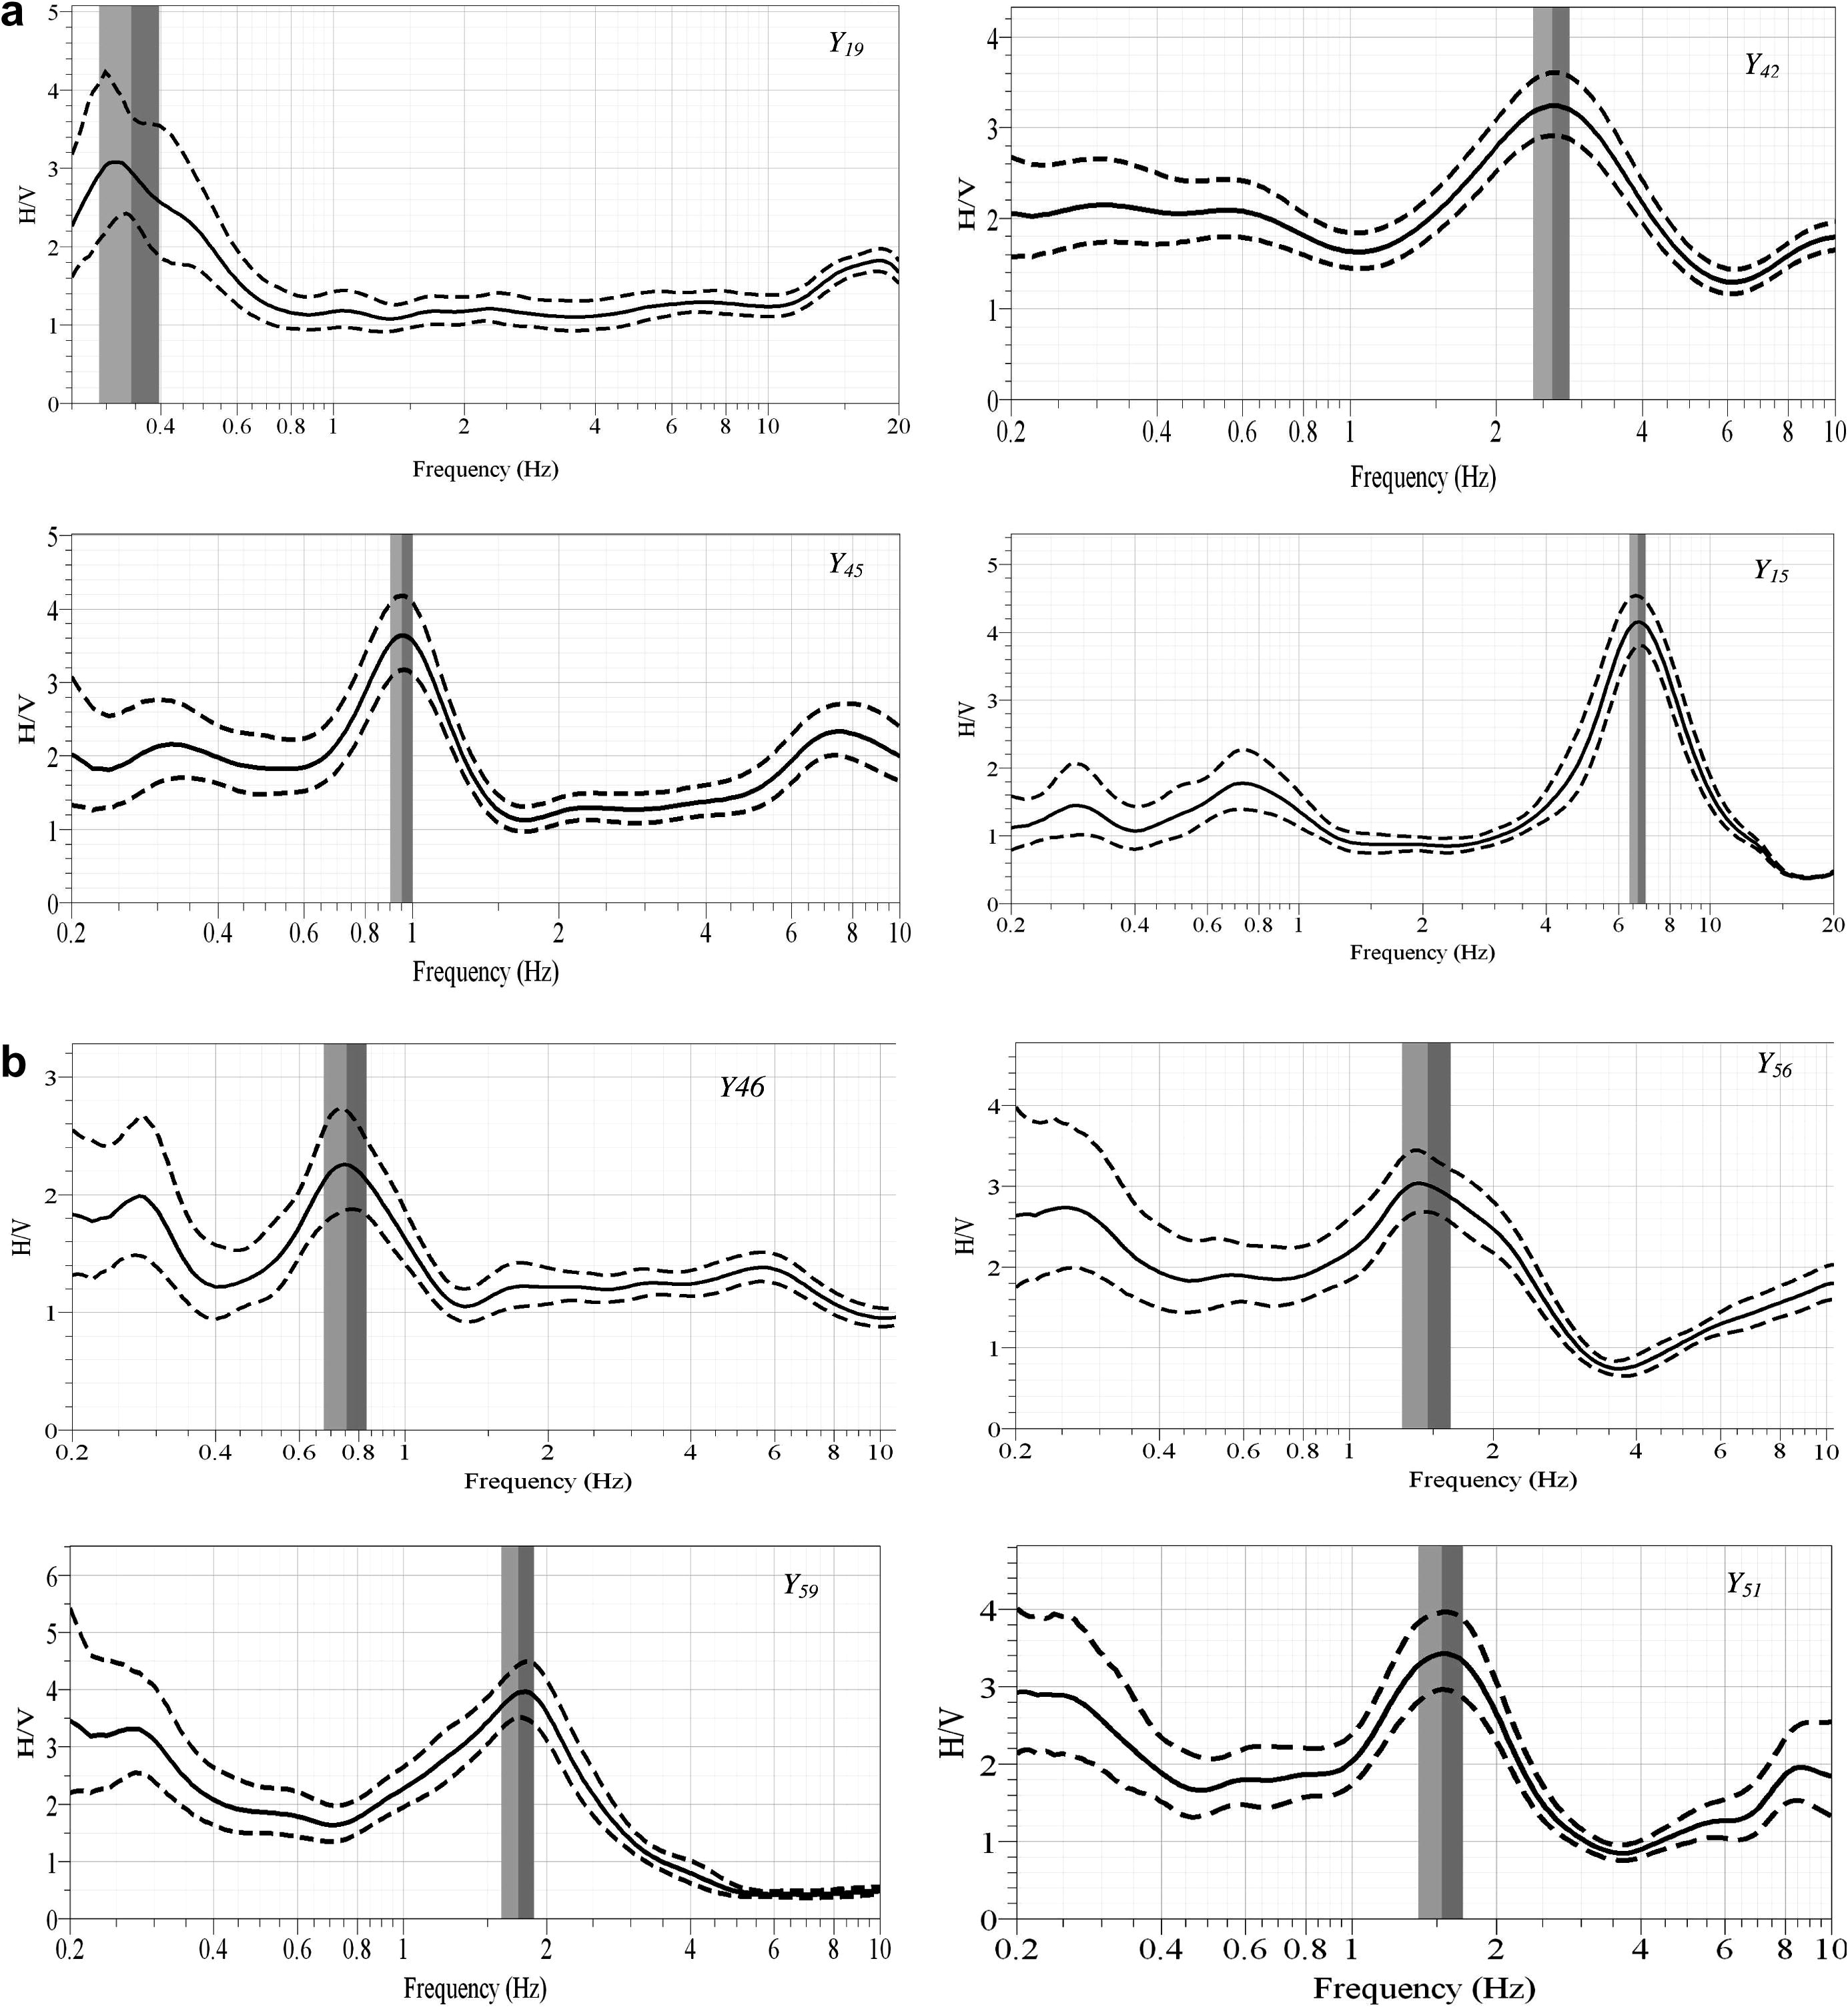
(a) Examples of clear peak of spectral ratio (H/V) curves. (b) Examples of two peaks of spectral ratio (H/V) curves. (c) Examples of multiple and broad peaks of spectral ratio (H/V) curves.
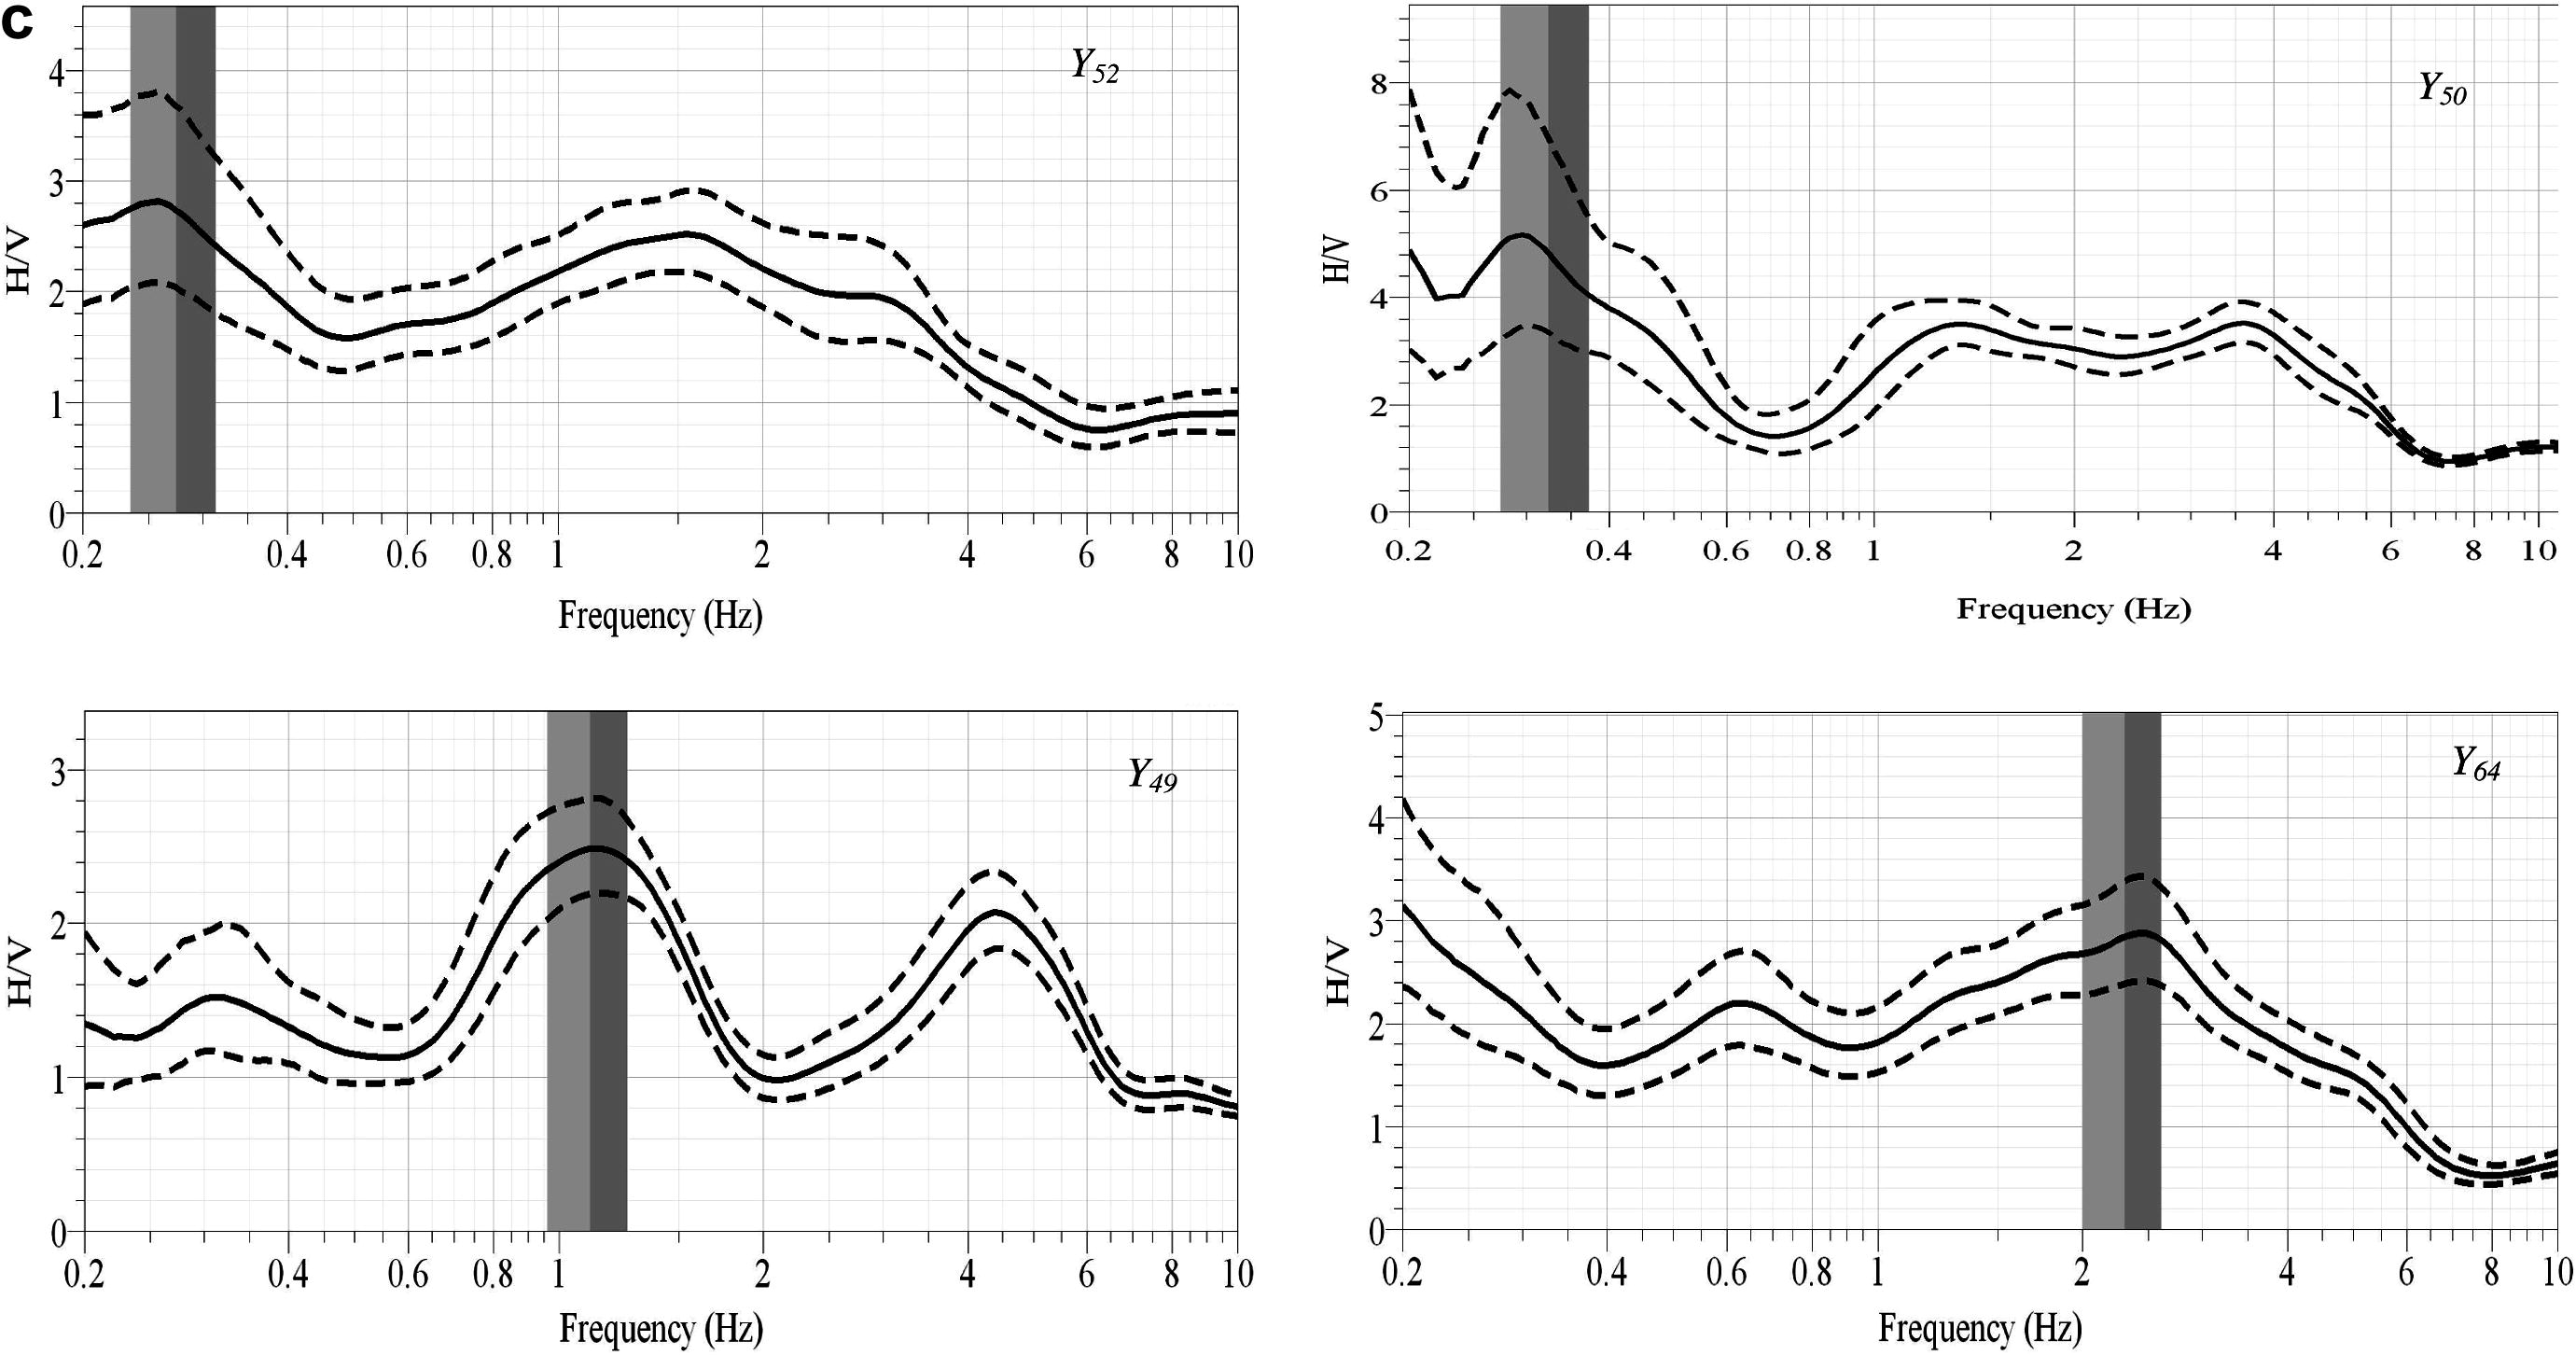
(a) Examples of clear peak of spectral ratio (H/V) curves. (b) Examples of two peaks of spectral ratio (H/V) curves. (c) Examples of multiple and broad peaks of spectral ratio (H/V) curves.
According to Fig. 6, the resonance frequency f0 varies from 0.25 to 7.9 Hz within the study area. The central part has lower values of f0 (less than 1 Hz) where 50% of f0 values lie in this area (Fig. 7). These low values indicate large thickness of sediments. While, there are some localized areas that have higher values of f0 (up to 6.7 Hz) distributed throughout the southeastern, southern, and southwestern parts of the area. The presence of high f0 at the southern part is limited to Al-Majd Sporting Club, Al-Maktaba, and Al-Shati secondary school sites. Parolai et al. (2001) stated that, the resonance frequency becomes lower in areas where the basement depth is greater and higher where it is shallower. Accordingly, the presence of higher and lower values reflect variation in the thicknesses of sediments through the area suggesting 2D or 3D basins in-between (Fig. 8). In general, the values of f0 increase due north.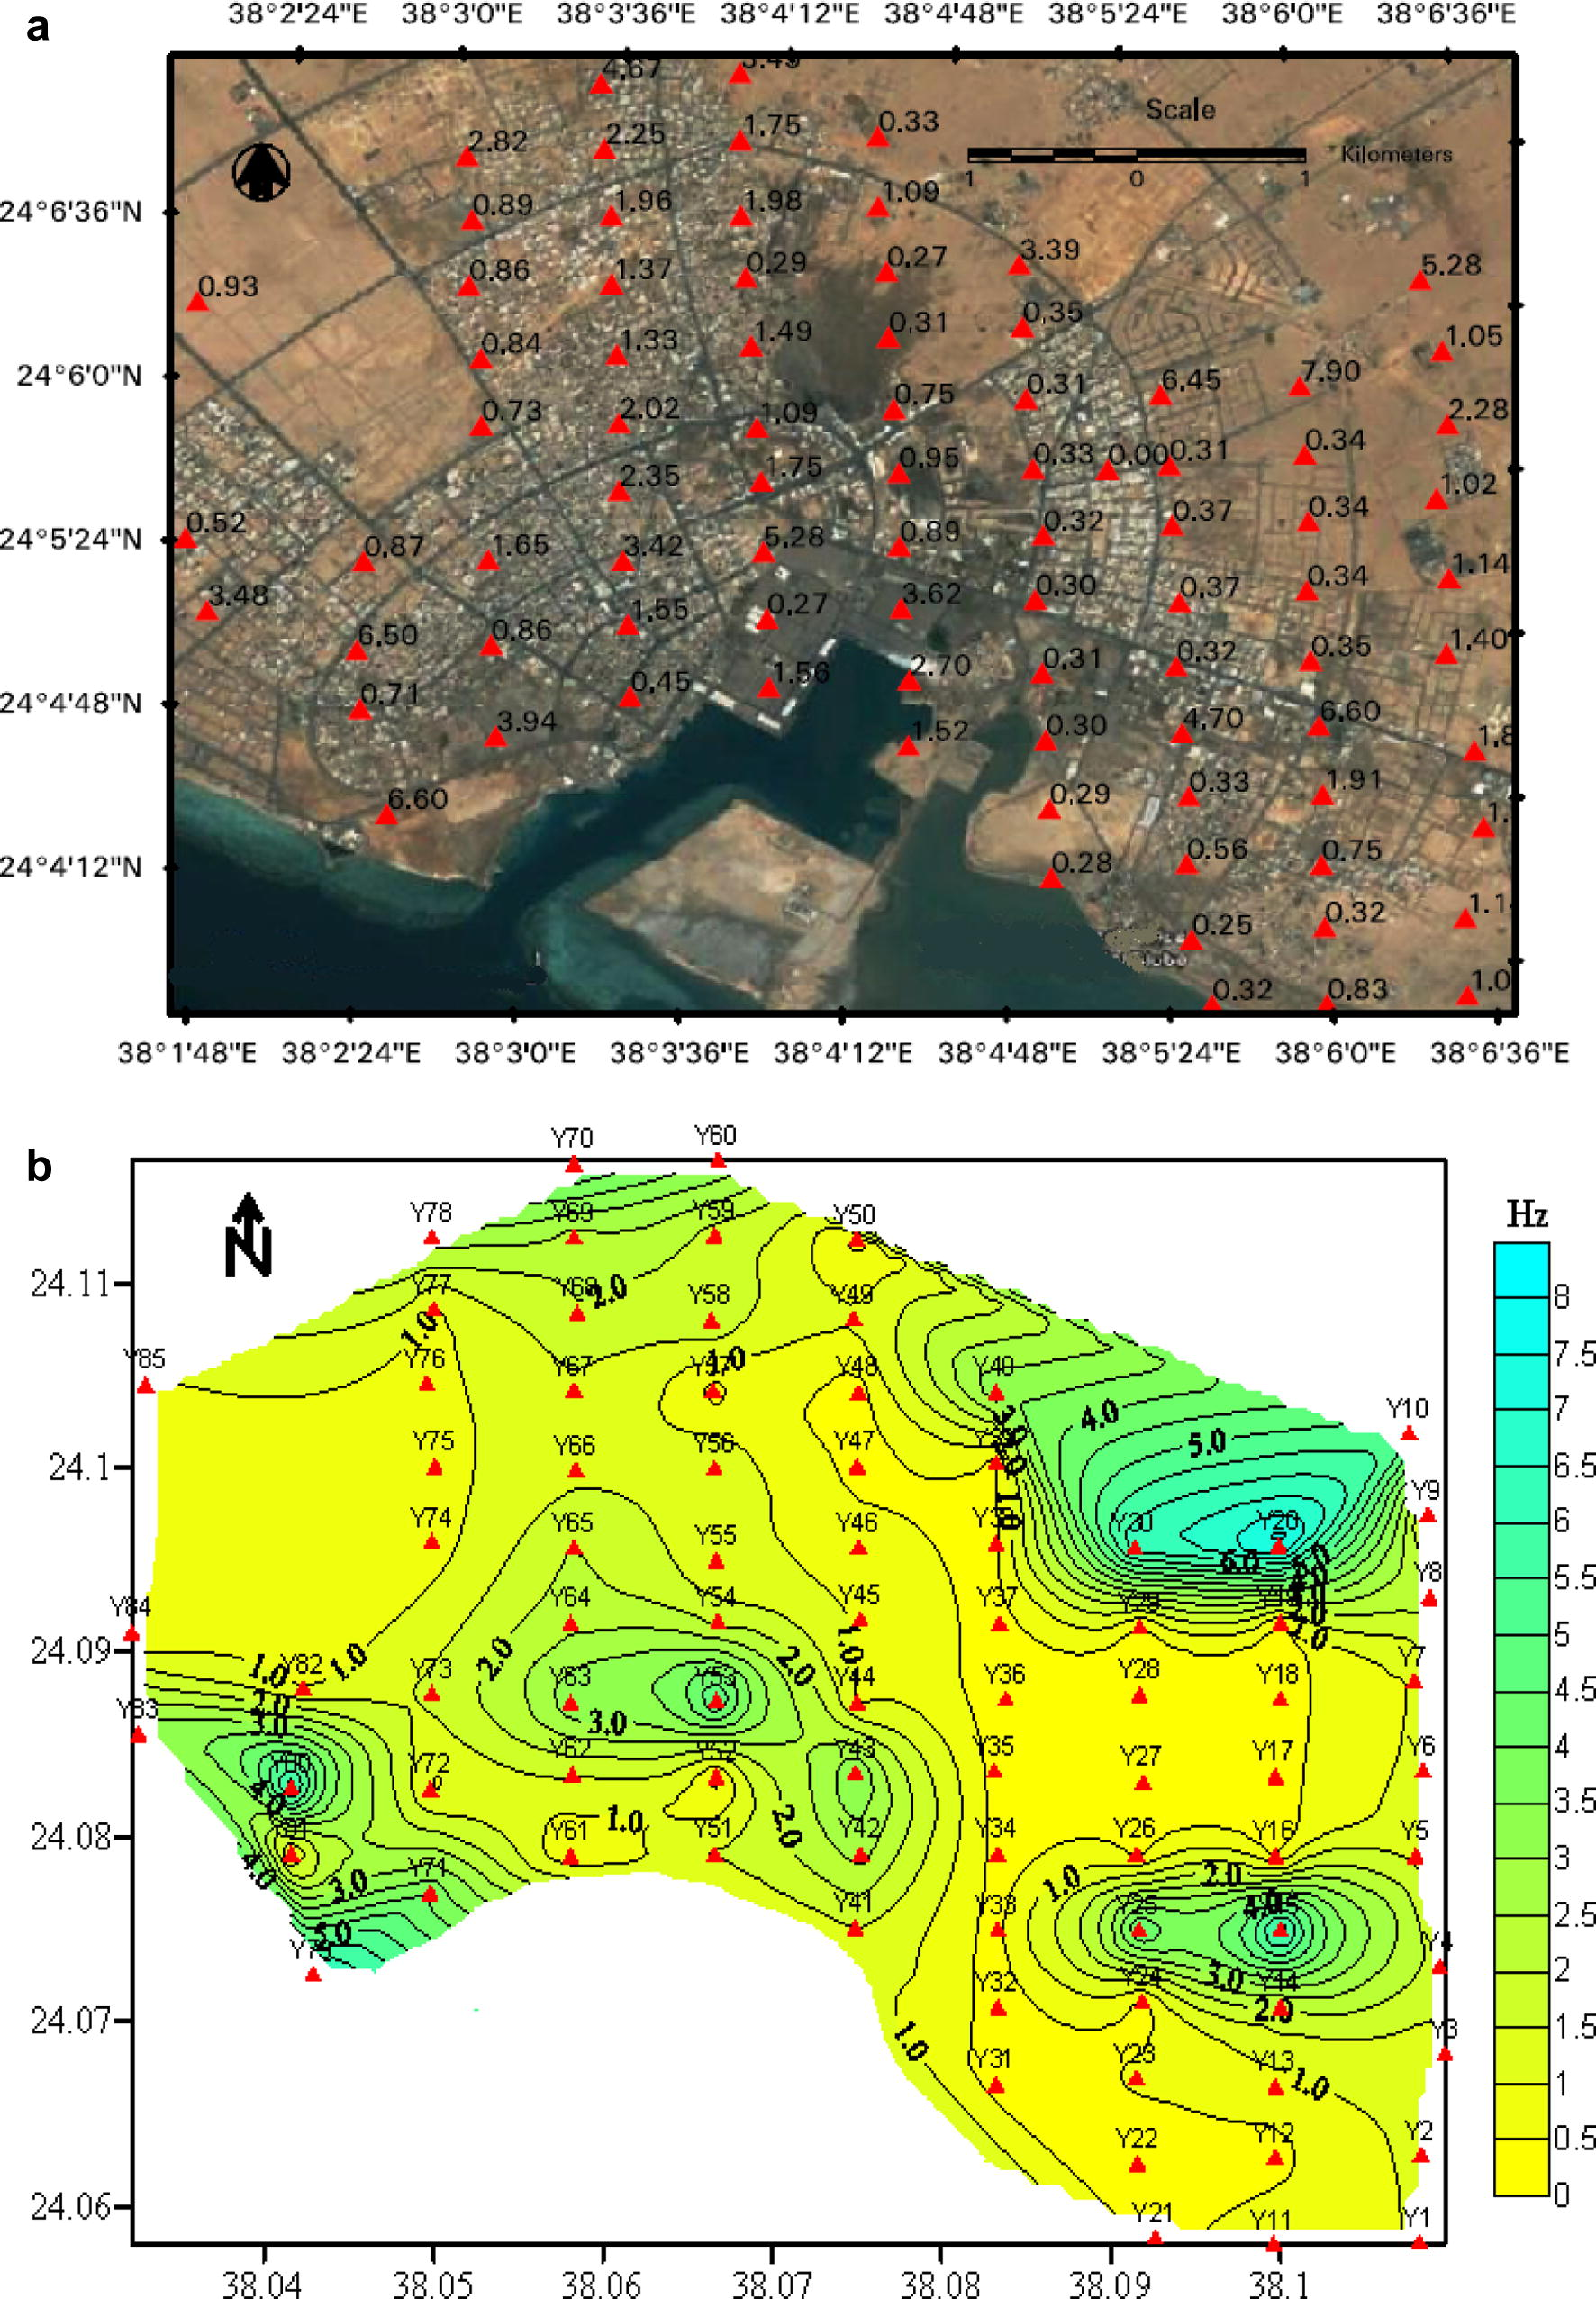
Contour map for f0 for Yanbu city.
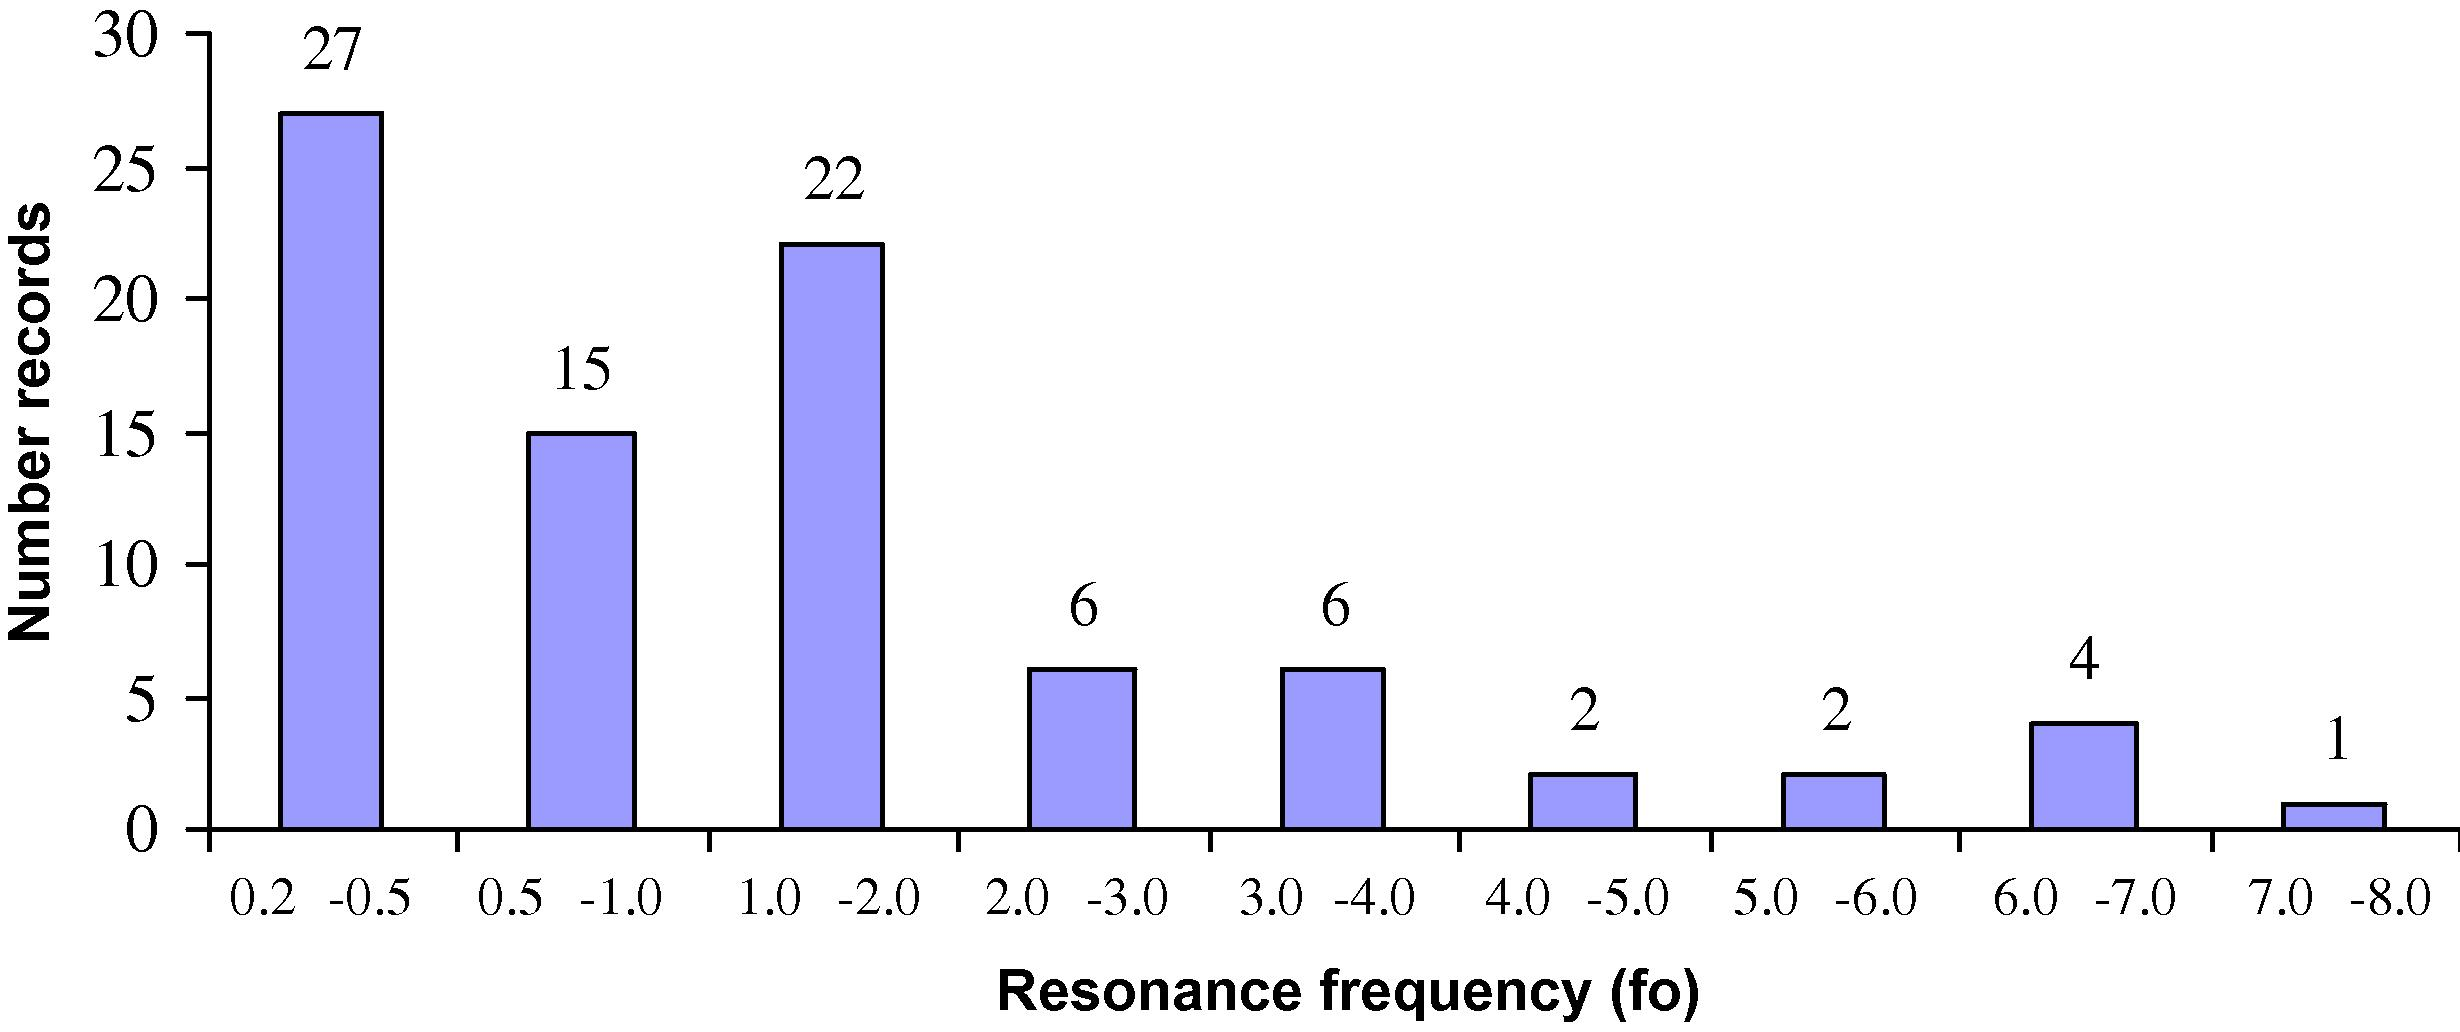
Relation between number of records and their values of f0.
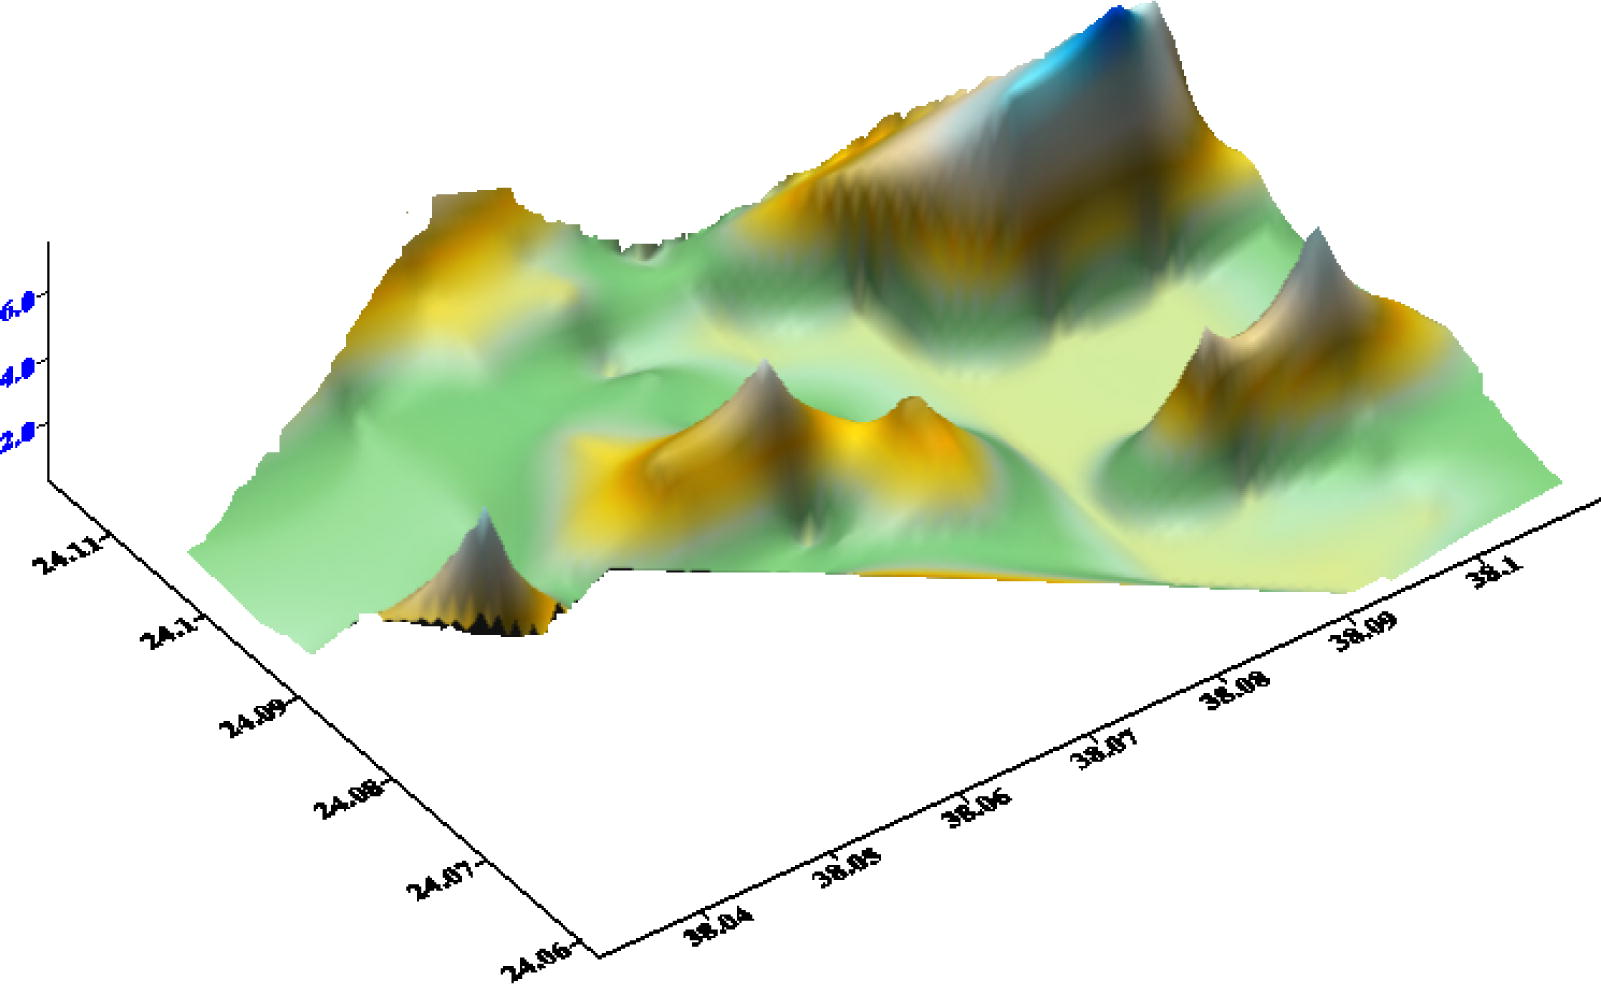
3D model for the subsurface basement at Yanbu city.
Contour map for H/V amplitude ratio Amax (Fig. 9) illustrated that, the eastern part of the area has values less than 2.5 while the western part has values less than 3. Whereas these values increases towards the central zone of Yanbu metropolitan where it has a value of 5. By referring to the surface soil distribution it can be observed that the central part characterized by the thick section of soft sediments (sabkhat) amplifies the ground-shaking intensity five times more than that of basement rocks. However, it is to be noted that these values give the lower bound estimates of amplification of H/V ratio for a given site. Generally, it could be mentioned that, there is significant variation in this parameter within the study area.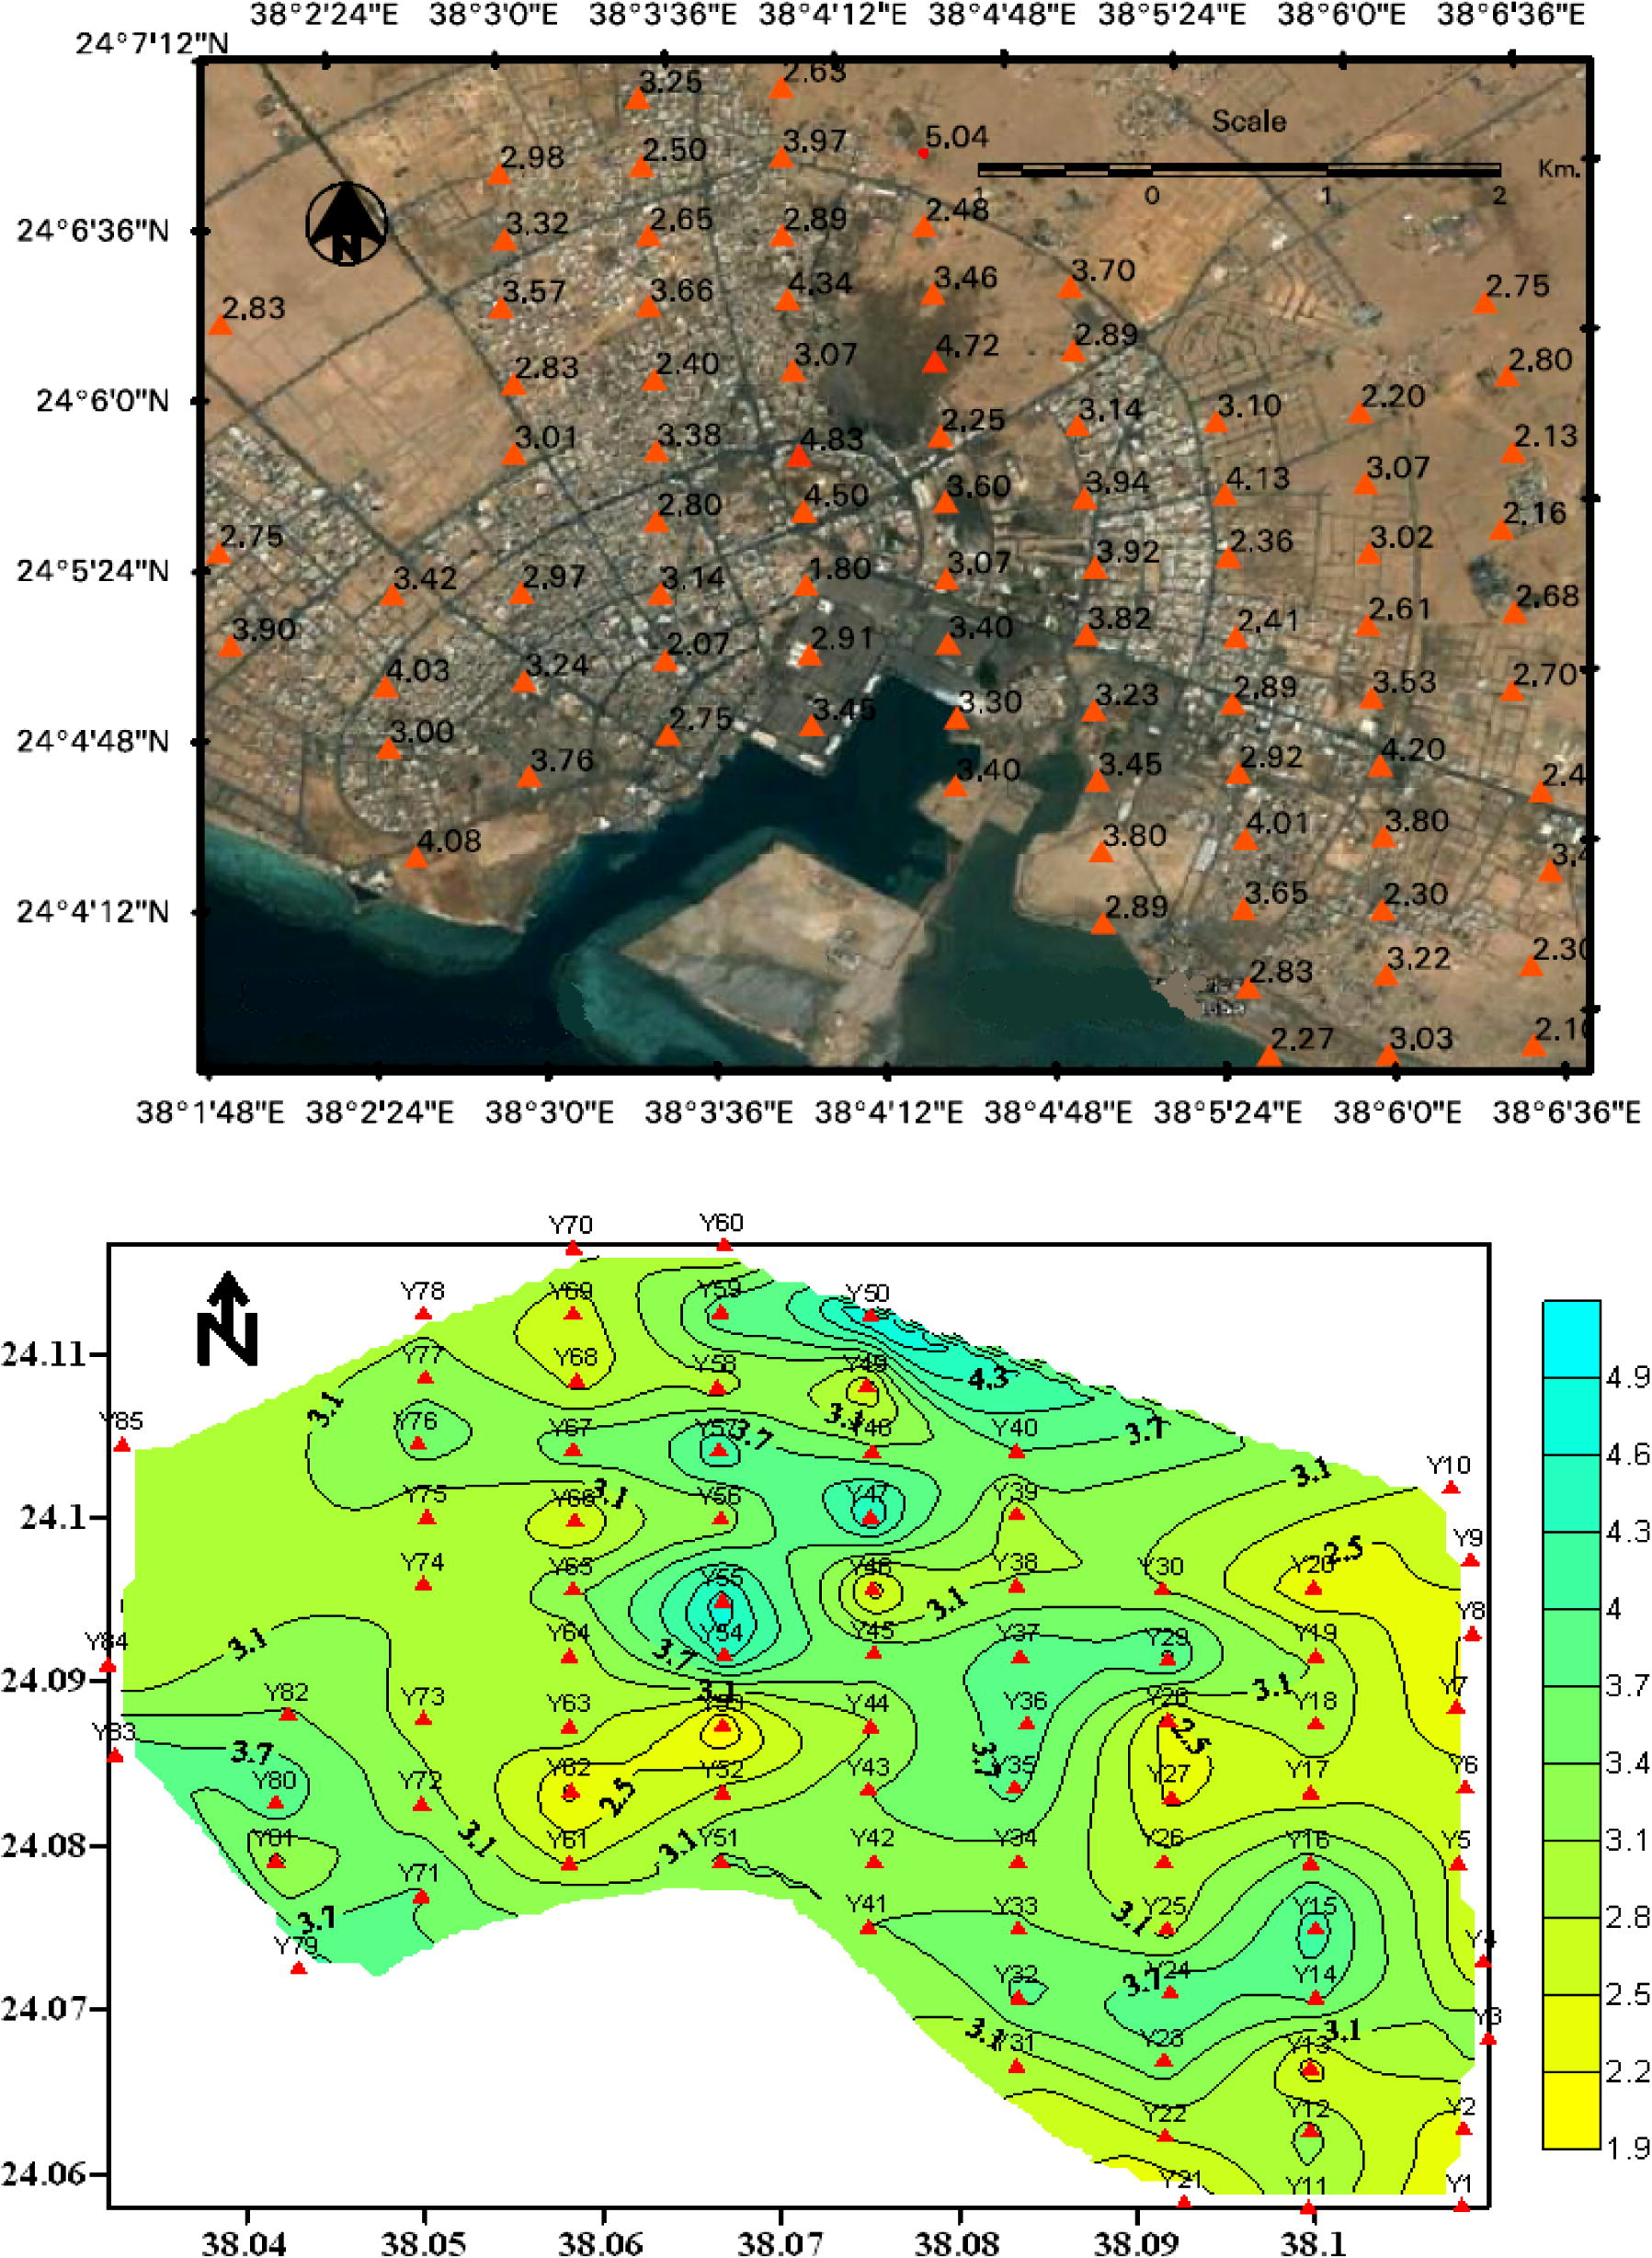
Contour map for H/V amplitude ratio Amax for Yanbu city.
Several studies show the relationship between the velocity structure beneath the recording site and the fundamental frequency obtained from HVSR (horizontal-to-vertical spectral ratios of microtremors) analysis (Ibs-von Seht and Wohlenberg, 1999; Parolai et al., 2002; Motamed et al., 2007). We used the sedimentary layer parameters obtained by Al-Haddad et al. (submitted for publication) through shear-wave velocity profiles, where a sample of ten boreholes have been drilled through the study area. Three of these boreholes are presented within the area of interest (Table 2). The weighted shear-wave velocities were computed according to the following formula:
where di and vsi denote the thickness (in m) and the shear-wave velocity (in m/s) of the ith layer, in a total of n layers, existing in the same type of stratum (di and vsi were determined by borehole measurements).
Al-Ahati secondary school
Al-Maktaba
Al-Majd sporting club
Depth (m)
Vs (m/s)
Thickness (m)
Depth (m)
Vs (m/s)
Thickness (m)
Depth (m)
Vs (m/s)
Thickness (m)
0.9
205.53
0.9
1.21
225.69
1.21
0.73
180.7
0.73
1.82
301.02
0.92
1.71
315.76
0.5
1.47
332.69
0.74
2.59
427.26
0.77
3.35
491.59
1.64
2.91
474.57
1.43
3.4
421.26
0.81
5.7
750.08
2.35
5.39
804.79
2.49
4.75
385.39
1.35
7.66
835.94
1.96
8.29
798.79
2.89
6.34
427.4
1.58
8.17
929.94
0.5
11.27
763.53
2.98
8.23
575.5
1.89
9.43
610.52
1.26
15.66
757.53
4.39
10.95
624.84
2.72
10.31
446.4
0.88
19.28
884.37
3.62
14.16
618.84
3.21
16.63
446.85
6.33
23.45
1069.09
4.17
17.56
691.27
3.4
20.88
640.83
4.25
30
1063.09
6.55
30
772.11
9.12
Vs(av) = 467.83
Vs(av) = 566.04
Vs(av) = 752.74
Then, the values of fundamental resonance frequency can be computed at these three localities through the application of the following equation (Bard, 2000):
where H is the total thickness (in m) of the sediments overlying the half-space and Vav is the average shear-wave velocity (in m/s) in the sediments. Using the above equation and the velocity model in Table 2, the resonance frequency f0 at these sites is estimated to be equal to 6.7 Hz at Al-Shati secondary school; 4.8 Hz at Al-Maktaba, and 6.3 Hz at Al-Majd Sporting Club where Vav values are 467.83 m/s; 566.04 m/s and 752.74 m/s respectively. On the other hand, the resonance frequency f0 estimated using the microtremor measurements, close to these boreholes, are 6.7 Hz, 5.2 Hz, and 6.5 Hz, respectively (Fig. 10) that reflects an excellent agreement between the estimated values for f0 from two independent techniques.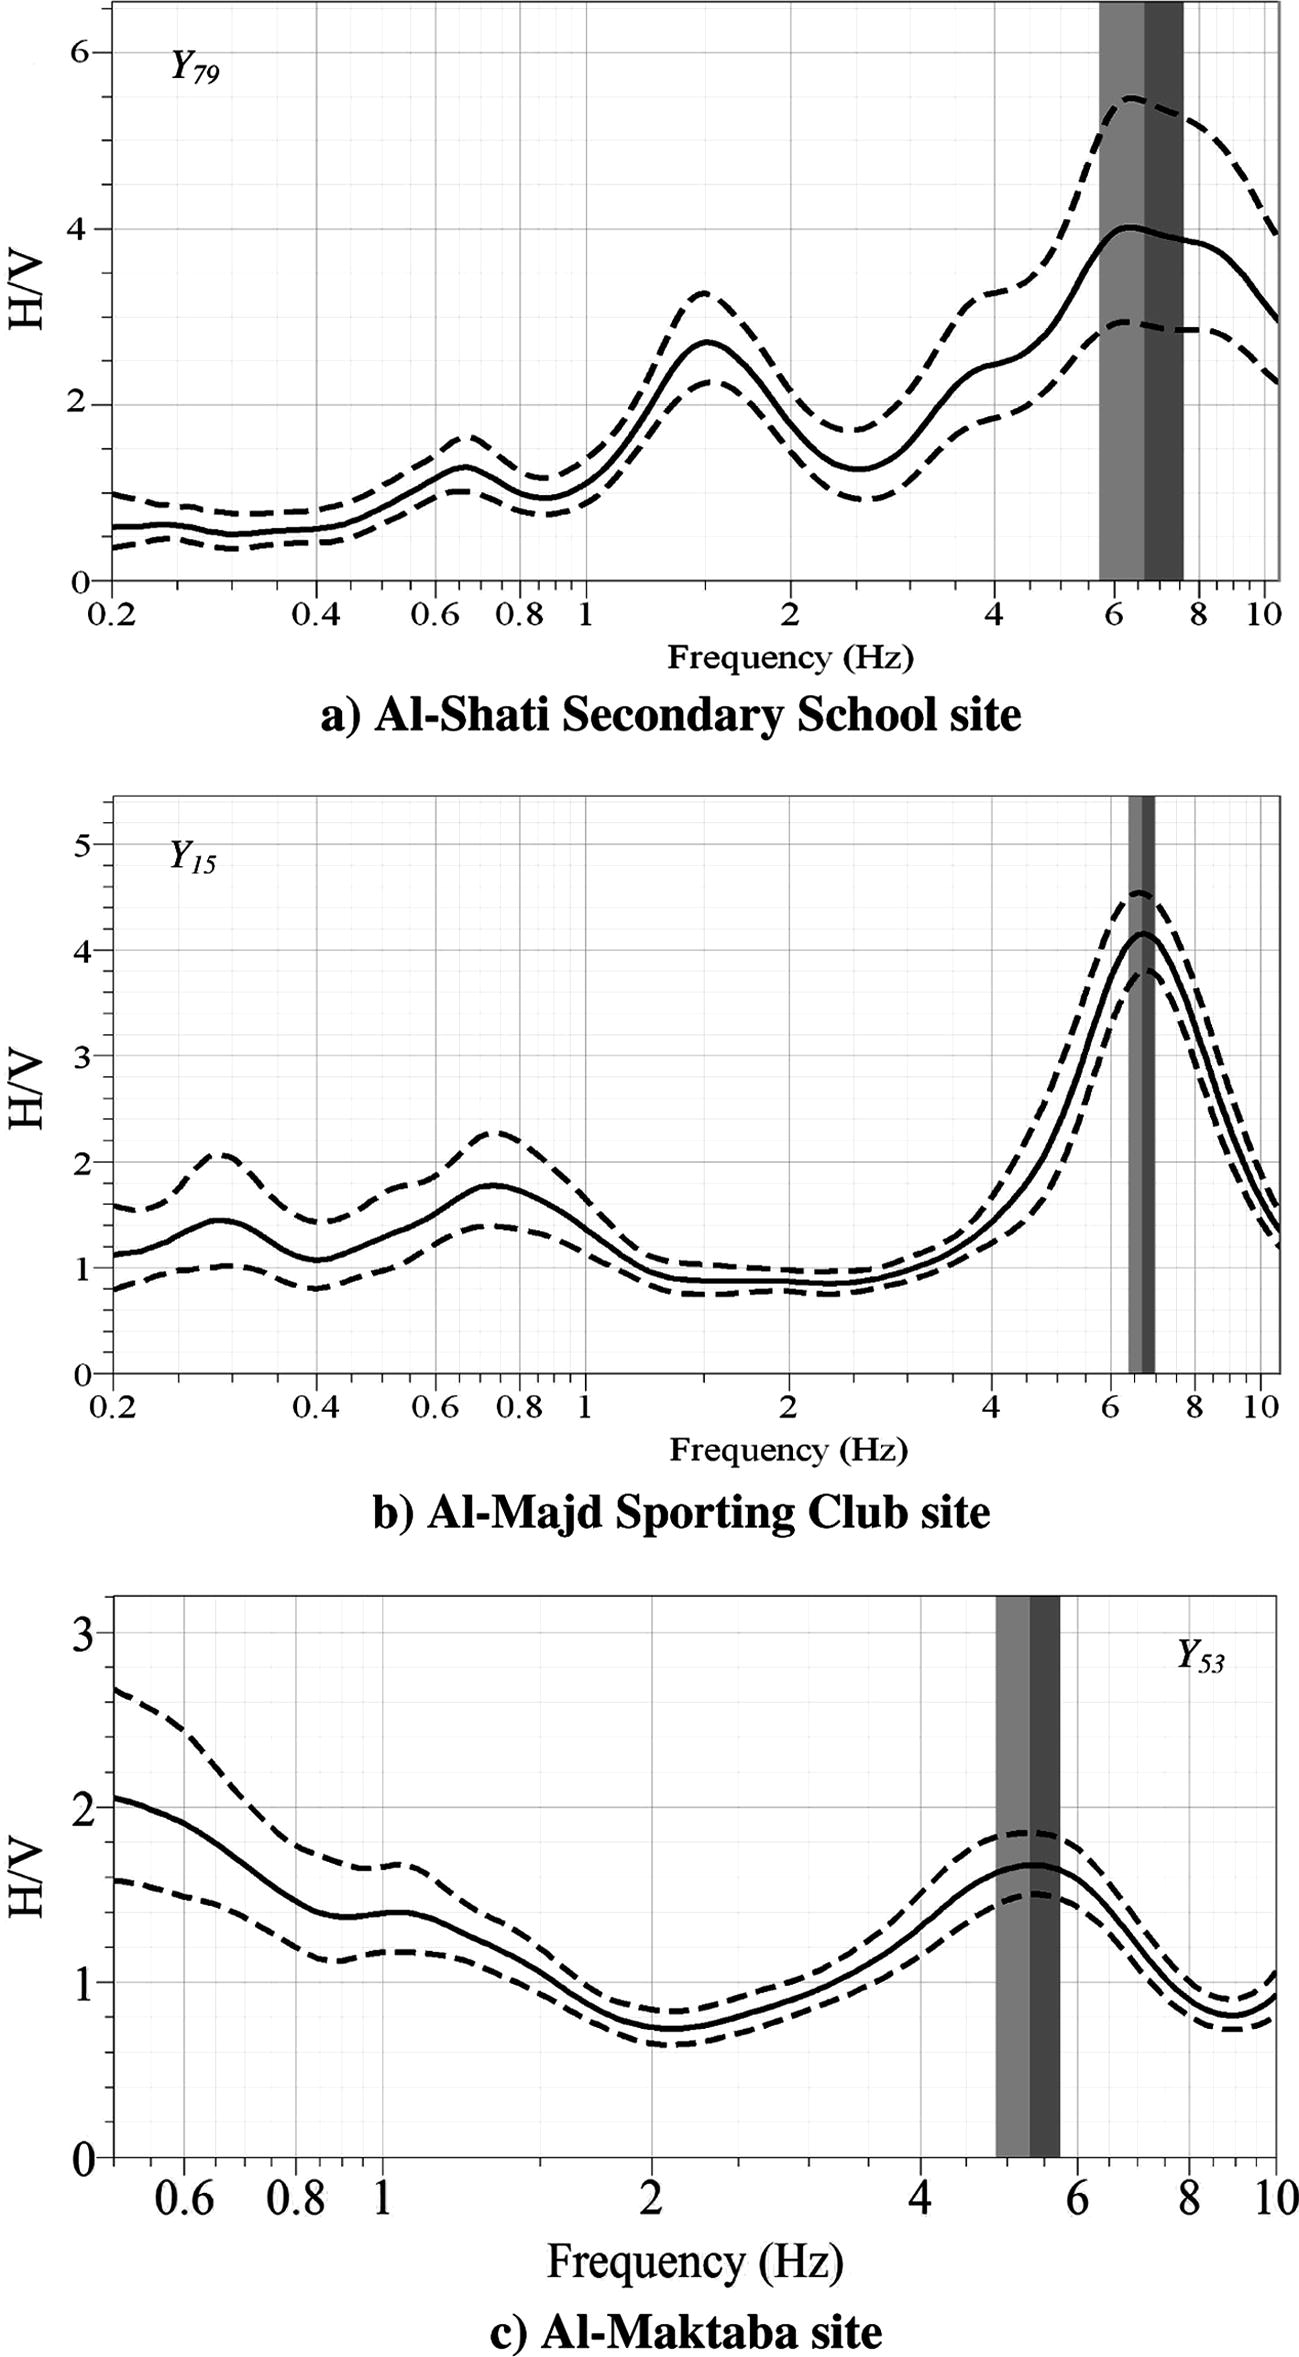
H/V results at three of geotechnical boreholes at Yanbu city.
5 Conclusions
Although Yanbu city is located close to Red Sea floor spreading active zone; it is not affected by recent instrumentally strong earthquakes. Moreover, most of the city is built on thick soft sediments, which could reasonably amplify the earthquake ground motion in the case of an event. No site effects analyses have been carried out in the city, therefore, it is believed that a detailed study of the local response of Yanbu city should be of some concern in terms of seismic hazard. The current work represents the first attempt to derive useful information on local ground motion amplification in the urban area of Yanbu.
Analysis of microtremor measurements show that the resonance frequency varies considerably through Yanbu city. Values of resonance frequency increase as the basement depth decreases. The central part of the city has low values of f0 as compared to other parts of the city suggesting basinal shape with great thickness of sediments. The results of microtremor data are in congruence with the shear-wave velocity profiles through Yanbu city.
Finally, it is declared that, the using of microtremor measurements represents a powerful tool for microzonation studies in spite of their tendency to underestimate the level of ground motion amplification when compared with earthquake records.
References
- Al-Amri, A.M., Fnais, M.S., 2009. Seismo-volcanic investigation of 2009 earthquake swarms at Harrat Lunayyir (Ash Shaqah), Western Saudi Arabia. Int. J. Earth Sci. Eng., India, in press.
- Al-Haddad, M., Al-Refeai, T.O., Al-Amri, A.M., 2001. Geotechnical investigation for earthquake resistant design in western coast of the Kingdom. Final Report for the Contract No. AR-14-77 (Two Phases). King Abdulaziz City for Science and Technology (KACST), Riyadh, SA.
- Oolitic iron-ore deposits in Wadi Fatima between Jeddah and Mecca, Saudi Arabia. Saudi Arabian Dir. Gen. Min. Resour. Bull.. 1966;2:51.
- [Google Scholar]
- Seismicity of Egypt, Arabia and the Red Sea. Cambridge University Press; 1994.
- Atakan, K., 1995. A review of the type of data and the techniques used in empirical estimation of local site response. In: Proceedings of the Fifth International Conference on Seismic Zonation, October 17-19, 1995, Nice, France, vol. II. Ouest Éditions, Presses Académiques, pp. 1451–1460.
- An overview of local site effects and the associated building damage in AQdapazari during the 17 August 1999 Izmit earthquake. Bull. Seismol. Soc. Am.. 2002;92(1):509-526.
- [Google Scholar]
- Bard, P.-Y., 1994. Effects of surface geology on ground motion: recent results and remaining issues. In: Paper Presented at the 10th European Conference on Earthquake Engineering, Vienna.
- Lecture Notes on “Seismology, Seismic Hazard Assessment and Risk Mitigation”. Potsdam: International Training Course; 2000. p. 160
- Guidelines for the Implementation of the H/V Spectral Ratio Technique on the Ambient Vibrations: Measurements, Processing and Interpretation. Universitate Joseph Fourier; 2004.
- Evaluation of the influence of experimental conditions on H/V results from ambient noise recordings. Bull. Earthquake Eng.. 2008;6(1):33-74.
- [Google Scholar]
- Dunand, F., Bard, P.-Y., Chatelain, J.-L, Gueguen, Ph., Vassail, T., Farsi, M.N., 2002. Damping and frequency from randomec method applied to in-situ measurements of ambient vibrations: evidence for effective soil structure interaction. In: Proceedings of the 12th European Conference on Earthquake Engineering, London, Paper No. 868.
- Seismicity and tectonics of the Red Sea and Western Arabia. Geophys. J. Royal Astron. Soc.. 1989;97:449-457.
- [Google Scholar]
- A comparison and test of various site-response estimation technique, including three that are not reference site dependent. Bull. Seismol. Soc. Am.. 1995;85:1127-1143.
- [Google Scholar]
- Modelling three-dimensional site response effects in the Marina District basin, San Francisco, California. Bull. Seismol. Soc. Am.. 1993;83:1042-1063.
- [Google Scholar]
- Influence of instruments on the H/V spectral ratios of ambient vibrations. Bull. Earthquake Eng.. 2008;6(1):29.
- [Google Scholar]
- Microtremor measurements used to map thickness of soft sediments. Bull. Seismol. Soc. Am.. 1999;89:250-259.
- [Google Scholar]
- Lacave, C., Bard, P.-Y., Koller, M.G., 1999. Microzonation: techniques and examples. In: Block 15: Naturgefahren-Erdbebenrisiko (Electronic Book on the Internet; http://www.ndk.ethz.ch/pages/publ/Koller.pdf), 23pp.
- Site effects evaluation using spectral ratios with only one station. Bull. Seismol. Soc. Am.. 1993;83:1574-1594.
- [Google Scholar]
- Merghelani, H.M., 1981. Seismicity of Yanbu region, Kingdom of Saudi Arabia, Technical Record 16. US Geol. Surv. Saudi Arabian Mission, Jeddah, Saudi Arabia, 32p.
- Seismic microzonation and damage assessment of Bam City, Southeastern Iran. J. Earthquake Eng.. 2007;11:110-132.
- [Google Scholar]
- Nakamura, Y., 1989. A Method for Dynamic Characteristics Estimation of Subsurface using Microtremor on the Ground Surface. Q. Rep., RTRI:30, pp. 25–33.
- Nakamura, Y., 2000. Clear identification of the fundamental idea of Nakamura's technique and its applications. In: Paper Presented at the 12th World Conference on Earthquake Engineering, Aukland, New Zealand, 8p.
- Pallister, J.S., 1984. Explanatory Notes to the Geologic Map of the Al Lith Quadrangle, Sheet 20 D., Kingdom of Saudi Arabia.
- Assessment of the natural frequency of the sedimentary cover in the Cologne area (Germany) using noise measurements. J. Earthquake Eng.. 2001;5:541-564.
- [Google Scholar]
- New relationships between V s, thickness of sediments, and resonance frequency calculated by H/V ratio of seismic noise for the Cologne area (Germany) Bull. Seismol. Soc. Am.. 2002;92:2521-2526.
- [Google Scholar]
- Pellaton, C., 1979. Geologic Map of the Yanbu Al Bahr Quadrangle, Sheet 24C, GM-48 A. Director General for Mineral Resources, Jeddah.
- Statistical analysis of noise horizontal to vertical spectral ratios (HVSR) Bull. Seismol. Soc. Am.. 2005;95
- [Google Scholar]
- Picozzi, M., Strollo, A., Parolai, S., Durukal, E., Özel, O., Karabulut, S., Zschau, J., Erdik, M., 2008. Site characterization by seismic noise in Istanbul, Turkey. J. Soil Dyn. Earthquake Eng. doi:10.1016/j.soildyn.2008.05.007.
- Historical seismicity in the near and middle east, North Africa, and Spain from Arabic documents (VIIth–XVIIth century) Bull. Seismol. Soc. Am.. 1980;70:2185-2201.
- [Google Scholar]
- The Mexico earthquake of September 19, 1985 – a study of amplification of seismic waves in the valley of Mexico with respect to a local hill zone site. Earthquake Spectra. 1988;1:653-673.
- [Google Scholar]
- Local site effects in Ataköy, Istanbul, Turkey, due to a future large earthquake in the Marmara Sea. Geophys. J. Intern.. 2006;167(3):1413-1424.
- [Google Scholar]


