

Translate this page into:
Metatranscriptomic analysis reveals co-expression pattern of mitochondrial oxidative phosphorylation (OXPHOS) genes among different species of bony fishes in muscle tissue
⁎Corresponding author. lingengming@tio.org (Geng-Ming Lin)
-
Received: ,
Accepted: ,
This article was originally published by Elsevier and was migrated to Scientific Scholar after the change of Publisher.
Peer review under responsibility of King Saud University.
Abstract
Mitochondrion is an organelle responding to providing cell energy by oxidative phosphorylation (OXPHOS) reaction. In the mitochondrial genome of animals, 13 important protein-coding genes (ND1, ND2, ND3, ND4, ND4L, ND5, ND6, CTYB, COX1, COX2, COX3 ATP6, ATP8) play important roles on mediating the OXPHOS reaction. The study is to compare the expressional level of 13 mitochondrial PCGs among muscle of diverse fish species to ask whether the 13 PCGs expressional level is correlated to fish living habitat or phylogenetic position. We used a metatranscriptomic approach to explore the expression level of 13 PCGs among diverse fish species (24 bony fish and one cartilaginous fish) by downloading the raw next-generation data from the NCBI SRA database and using two commercial software of Geneious and CLCBio to perform gene mapping and gene expression profiling. Principal component analysis (PCA) and hierarchy clustering were utilized to study the gene or species relationship based on 13 PCGs’ expression pattern. Based on the results, we discovered the expression pattern of PCG genes derived from the same OXPHOS complex is closer to each other showing co-expression or co-regulation relationship. The 13 PCGs expression profile was not co-related to fish living habitats but instead, well correlated to their phylogenetic position. The clustering results for 13 PCGs’ expressional patterns showed bony fish and cartilaginous fish were grouped into two distinct clades. For bony fish clades, all COX genes displayed high expression patterns while for the cartilaginous clade, the CYTB gene was highly expressed with the low expression level of COX3. In conclusion, by using the metatranscriptomic approach, we were able to explore and compare the gene expression profiles of 13 PCGs from diverse fish species for the first time. The co-expression pattern of 13 PCGs discovered in fish was well consistent with previous observations done in plants or mammals. However, one has to keep in mind that the current finding results were based only on one example of a cartilaginous fish that was accessible in the SRA database. Thus, future studies are needed by constructing more additional cartilaginous fish muscle transcriptomes.
Keywords
Metagenomics
Muscle
Transcriptome
Protein-coding gene
Mitogenome

1 Introduction
As an important component in establishing a foundation for the management and protection of biological variety, genetic information lead researchers to resolve the evolutionary histories of various biological species. Recently, some researchers proposed that in order to distinguish all, or at least the vast majority of, animal species, a single gene sequence such as mitochondrial DNA, one of the most useful information sources for metazoans, would be sufficient. The barcode sequence of the cytochrome c oxidase subunit 1 (COX1) gene is one example of a single gene in mitogenomes sequence that becomes a useful tool for species identification as a global bio-identification system for animals. In addition, this barcode sequence has been thoroughly collected in the Barcode of Life project (Iwasaki et al., 2013; Ward et al., 2005). Nowadays, over 1500 proteins are considered to be involved in the function of mitochondria, the organelles that capable to produce cellular energy (adenosine triphosphate, ATP) and located in eukaryotic cells. From those proteins, 13 proteins are encoded by the mitochondrial (mt) genome, the organelle’s own genome, while the rest of these proteins are encoded by the nuclear genome (Shao and Barker, 2007). Because of its relatively simple structure, predominant female inheritance, and high rate of evolution, mitochondrial DNA (mtDNA) becomes one of the helpful tools in studies of phylogenetics, phylogeography, molecular evolution, and population and conservation genetics. On the vertebrates, the mitochondrial genome composes of a circular molecule with a variety of sizes among 16–19 kb. Normally, it consists of 37 genes encoding 22 transfer RNAs, 13 protein-coding genes, 2 ribosomal RNAs, and a variable control region (CR) or D-loop (Prosdocimi et al., 2012). These protein-coding genes are composed of 7 NADH dehydrogenase subunits (ND1, 2, 3, 4, 4L, 5, and 6), 3 cytochrome c oxidase subunits (COX1, 2, and 3), 2 ATP synthetase subunits (ATPase 6 and 8), and cytochrome b (CYTB). Furthermore, substitution patterns in these protein-coding genes follow some relatively well-understood rules. Therefore, by this regularity in the way in which mutations accumulate, protein-coding genes become attractive candidates for phylogenetic studies of fish (Beaumont, 1994).
Besides their important role in the ecology of the hydrosphere and the evolution of vertebrates, fish mitogenomic sequence data have provided a fruitful source of information to identify new fish species and elucidating fish phylogenies (Imoto et al., 2013; Iwasaki et al., 2013; Poulsen et al., 2009). Unfortunately, since sufficient resolution of higher-level relationships of organisms seemingly needs longer DNA sequences than those currently being analyzed, deficiencies of resources and time give adversities to obtain such sequences from many taxa. However, these difficulties in molecular systematics of fishes have been solved by the development of a Polymerase Chain Reaction (PCR)-based approach to sequence the complete mitochondrial genome (mitogenome). This approach uses a long PCR technique and plentiful fish-versatile PCR primers. With this approach, technical difficulties in character sampling to sequence whole mt genomes also have been partially alleviated. In addition, it is also capable to produce accurately homologous characters that are needed to improve the phylogenies estimation as well (Miya et al., 2001). Mitochondrial DNA regions have been well studied in fishes with the aids of PCR amplification with universal primer sequences or next-generation sequencing (NGS) technologies (Kocher and Stepien, 1997).
The protein-coding genes from mtDNA play an essential role in ATP production. In the most living teleost fish normal condition, production of muscle energy occurred when the tissue enzymes burn or oxidize fat or glycogen in a chain of reactions while carbon dioxide (CO2), water, and the energy-rich organic compound ATP were produced during this process. This type of respiration happens in two stages: an aerobic and an anaerobic, which depends on the continued presence of oxygen (O2) (Huss, 1995). However, some fish contractile systems are adapted and evolved to be effectively functioned in order to live at a distinct temperature range. Previous research revealed some fish that capable to rebuild their myofibrillar system for cold or warm temperatures swimming to adapt to diverse environmental temperatures on a seasonal basis (Duan et al., 2018). Furthermore, it was also found that the specific ATPase activity in the Antarctic fish was much higher than tropical or temperate fish at a given measurement temperature. The adaptation process to cold temperature in a latitudinal cline is related to the increment of mitochondrial densities in fish muscle. High densities of mitochondrial and/or increased capacities of mitochondrial enzymes occurred as a rise in aerobic capacity. Furthermore, another study also found that during acclimation to cold and warm temperatures, the myofibrils ATPase activity from carp muscle was altered (Hoar et al., 2000). It has been known that mitochondria play an important role in those processes, as they are the main site of ATP production, thus, their capacity and density reflecting aerobic energy turnover in animals (Lucassen et al., 2006). Therefore, based on these findings, the 13 PCGs expression profile from bony fish mtDNA was studied in order to discover whether its expression is co-related to the fish living habitat condition or not.
The bony fish is the largest class of vertebrates and bony fish consisting of 45 orders, and over 435 families and 28,000 species. This extraordinary taxonomic diversity is associated with a remarkable variety of morphological features and adaptations to very different habitats, ranging from freshwater and seawater, and it has made bony fish species a very attractive subject for the present study. Besides their importance in aquaculture, some bony fish, including salmon, tuna, carp, and eel, are also economically important for humans.
In the present day, many fish phylogenies at various taxonomic levels with highly congruent result trees and strong statistical support with those originated from independent nuclear were resolved by whole mitogenome sequences with extensive taxon sampling. In spite of these efforts, many phylogenetic problems for many distinct clades of fish where the diversity surpasses several hundred or thousands of species remain unsolved (Saitoh et al., 2006). Moreover, the transcriptomic features of some diverse fish muscles in terms of gene expression levels of the protein-coding genes (PGCs) are very little known about. Therefore, the aim of the present study was to compare the gene expression levels of 13 PGCs in the muscle among some diverse fishes. To the best of our knowledge, this is the first study to evaluate the gene or species relationship based on bony fish mtDNA 13 PCGs’ expression pattern. We studied fish from a different family, environmental temperature, and rate of evolution. By comparing the gene expression patterns in the genetically diverse fish species, our present data set extends the more precise phylogenies at several taxonomic levels of fish.
2 Materials and methods
2.1 Handling with RNAseq data
The fish muscle’s NGS reads were downloaded from the ftp site of Sequence Read Archive (SRA) in the DDBJ database (http://trace.ddbj.nig.ac.jp/dra/index_e.html) by FileZilla software (https://filezilla-project.org/) and then converted into fastq format by using NCBI sratoolkit (http://www.ncbi.nlm.nih.gov/Traces/sra/?view=software). The raw NGS reads of muscle from each fish species were de novo assembled into contigs by CLCBio software (http://www.clcbio.com/, Qiagen, CA, United States) with default parameters settings (k-mer = 23 and bubble size = 50). The complete mitogenome sequence can be elucidated from the raw NGS reads by performing de novo assembly and repeatedly mapping strategy as described in our previous paper (Shen et al., 2016).
2.2 Calculation of mitochondrial protein coding genes expression level
Initially, the full-length mitochondrial DNA sequences were downloaded from NCBI and imported into Geneious software (Biomatters, Ltd., Auckland, New Zealand). The 13 PCGs sequences for each fish species were identified by the BLAST search. The assembled PCG contigs were later exported from CLCBio software and imported into Geneious software to perform In-house BLAST (Liu, 2018). We used tBLASTN to search the potential contigs coding the 13 PCGs with an e-value cutoff setting at 1e-5. The potential contig was later compared by using BLASTX against the Refseq database to validate the gene annotation with an e-value cutoff 1e-5. For gene expression calculation, the raw reads were mapped to the assembled contigs by CLCBio software and the relative expressional level was calculated as RPKM (reads per kilobase of exon per million reads mapped).
2.3 Hierarchical Clustering, heatmap Generation, and PCA analysis
In order to compare the relative gene expression pattern of 13 PCGs in muscle tissues among diverse fish species, we used hierarchical clustering and PCA analysis approach. The output of clustering can help us to understand the relation between two fish species that based on the PCG expression levels. The relative contig number and RPKM values for each PCG in different fish species were summarized in excel format. To further mining gene expression patterns, we performed PCA analysis by using SIMCA-P software (Umetrics, Umeå, Sweden, https://umetrics.com/products/simca) to reduce high dimensional data down to lower dimensions and generate a 3D plot for data visualization according to default settings. Heatmap with hierarchical clustering was generated using R (R Core Development Team 2018, https://www.R-project.org) with superheat plugin.
3 Results and discussion
3.1 Overview of our study strategy
To compare the mitochondrial protein coding gene expression levels in the muscle from diverse fish species, we adapted a metatranscriptomic approach by using the strategy summarized in Fig. 1. First, muscle RNA transcriptomic data of 25 fish species from the NCBI Sequence Read Archive (SRA) database were downloaded. Among 25 fish species, transcriptomic data of muscle from two fish species Trichiurus lepturus (SRR3321882) and Harpadon nehereus (SRR3387959) have been published in our previous study (Zhang et al., 2016). Meanwhile, the rest of 23 fish species muscle transcriptomic data were procured from the NCBI SRA database. The fish species and its basic information that were used to perform meta-transcriptomic analysis were listed in Fig. 2 and Table 1. The next-generation sequencing (NGS) data used for mapping analysis size was around 3–15 Gb and the majority of those NGS data were generated by Illumina Hiseq 2000 platform as paired-end reads. Later, the complete mitogenome sequence of 25 fish species was downloaded from the NCBI database and 13 protein-coding genes (PCGs) for each fish species were extracted from it as bait (Cheng et al., 2017). The RNAseq raw reads information used to perform meta-transcriptomic analysis were summarized in Table 1. Afterward, the RNAseq short reads were mapped to 13 mitogenome PCGS for each fish species by using the mapping tool from a commercial software CLCBio. The relative expression levels of 13 PCGs were calculated and normalized as Reads per Kilobase Million mapped reads (RPKM) (Table 2).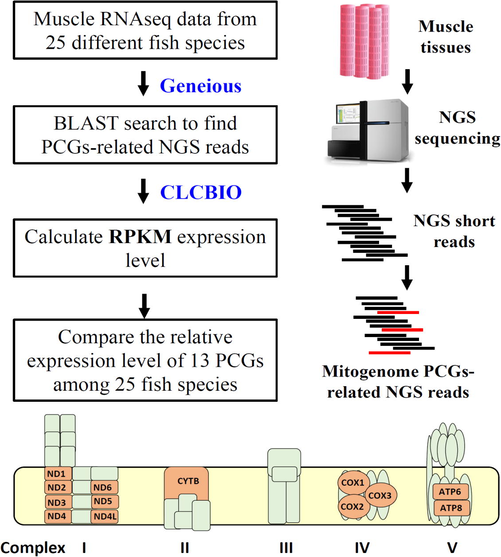
Summary of the analysis strategy and next-generation sequencing (NGS) data used in this study. The raw next-generation data were downloaded from the NCBI SRA database and two commercial software of Geneious and CLCBio were used to perform gene mapping and gene expression calculation (upper panel). The 13 protein-coding genes (PCGS) are major components of mitochondrial genes essential for oxidative phosphorylation (OXPHOS) reaction (bottom panel).
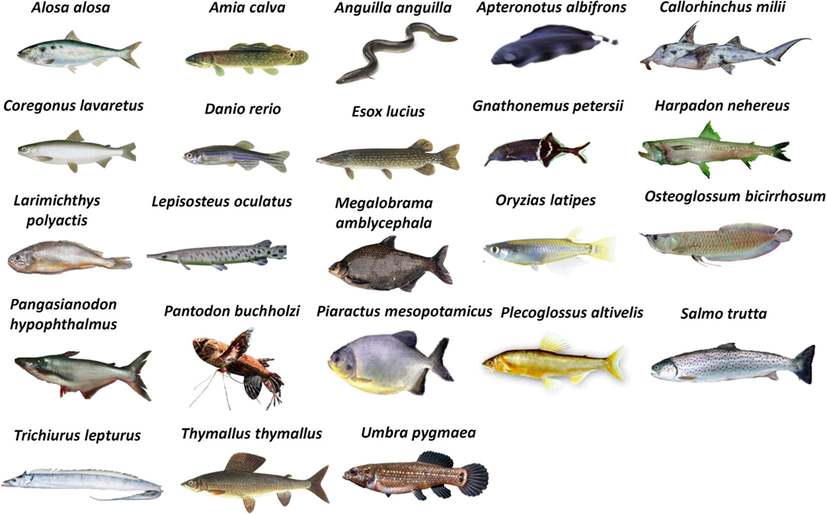
Twenty-five fish species used to perform gene expression profiling comparison. The species name and outlooking for all fish species used in this study were summarized.
Species name
Habitat
Transcriptome data
NGS bases (Gbp)
Sequencer
Mitogenome ID
Alosa alosa
SWa
SRR1532803
7.3
Illumina Hiseq 2000
NC_009575
Amia calva
FWb
SRR1524264
6.5
Illumina Hiseq 2000
NC_004742
Anguilla anguilla
FWb
SRR1532760
4.4
Illumina Hiseq 2000
NC_006531
Apteronotus albifrons
FWb
SRR1532750
5.8
Illumina Hiseq 2000
NC_004692
Callorhinchus milii
SWa
SRR514104
11.1
Illumina Genome Analyzer II
NC_014285
Coregonus lavaretus
FWb
SRR1533677
6.1
Illumina Hiseq 2000
NC_002646
Danio rerio
FWb
SRR1524241
6.8
Illumina Hiseq 2000
NC_002333
Esox lucius
FWb
SRR1533655
6.0
Illumina Hiseq 2000
NC_004593
Gnathonemus petersii
FWb
SRR1533701
7.0
Illumina Hiseq 2000
NC_012717
Harpadon nehereus
SWa
SRR3387959
6.9
NextSeq 500
NC_019645
Larimichthys polyactis
SWa
SRR3029231
10.8
Illumina Hiseq 2500
NC_013754
Lepisosteus oculatus
FWb
SRR1524253
5.9
Illumina Hiseq 2000
NC_004744
Megalobrama amblycephala
FWb
SRR1613325
3.6
Illumina Hiseq 2000
NC_010341
Oryzias latipes
FWb
SRR1524274
7.3
Illumina Hiseq 2000
NC_004387
Osteoglossum bicirrhosum
FWb
SRR1532792
5.3
Illumina Hiseq 2000
NC_003095
Pangasianodon hypophthalmus
FWb
SRR1533644
5.8
Illumina Hiseq 2000
NC_021752
Pantodon buchholzi
FWb
SRR1532771
4.3
Illumina Hiseq 2000
NC_003096
Paramisgurnus dabryanus
FWb
SRR1652342
10.8
Illumina Hiseq 2000
NC_023803
Perca fluviatilis
FWb
SRR1533689
7.8
Illumina Hiseq 2000
NC_026313
Piaractus mesopotamicus
FWb
SRR1056356
13.2
Illumina Hiseq 2000
NC_024940
Plecoglossus altivelis
FWb
SRR1533711
5.1
Illumina Hiseq 2000
NC_002734
Salmo trutta
FWb
SRR1532781
8.6
Illumina Hiseq 2000
NC_024032
Thymallus thymallus
FWb
SRR1533666
4.8
Illumina Hiseq 2000
NC_012928
Trichiurus lepturus
SWa
SRR3321882
15.8
NextSeq 500
NC_018791
Umbra pygmaea
FWb
SRR1533633
5.3
Illumina Hiseq 2000
NC_022456
Gene
ATP6
ATP8
COX1
COX2
COX3
CYTB
ND1
ND2
ND3
ND4
ND4L
ND5
ND6
Piaractus mesopotamicus
54,699
51,365
259,075
180,357
134,617
147,917
16,444
32,746
15,211
34,513
23,646
15,560
24,358
Danio rerio
100,623
12,268
280,608
123,039
190,582
86,933
22,838
32,868
17,302
27,851
6,816
20,009
39,004
Lepisosteus oculatus
67,606
0
259,874
342,973
95,725
70,925
29,643
60,846
0
25,114
19,462
9,103
11,137
Amia calva
82,754
0
170,310
383,940
312,065
57,928
38,703
18,055
0
13,663
0
15,365
0
Oryzias latipes
44,480
0
299,180
161,205
206,665
95,408
25,966
12,044
7,254
29,331
17,048
11,013
29,099
Apteronotus albifrons
151,136
0
165,426
502,108
74,062
22,617
73,238
36,866
0
51,389
21,723
10,559
12,359
Anguilla anguilla
50,838
41,336
331,311
251,246
115,004
91,374
0
13,291
0
25,143
0
7,540
0
Pantodon buchholzi
32,854
0
267,007
634,157
14,295
0
0
43,050
0
24,408
0
18,240.19
0
Salmo trutta
45,403
0
280,324
242,694
110,773
152,422
0
23,662
17,797
13,493
0
27,020
11,899
Osteoglossum bicirrhosum
153,894
0
294,078
152,335
218,179
46,128
27,074
37,774
0
28,583
0
0
0
Alosa alosa
47,013
40,957
323,851
258,899
137,323
86,436
9,410
4,390
13,144
14,947
15,445
12,492
13,181
Umbra pygmaea
33,658
0
339,586
99,805
292,847
30,328
11,789
21,936
0
33,293
0
18,720
0
Pangasianodon hypophthalmus
74,591
0
243,424
162,438
117,139
188,300
5,233
48,870
0
22,167
0
33,511
9,831
Esox lucius
90,232
0
267,817
222,643
195,982
40,593
15,779
73,260
0
22,280
0
0
88,417
Thymallus thymallus
44,984
45,788
213,262
222,643
166,585
175,285
47,337
21,978
0
33,421
0
8,366
29,472
Coregonus lavaretus
0
253,293
246,924
246,328
27,104
242,415
0
20,263
60,964
30,813
0
0
40,760
Perca fluviatilis
48,330
0
303,723
275,083
84,224
57,945
0
102,713
0
11,969
27,826
8,988
47,497
Gnathonemus petersii
80,226
0
254,654
208,156
78,527
66,032
126,839
26,217
19,626
0
46,123
48,339
13,121
Plecoglossus altivelis
61,342
0
403,529
156,862
71,176
122,577
7,172
6,654
0
5,064
0
1,901
6,698
Megalobrama amblycephala
122,221
123,442
184,018
214,688
195,316
84,927
36,146
46,872
18,960
37,515
24,699
23,600
35,816
Paramisgurnus dabryanus
37,974
0
276,319
131,562
314,736
102,439
13,320
24,808
0
18,781
0
7,062
24,879
Larimichthys polyactis
144,315
16,031
253,442
109,282
226,341
76,924
23,125
41,502
19,896
33,622
18,845
13,485
25,614
Trichiurus lepturus
146,184
17,695
167,435
189,762
224,981
107,482
63,129
42,153
24,372
17,259
7,290
21,998
49,081
Harpadon nehereus
31,215
15,875
432,080
147,910
166,415
37,322
5,295
15,637
6,586
2,671
2,341
1,195
0
Callorhinchus milii
63,565
0
55,741
104,868
0
355,962
105,676
69,543
41,527
73,728
0
31,782
83,292
3.2 Principal component analysis (PCA) based on fish species or PCGs
The Principal Component Analysis (PCA) is an analysis method that can be used to reduce the data complexity from high to low dimensions and perform multivariate analysis for Omics data (Saccenti and Timmerman, 2016; Wiklund, 2008). According to the principle, fish species with similar gene expression patterns will display a close PCA grouping relationship. Initially, we performed PCA grouping based on the fish species by combining all of the mitochondria PCGs expression levels from single a species (Fig. 3A). The result showed that 24 bony fish species were grouped together (pink color) while the cartilaginous fish species (Callorhinchus milii) was clearly separated by the bony fish species group to form an outgroup (yellow color). Later, PCA grouping based on all fish PCGs expression levels was performed (Fig. 3B). The result demonstrated three genes derived from OXPHOS complex IV, which were COX1, COX2, and COX3, were grouped together (yellow color) while the other PCGs, including ND1, ND2, ND3, ND4, ND4L, ND5, and ND6, from complex I, CYTB from complex II, and ATP6 and ATP8 from complex V were adequately connected into another group (pink color).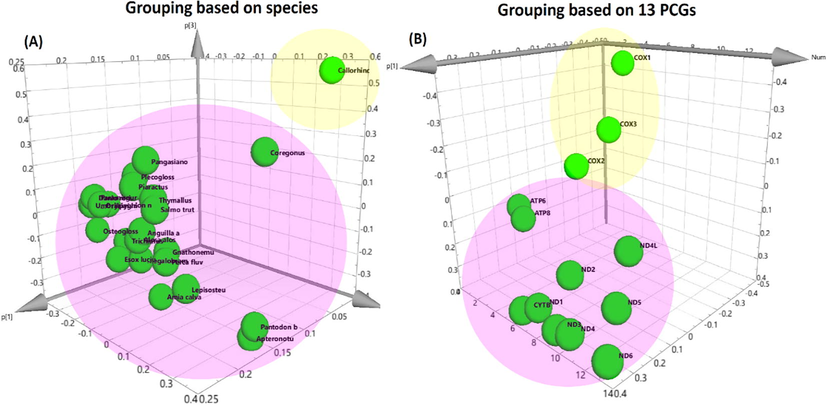
Three-dimensional principal component analysis (PCA) of 13 protein-coding genes (PCGs) in muscle tissues from 25 diverse fish species. (A) PCA grouping based on fish species. (B) PCA grouping based on 13 PCGs.
3.3 Heatmap gene clustering analysis for PCGs expression among 25 fish species
To gain better insight into the relationship analysis between 13 PCGs expression within diverse fish species, two-dimensional hierarchical clustering analysis was performed and a superheatmap for data visualization was generated (Fig. 4). Based on the 13 PCGs expression signatures, all of the teleost fish species were clustered together in a single lineage while the Australian ghost shark (Callorhinchus millii), a cartilaginous fish, displayed an outgroup relationship to other teleost fish. This clustering was primarily due to the relatively low expression level of the COX3 gene and the high expression level of CYTB genes of this fish compared to the teleost fish species tested in this study. Furthermore, we discovered all of the COX (COX1, COX2, and COX3) genes in OXPHOS complex IV were clustered in a single clade while the other 10 PCGs (ND, ATP, and CYTB genes) were grouped together in another lineage. Overall, similar grouping was observed from the PCA and hierarchical clustering results. By Omic analysis, it was intriguing to discover the relatively high expression level of COX genes in OXPHOS complex IV compared to the other 10 PCGs in bony fish, concluding COX genes as highly expressed transcript genes in 24 bony fish muscle studied (Fig. 4).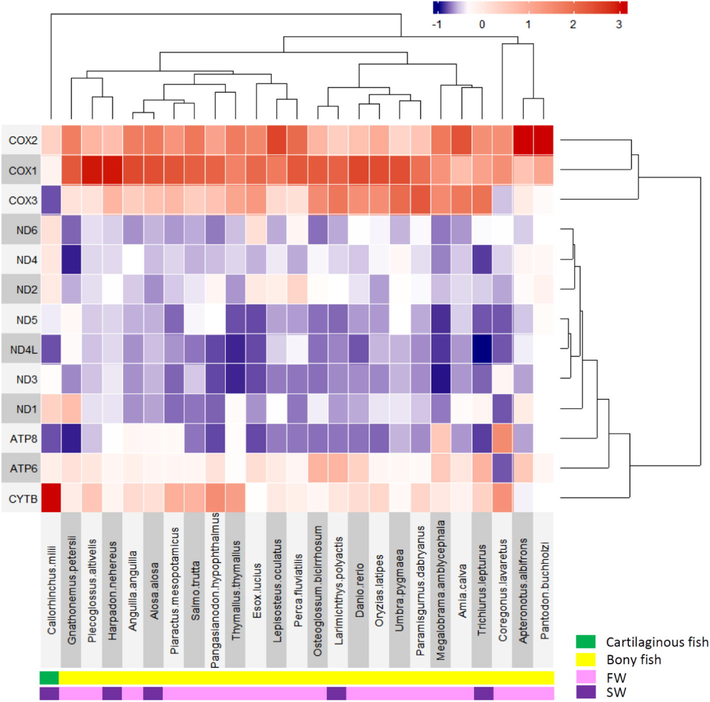
Heatmap and a two-dimensional hierarchical clustering of 13 protein-coding genes (PCGs) in muscle tissues. The X-axis represents fish species and Y-axis represents 13 PCGs. The relative gene expression levels are presented as a heatmap with red color for high expression and blue color for low expression. In the bottom panel, four-color codes are used to show fish phylogenetic position (bony or cartilaginous fish) and living habitat (FW or SW). In this study, the Australian ghost shark (Callorhinchus milii) belonging to the subclass Holocephali (chimaera) is the only cartilaginous fish (Chondrichthyes) used in this study. FW indicates freshwater and SW indicates seawater.
In addition, according to the heatmap result, the PCG genes derived from the same OXPHOS complex were grouped closer to each other and showed a co-expression pattern. This result is consistent with previously published results that showed the transcriptional co-expression and the co-regulation relationship of genes coding for components of the oxidative phosphorylation (OXPHOS) system in plant (Gonzalez et al., 2007) and mammals (van Waveren and Moraes, 2008). Furthermore, this grouping relationship suggested that the 13 PCGs expression pattern was not co-related to their living habitat (freshwater VS seawater, displayed by pink and purple color codes in the bottom panel of Fig. 4), but instead, it was correlated to their phylogenetic position (bony VS cartilaginous fish, displayed by green and yellow color codes in the bottom panel of Fig. 4). For example, the Australian ghost shark displayed a relatively low expression level of COX3 and high expression level of CYTB genes while all of the teleost fish species tested displayed a relatively high COX1/2/3 gene expression levels in muscle tissues. However, it is also worth noting that our current finding results are based on only one example of a cartilaginous fish that was accessible in SRA database. Future studies by constructing more additional cartilaginous fish muscle transcriptomes are considered necessary to get a more solid conclusion.
4 Conclusion
In the current study, we performed a metatranscriptomic analysis of fish muscle. From the results, we discovered interesting findings that showed the co-expressional pattern of OXPHOS genes in bony fish. To the best of our knowledge, this is the first study that discovered the bony fish OXPHOS genes co-expressional pattern in the muscle by performing a metatranscriptomic analysis. From the grouping based on the fish species, the Australian ghost shark (Callorhinchus millii), a cartilaginous fish, displayed a different group to other teleost fish while all of the teleost fish species were grouped together in a single cluster. Meanwhile, from the grouping based on the 13 PCGs, we discovered all of the COX (COX1, COX2, and COX3) genes in OXPHOS complex IV were clustered in a single clade leaving the other 10 PCGs (ND, ATP, and CYTB genes) in another clade. Taken together, this grouping relationship suggested that the 13 PCGs expression pattern was rather correlated to their phylogenetic position than to their living habitat. This approach opens a great avenue to explore the expression pattern of 13 PCGs in other fish or animal species. For example, how it will be when the muscle tissue derived from fish, amphibian, bird, and mammals were compared? With the great progress on transcriptomic data deposited to the NCBI SRA database, we believed more animal muscle transcriptomic data would be available in the coming future for scientists to validate this hypothesis in the coming future.
Acknowledgment
This work was supported by the Public Science and Technology Research Funds Projects of Ocean under contract No. 201305027.
Declaration of Competing Interest
The authors declare that they have no known competing financial interests or personal relationships that could have appeared to influence the work reported in this paper.
References
- Genetics and evolution of aquatic organisms. London: Chapman & Hall; 1994.
- Waste-to-energy policy in China: A national strategy for management of domestic energy reserves. Energy Sources Part B. 2017;12:925-929.
- [Google Scholar]
- Application of LSSVM algorithm for estimating higher heating value of biomass based on ultimate analysis. Energy Sources Part A. 2018;40:709-715.
- [Google Scholar]
- Transcriptional coordination of the biogenesis of the oxidative phosphorylation machinery in plants. Plant J.. 2007;51:105-116.
- [Google Scholar]
- Fish physiology: Muscle development and growth. London: Academic Press; 2000.
- Quality and quality changes in fresh fish. Rome: FAO; 1995.
- Phylogeny and biogeography of highly diverged freshwater fish species (leuciscinae, cyprinidae, teleostei) inferred from mitochondrial genome analysis. Gene. 2013;514:112-124.
- [Google Scholar]
- Mitofish and mitoannotator: A mitochondrial genome database of fish with an accurate and automatic annotation pipeline. Mol. Biol. Evol.. 2013;30:2531-2540.
- [Google Scholar]
- Molecular systematics of fishes. London: Academic Press; 1997.
- Economic analysis of energy production from coal/biomass upgrading; Part 1: Hydrogen production. Energy Sources Part B. 2018;13:132-136.
- [Google Scholar]
- Mitochondrial mechanisms of cold adaptation in cod (gadus morhua l.) populations from different climatic zones. J. Exp. Biol.. 2006;209:2462-2471.
- [Google Scholar]
- Mitogenomic exploration of higher teleostean phylogenies: A case study for moderate-scale evolutionary genomics with 38 newly determined complete mitochondrial DNA sequences. Mol. Biol. Evol.. 2001;18:1993-2009.
- [Google Scholar]
- Higher and lower-level relationships of the deep-sea fish order alepocephaliformes (teleostei: Otocephala) inferred from whole mitogenome sequences. Biol. J. Linn. Soc.. 2009;98:923-936.
- [Google Scholar]
- The complete mitochondrial genome of two recently derived species of the fish genus nannoperca (perciformes, percichthyidae) Mol. Biol. Rep.. 2012;39:2767-2772.
- [Google Scholar]
- Approaches to sample size determination for multivariate data: Applications to pca and pls-da of omics data. J. Proteome Res.. 2016;15:2379-2393.
- [Google Scholar]
- Mitogenomic evolution and interrelationships of the cypriniformes (actinopterygii: Ostariophysi): The first evidence toward resolution of higher-level relationships of the world’s largest freshwater fish clade based on 59 whole mitogenome sequences. J. Mol. Evol.. 2006;63:826-841.
- [Google Scholar]
- Mitochondrial genomes of parasitic arthropods: Implications for studies of population genetics and evolution. Parasitology. 2007;134:153-167.
- [Google Scholar]
- Next generation sequencing yields the complete mitochondrial genome of the flathead mullet, mugil cephalus cryptic species nwp2 (teleostei: Mugilidae) Mitochondrial DNA Part A. 2016;27:1758-1759.
- [Google Scholar]
- Transcriptional co-expression and co-regulation of genes coding for components of the oxidative phosphorylation system. BMC Genomics. 2008;9:18.
- [CrossRef] [Google Scholar]
- DNA barcoding Australia’s fish species. Philos. Trans. R. Soc., Series B. 2005;360:1847-1857.
- [Google Scholar]
- Multivariate data analysis for omics. Umeā: Umetrics; 2008.
- Identification of myogenic regulatory genes in the muscle transcriptome of beltfish (trichiurus lepturus): A major commercial marine fish species with robust swimming ability. Genomics Data.. 2016;8:81-84.
- [Google Scholar]


