

Translate this page into:
Mechanistic analysis for identifying the anti-diabetic effects of Cholic acid-loaded chitosan nanoparticles: An in vitro approach
⁎Corresponding authors. shiyijun@126.com (Yijun Shi), joeantonyjacob@gmail.com (Joe Antony Jacob) joeantonyjacob@hotmail.com (Joe Antony Jacob)
-
Received: ,
Accepted: ,
This article was originally published by Elsevier and was migrated to Scientific Scholar after the change of Publisher.
Abstract
The identification of novel therapeutic agents using nanomedicine is critical in the fight against diabetes mellitus (DM). Cholic acid (CA) has shown potential in diabetes management, but its effectiveness is limited by poor solubility and stability. To overcome these challenges, CA was encapsulated in chitosan nanoparticles (CACNPs). The CACNPs had a negative zeta potential (ZP) of −13.6 ± 5.81 mV, which is an indication of good stability and potential for enhanced uptake by diseased cells. The average particle size (PS) measured by dynamic light scattering (DLS) was 169.8 ± 84.3 nm. The polydispersity index (PDI) was 0.220, indicating uniform particle size distribution. The drug loading capacity (DL%) of the CACNPs was 60.96 ± 0.9 %, whereas, the entrapment efficiency (EE%) was 69.19 ± 1.02 %. The MTT assay on 3 T3-L1 cells revealed a concentration-dependent effect on cell viability, with an IC50 value of 766.0 ± 0.09 µg/ml. Furthermore, CACNPs demonstrated dose-dependent enhancement of glucose uptake in differentiated adipocytes, while at 500 µg/ml, they inhibited adipocyte differentiation, suggesting a potential role in adipogenesis inhibition. Quantitative PCR (qPCR) indicated positive modulation of glucose metabolism-related genes (PI3K, GLUT4, PPARg) upon treatment with CACNPs. These findings suggest that CACNPs could serve as a novel inhibitor of adipocyte differentiation and may influence key pathways in glucose metabolism, making them promising candidates for the management of DM.
Keywords
Cholic acid
Chitosan Nanoparticles
Diabetes mellitus
3T3-L1
qPCR

1 Introduction
DM is an epidemic, which has gradually inclined over the past two decades with regard to causing mortality across China (Kharroubi and Darwish, 2015, Wang et al., 2022). Critically, over the past decade, the median age has reduced with higher prevalence as a consequence of physical inactivity, elevated consumption of red meat and a considerable volume of population being obese (Wang et al., 2021). The global statistics is staggering with 451 million patients in 2017 which is projected to a mammoth 693 million in 2045.
Nanomedicine remains critical in the management of DM and in overall improvement or patient care, as several pilot-scale clinical studies have been conducted in humans. It is also used as a sensor for monitoring glucose levels and in development of vaccines for DM (Veiseh et al., 2015). CA is a bile acid that is secreted by liver using cholesterol and conjugated to glycine or taurine for assisting in the process of digestion In this pursuit, chitosan nanoparticles (CNPs) have been used in administering drugs for DM as they pose high bioavailability in vivo with enhanced therapeutic efficacy for drugs they carry (Priyanka et al., 2022). Furthermore, chitosan as a polymer with muco-adhesive properties can aid in effective differentiating and protecting effects on pancreatic cells thereby causing a drop in glucose levels and improvement in lipid metabolism (El-Dakroury et al., 2023). Since bile acids have been identified to possess beneficial effects in studies performed for managing DM, the present study was hypothesized at using CACNPs for decreasing triglyceride accumulation and improving glucose uptake and utilization. We believe that CA may possess anti-diabetic effects in vitro and this may be enhanced by controlled delivery using CNPs. Hence, we have tested our hypothesis by synthesizing CNPs and loading them with CA besides testing them for their anti-diabetic effects in vitro mechanistically. In this regard, in this research trial proposed in vitro, the beneficial effects of CACNPs on 3 T3-L1 adipocytes will be studied adopting a mechanistic approach using real-time PCR internationally for the first time.
2 Materials and method
All chemicals used for the experiment were of analytical grade (SRL Chemicals Pvt. Ltd., Mumbai, India). Chitosan powder sourced from shrimp shells was purchased with an appearance of white to pale yellow, with solubility in 1 % acetic acid, degree of deacetylation of 90 % and a viscosity of 150–500 m.Pas at 20 °C. Sodium Tripolyphosphate Anhydrous (sTPP) (57–59 % and pH 9.1–10.1) and CA (98 %) were purchased in extrapure form.
2.1 Preparation and characterization of CACNPs
Chitosan powder (2 mg/mL) was dissolved in 2 % glacial acetic acid (prepared with normal saline (0.9 % w/v)) and 50 mM NaCl and stirred for 1 hr at 350 rpm. Later, CA was added (2 mg/mL) and stirred again for 1 hr. Subsequently, sTPP solution (2 mg/mL) was added at 2:1 ratio of chitosan solution:sTPP and stirred for another 1 hr. All chemicals were used for synthesis in powder form. The final solution was centrifuged at 10000 rpm for 15 mins and a pellet obtained with CACNPs was washed several times with normal saline (0.9 % w/v). The same method was followed for preparation of CNPs without CA (pCNPs) (Calvo et al., 1997, Siva et al., 2022). The UV–vis analysis of CACNPs was performed using LABMAN Single Beam UV–Vis Spectrophotometer (LMSP-UV1200). PS and PDI was calculated using Particulate Systems model Nano Plus instrument. ZP was measured using Zetasizer Nano ZS, Malvern Panalytical, Malvern, UK. The morphology was measured using JEM-2100 Plus TEM, JEOL Ltd., Japan. All these physicochemical analyses of CACNPs were conducted across different laboratories in India.
2.2 In vitro drug loading and release assay
2.2.1 Drug loading efficacy
The extent of unconjugated CA was calculated from the supernatant by analyzing its λ-max value (802 nm) and consequent absorbance values. The calibration curve was derived to determine the concentration of CA. The EE% and DL% was determined using the following formulae
2.2.2 Drug release assay
The in vitro drug release assay used dialysis membrane sacs, with CACNPs prepared as before, utilizing 2 mg/mL CA as the drug and normal saline as the medium. After centrifugation, the pellet and supernatant were separated. Supernatant absorbance measured at 802 nm. The pellet was placed in dialysis bags, stirred at 180 rpm and room temperature. Supernatant samples were collected at several intervals till 24 hrs. Calibration curves were used to assess drug release (Kasthuri and Rajendiran, 2009). The drug release assay was conducted with the medium volume of 37.5 ml (25 ml of chitosan solution and 12.5 ml of sTPP solution in the ratio of 2:1), at room temperature with 2.5 ml of the final pellet (containing the CACNPs) in the dialysis bag. As per the drug released in the supernatant (44.868 %) at the end of synthesis, the volume of drug in the final pellet was 1.102 mg/mL (55.132 %).
2.3 Cell culture and MTT assay for biocompatibility
The embryonic fibroblast cell line (3 T3-L1) was used for cell culture and standard MTT assay. 96 well plates were loaded with the cells at 1 × 10⁴ cells/well in DMEM media. Standard antibiotics and nutrients were provided and incubated at 37˚C with 5 % CO2. The cells were treated with different concentrations of CACNPs (100–500 µg/mL) and incubated for 24 hrs. Later, the medium was aspirated; MTT was added and incubated under standard conditions for 4 hrs. Now, MTT was discarded and the absorbance was read at 570 nm (Florento et al., 2012).
2.4 Adipocyte differentiation and oil red staining
3 T3-L1 preadipocytes were seeded at 3 × 10⁴ cells/well and incubated at 37 °C with 5 % CO2. After 24 hrs, the cells were transferred to DMEM containing 10 % FBS, 0.5 mM of DMI (3-isobutyl-1-methyl xanthine), 1 μM dexamethasone and 1.7 μM insulin and incubated at 37 °C with 5 % CO2 for two days. Further, DMEM was loaded with CACNPs, 10 % FBS and 1.7 μM insulin and incubated for two days. Further, DMEM medium with 10 % FBS containing CACNPs (500 µg/mL) was supplemented every two days for eight days. Later, the lipid content was analyzed using oil red staining. The cells were fixed with 4 % paraformaldehyde for 60 mins. The cells were stained well along with 0.3 % Oil-Red-O in 60 % isopropanol for 60 mins, picturized using Optika CCD camera, the stain was eluted and analyzed at 490 nm using LMSP-UV1200 spectrophotometer (Balakrishnan et al., 2018).
2.5 Adipocyte differentiation and glucose uptake study
3 T3-L1 pre-adipocytes were seeded at 3 × 10⁴ cells/well and after 24 hrs of standard culture condition. The growth media was shifted to DMEM containing 10 % FBS, 0.5 mM of DMI (3-isobutyl-1-methyl xanthine), 1 μM dexamethasone and 1.7 μM insulin. After incubating for 2 days, the post-differentiation media was added with CACNPs (250 and 500 µg/mL). Glucose uptake assay was performed using 4-aminoantipyrine and N-ethyl-N-sulfopropyl- M−toluidine as the substrates and GOPOD as the enzyme after durations of 12 and 22 hrs. Residual glucose was measured at 350 nm using the UV–Vis spectrophotometer (LMSP-UV1200). The percentage of glucose was obtained as follows
Where, A1 is the absorbance of the mixed-glucose, DMEM-supplemented control, and A2 is the absorbance of the sample group (Chen et al., 2023).
2.6 RNA isolation and quantitative PCR
qPCR was conducted using Rotor-Gene Q 2PLEX HRM Real-Time PCR system (Qiagen) using 2(−Delta Delta C(T)) method. total RNA was extracted using TRIzol reagent (Ambion, USA). Reverse transcription was performed using PrimeScript™ 1st strand cDNA Synthesis Kit (TAKARA BIO INC). The reaction conditions were maintained at 3 μg of total RNA samples, 1 μL of Oligo dT Primer (50 μM), 1 μL of dNTP Mixture (10 mM each), 4 μL of 5X PrimeScript Buffer, 0.5 μL of RNase Inhibitor (40 U/μl), 1 μl of PrimeScript RTase (200 U/μl) and were mixed with 20 μL of DEPC treated water. The thermal profile was 42 °C for 60 mins and termination of the reaction at 95 °C for 5 mins and SYBR® Select Master Mix (Applied Biosystems) was used. The amplification protocol involved enzyme activation at 50 °C for 2 mins, denaturation at 95 °C for 2 mins, followed by 40 cycles at 95 °C for 15 secs and 60 °C for 60 secs (Kumar et al., 2019).
2.7 Hemocompatibility assay
Freshly drawn blood samples from sheep were collected and the RBCs were separated by centrifugation at 3000 rpm for 5 mins. The supernatant was aspirated, the RBCs were washed using PBS and centrifuged again under the same conditions until it turned clear. The pellet was then diluted to 1:100 using PBS and 1 % erythrocyte solution was treated with CACNPs. 10 % Triton X-100 was used as a control. The mixture was incubated 37 °C for 60 mins and centrifuged as above. The final supernatant was collected and the absorbance was read at 450 nm using an ELISA reader (Jiang et al., 2023). The haemolytic activity was assessed using the formula
3 Results
3.1 Characterization of CACNPs
According to the UV–Vis analysis, the CACNPs showed an absorption maximum at 350 nm in comparison to 310 nm for CNPs with no drug (pCNPs) and 380 nm for CA (Fig. 1). The pCNPs had a ZP of + 12.4 ± 3.62 mV, whereas, the ZP of CACNPs was −13.6 ± 5.81 mV. Pertaining to stability, the CACNPs showed the above mentioned ZP values after one month of preparation. After a period of six months, the zeta potential value was −1.60 ± 2.91 mV. The stability study was the same as for measuring the ZP of pCNPs and CACNPs. Yet, the CACNPs were stored at the temperature of 4 °C and humidity of 30 to 50 % and ZP was measured post-storage at the mentioned conditions after 6 months (Fig. 2). The particle size of CACNPs was 169.8 ± 84.3 nm, whereas, the PDI was 0.220 (Fig. 3). As per TEM analysis, the CACNPs were predominantly spheres and cubes with an average particle size of 32.35 nm (Fig. 4).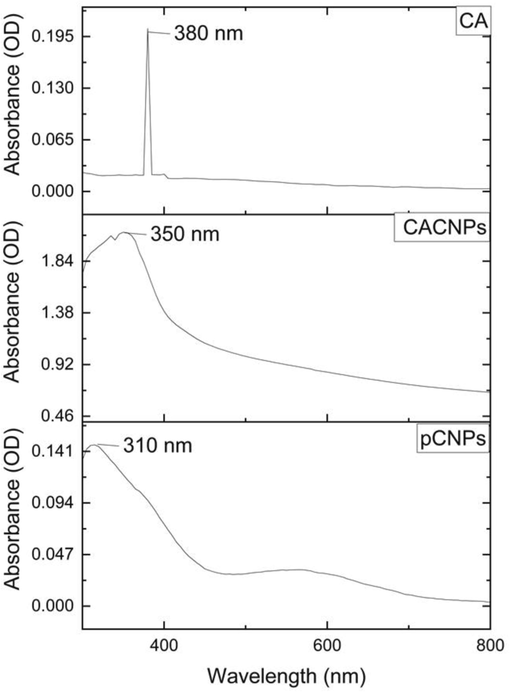
The UV–Vis spectra of CA, CACNPs and pCNPs.
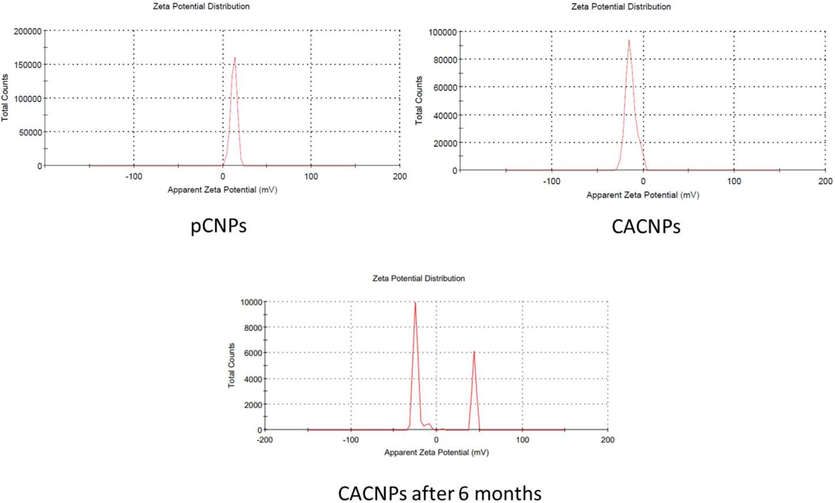
Zeta potential analysis of the pCNPs and CACNPs.
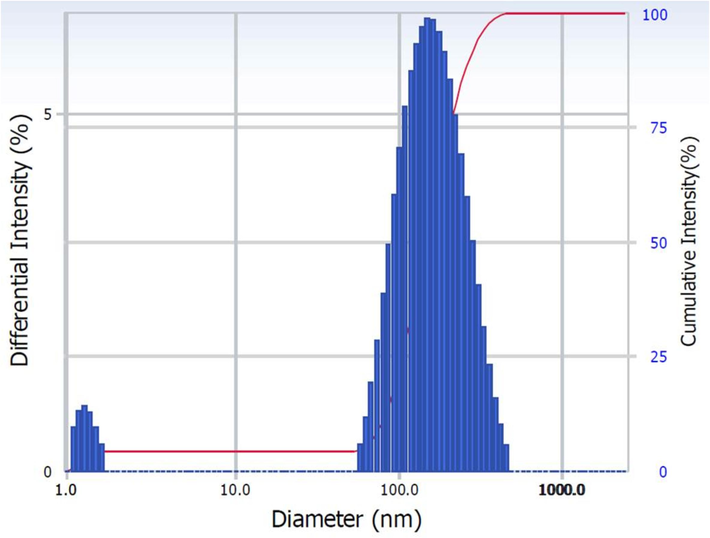
Particle size of the CACNPs as elucidated by DLS.
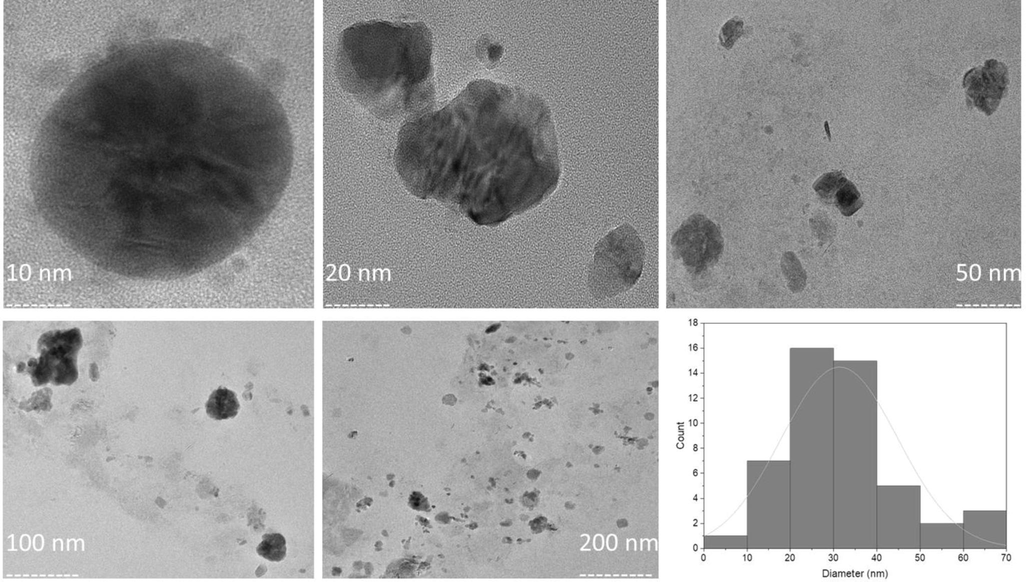
Morphology and histogram for particle size of CACNPs using TEM.
3.2 In vitro drug loading and drug release assay
The EE% and DL% of CACNPs was 69.19 ± 1.02 % and 60.96 ± 0.9 %. Approximately 45 % of CA was released as the free drug before conducting the drug release study. According to the drug release, an initial ‘burst release’ was observed at pH 5.5, the point from which there was a sustained release of the bile salt at 24 hrs. The drug release at different time points at pH 5.5 and 7.4 are 67.56 % and 9.73 % (1 hr), 74.15 % and 15.59 % (2 hrs), 79.27 % and 20.71 % (3 hrs), 81.47 % and 26.57 % (4 hrs), 81.47 % and 30.22 % (5 hrs) and 82.93 % and 39.01 % (24 hrs). The rapid drug release at pH 5.5 (7.5-fold at 1 hr and 2-fold after 24 hrs) compared to physiological pH 7.4 could mean that the drug release was due to polymer erosion. The standard curve for CA and the drug release profile are presented in Fig. 5.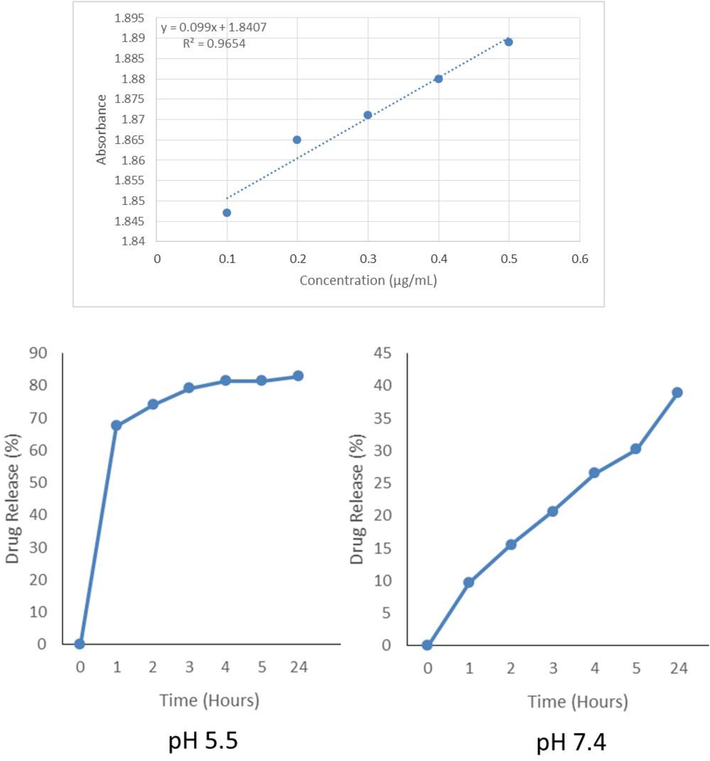
The standard curve for the evaluation of CA and the drug release profile at pH 5.5 and pH 7.4.
3.3 Cytotoxicity and biocompatibility testing on 3 T3-L1 cell line
The cytotoxicity of the CACNPs was assessed using the MTT (3-(4,5-dimethylthiazol-2-yl)-2,5-diphenyltetrazolium bromide) assay, a widely accepted colorimetric method for determining cell viability and metabolic activity. The raw data obtained from the MTT assay were converted to the percentage of cell viability, and the mean, standard deviation, and standard error were calculated for each tested concentration. The results revealed a concentration-dependent effect of the CACNPs on cell viability. At the highest tested concentration of 500 µg/ml, the cell viability was slightly reduced to 95.07 ± 2.31 % indicating mild or very limited cytotoxicity. However, at lower concentrations (400 µg/ml, 300 µg/ml, 200 µg/ml, and 100 µg/ml), the cell viability remained high, ranging from 98.59 ± 0.54 % to 99.65 ± 0.54 % suggesting that the compound did not exert significant cytotoxic effects at these concentrations (Table 1A). Whereas, the negative control, representing untreated cells, exhibited a normal cell viability of 100 %, confirming the reliability of the experimental procedures. The positive control, known to induce cytotoxicity, showed a substantially decreased cell viability of 58.10 % (Fig. 6A (I)). Further the IC50 value was measured from % Inhibition vs Concentration graph, which was found to be 766.0 ± 0.09 µg/ml (Fig. 6A (II)). The microscopic observations are presented in (Fig. 6B).
Tested
concentration(µg/ml)
% of Cell Viability
Mean
Standard
Error
500
95.07
97.89
93.31
95.42
1.33
400
98.59
98.94
99.65
99.06
0.31
300
99.65
99.30
100
99.77
0.31
200
98.59
99.65
100
100
1.04
100
98.94
100
100
100
0.93
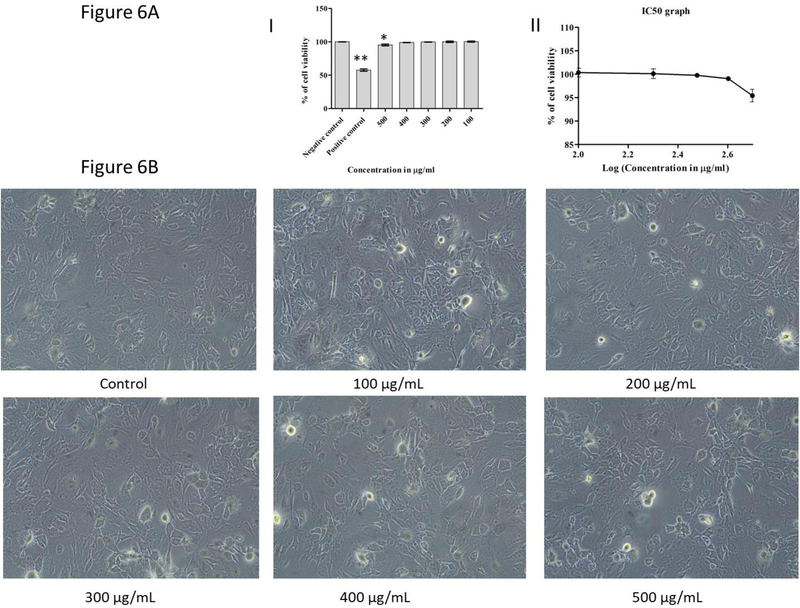
(A) Cytotoxic observations in dose dependent manner. (I) Bar graph indicating % of cell viability for corresponding doses of CACNPs. The results were expressed as mean ± SD (** p < 0.01, * p < 0.05). (II) IC50 graph plotted using MTT assay. (B) Microscopic observations of cytotoxicity of CACNPs.
3.4 Differentiation of 3 T3-L1 preadipocytes to adipocytes, treatment and glucose uptake study
The glucose uptake values obtained for the undifferentiated and differentiated control groups at 12 hrs and 22 hrs were consistent (Table 1B and Table 1C). CACNPs at 250 µg/ml resulted in a reduced OD of 0.311 ± 0.01 compared to the undifferentiated control group. Similarly, exposure to CACNPs at 500 µg/ml further decreased the OD to 0.273 ± 0.02. The control group, which did not get exposed to CACNPs, exhibited a higher OD value of 0.446 ± 0.03 (Table 1B). At 12 hrs, glucose uptake in undifferentiated and differentiated control groups was approximately 23.33 % and 25.33 %, respectively. However, at 22 hrs, the percentage of glucose uptake in the differentiated control group increased to approximately 49.63 %. Interestingly, treatment with CACNPs at 250 µg/ml led to a slight increase in glucose uptake (50.59 %), while treatment with CACNPs at 500 µg/ml resulted in a more substantial enhancement (55.63 %) compared to the differentiated control. However, CACNPs treatment exhibited a dose-dependent effect on glucose uptake in differentiated adipocytes at 22 hrs, with higher concentrations (500 µg/ml) (Table 1C, Fig. 7).
Samples (µg/ml)
Glucose uptake percentage
Mean
SE
12 hrs
Undifferentiated control
0.345
0.328
0.337
0.34
0.00
Differentiated control
0.339
0.337
0.332
0.34
0.00
CACNPs (250)
0.311
0.317
0.325
0.32
0.00
CACNPs (500)
0.273
0.3168
0.294
0.29
0.01
Media
0.446
0.483
0.426
0.45
0.02
22 hrs
Undifferentiated control
0.345
0.328
0.337
0.34
0.00
Differentiated control
0.228
0.227
0.225
0.23
0.00
CACNPs (250)
0.231
0.227
0.209
0.22
0.01
CACNPs (500)
0.223
0.198
0.178
0.20
0.01
Samples (µg/ml)
% glucose uptake
Mean
SE
12 hrs
Undifferentiated control
23.33
27.11
25.11
25.19
1.09
Differentiated control
24.67
25.11
26.22
25.33
0.46
CACNPs (250)
30.89
29.56
27.78
29.41
0.90
CACNPs (500)
39.33
29.60
34.67
34.53
2.81
22 hrs
Undifferentiated control
23.33
27.11
25.11
25.19
1.09
Differentiated control
49.33
49.56
50.00
49.63
0.20
CACNPs (250)
48.67
49.56
53.56
50.59
1.50
CACNPs (500)
50.44
56.00
60.44
55.63
2.89
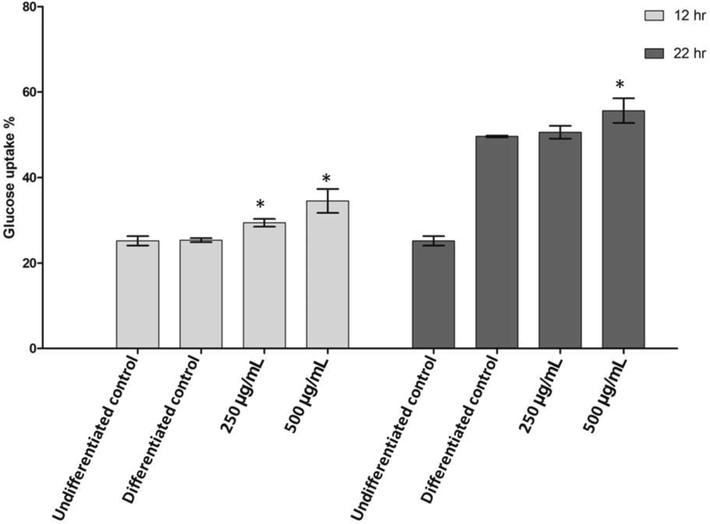
Glucose uptake by differentiated 3 T3-L1 cells along with CACNPs treatment at 12 and 22 hrs. The results were expressed as mean ± SD (* p < 0.05).
3.5 Adipocyte differentiation and oil red staining
Adipocyte differentiation was induced in 3 T3-L1 preadipocytes following the protocol of Balakrishnan et al., (Balakrishnan et al., 2018). The differentiated control group showed a significant increase in intracellular lipid content (0.403 ± 0.026 absorbance at 490 nm, (mean = 0.378)) compared to the undifferentiated control group (0.127 ± 0.012 absorbance at 490 nm, (mean = 0.116)), confirming successful induction of adipocyte differentiation. Further, when the effect of CACNPs (500 µg/ml) on adipocyte differentiation was assessed, there was an increase intracellular lipid content (0.436 ± 0.006 absorbance at 490 nm) compared to the differentiated control group (Fig. 8A). The lipid accumulation on seeded 3 T3-L1 cells were further visualized at 20X magnification, which in turn supports the data by red staining of lipid droplets in the cytoplasm of differentiated and CACNPs-induced cells (Fig. 8B).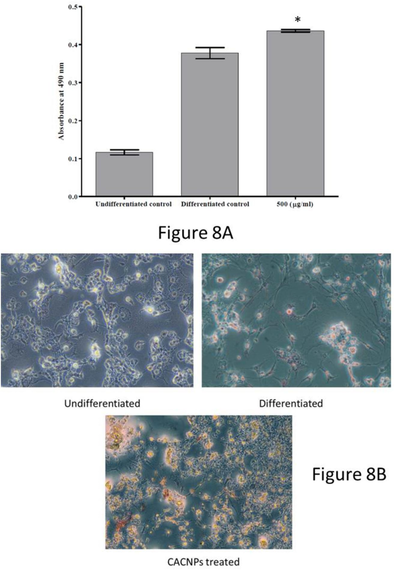
The absorbance at 490 nm for attenuation of adipocytes by undifferentiated, differentiated and CACNPs supplemented 3 T3-L1 cells. The results were expressed as mean ± SD (* p < 0.05). (B) Microscopic view of adipocytes stained red by the lipids in the cytoplasm (20X magnification).
3.6 qPCR for identification of insulin signalling
In our investigation, we assessed the impact of CACNPs on the PI3K, GLUT4, and PPARg mRNA expression levels in the 3T3L1 cell line, which are intricately linked to glucose metabolism in adipose tissues. The findings demonstrated a positive modulation in the expression of all three proteins following the introduction of CACNPs. Notably, Glut-4, a crucial indicator of diabetes within cells, exhibited a remarkable overexpression of up to 0.5 fold in the presence of CACNPs compared to differentiated cells, emphasizing the potential positive influence of CACNPs on insulin-dependent glucose transport. PPAR isoforms, particularly PPARγ, known for their diverse effects on cell growth, differentiation, and metabolism, exhibited increased expression in CACNPs-treated cell lines compared to both differentiated and undifferentiated control cells. The expressions of these genes are depicted in Fig. 9A.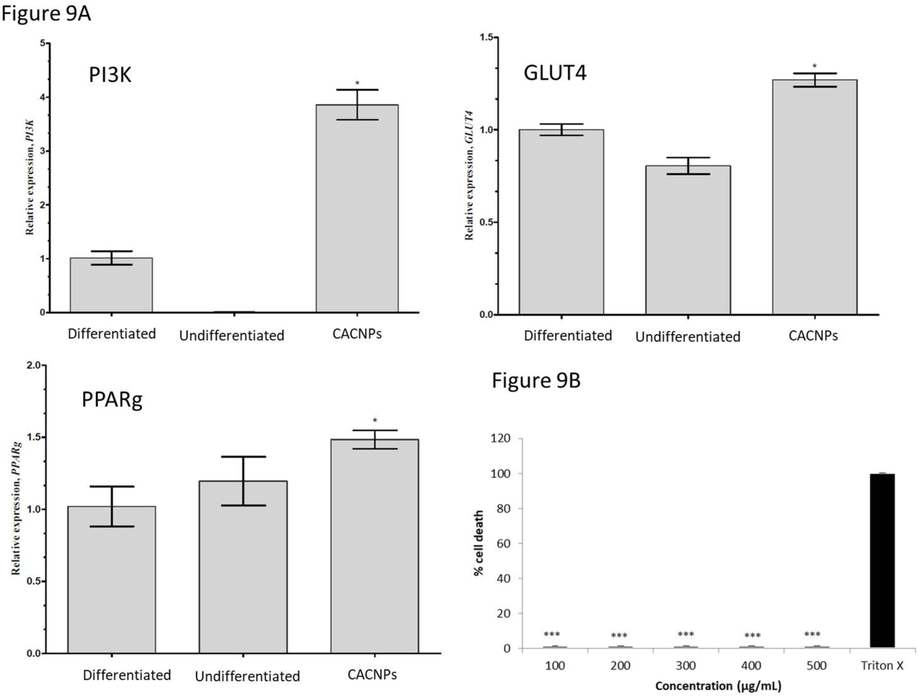
(A) Relative qPCR analysis of PI3K, GLUT4 and PPARg mRNA expressions in 3T3L1 cells. Treatment group shows an increase in relative expression of the genes after treatment with CACNPs compared to the differentiated group (* p < 0.05). (B) Hemocompatibility of CACNPs. The results were expressed as mean ± SD (*** p > 0.001).
3.7 Hemocompatibility assay
The treatment of CACNPs showed no hemolytic effects (1.58 %) even at the maximum tested dose of 500 µg/mL in comparison to the 100 % lytic effect of Triton X 100 (10 %) (Fig. 9B).
4 Discussion
This study aims to explore CACNPs' physicochemical features, drug loading efficiency, biocompatibility, and effects on 3 T3-L1 pre-adipocyte differentiation and glucose metabolism.
The changes in absorption maximum and the respective shift in peaks of CA, pCNPs and CACNPs at 380 nm (characteristic for CA), 310 nm (characteristic for CNPs) and 350 nm could be possibly attributed to the encapsulation of the CNPs with a drug (CA in this case) (Ganesan et al., 2022). The change in charge of the drug-loaded CNPs from positive to negative implies a drug-induced surface modification. Drug-entrapped CNPs are negatively charged, while unloaded ones are positively charged (Riezk et al., 2020). Consistent with this interpretation, the pCNPs in our report had a ZP of + 12.4 ± 3.62 mV, whereas, the CACNPs had a ZP of −13.6 ± 5.81 mV. Also, it is important that nanomaterials with ZP values between −10 and + 10 mV are neutral, while those between −30 and + 30 mV are substantially anionic and cationic (Clogston and Patri, 2011). The results show that pCNPs are cationic due to chitosan, while CACNPs are anionic due to the formulation being entrapped with the bile component CA (Singh and Chauhan, 2022). ZP of CACNPs was stable after one month of preparation. However, the six-month zeta potential drop (−1.60 mV) may imply decline in stability. Since the ZP in this region indicates very low or no stability, storage and use over time of CACNPs must be explored by further studies (Liu et al., 2022). The PDI showed that CACNPs were moderately polydisperse and the average size below 200 nm allows them to extravasate circulation and gets internalized into target cells by clathrin mediated endocytosis (Mazumdar et al., 2021). The mean PS as per TEM was 32.35 nm. TEM detects PS locally, while DLS measures light intensity over the study area. Thus, biological fluid research will benefit from PS analysis by DLS (Kaasalainen et al., 2017).
The EE% and DL% of CACNPs at 69.19 ± 1.02 % and 60.96 ± 0.9 % proved the reliability and efficiency of the experimental setup (Thanawuth et al., 2023). Fast, continuous medication delivery at 24 hrs was observed to be 82.93 % of the drug at lysosomal pH 5.5, whereas, a comparatively sustained release of 39.01 % was observed at physiological pH 7.4. The drug's surface attachment, production method, polymer breakdown due to chain breaking and gradual polymer erosion, in addition to drug-carrier interface contact, which releases much cargo, may cause rapid initial release (Nallamuthu et al., 2015). Surface-associated drug-CNPs connection may enhance the rapid release. The second reason may be chain scission polymer degradation. Final reason may be polymer erosion, which loses bulk cargo (Fu and Kao, 2010). The enhanced entrapment of CACNPs may be due to anionic bile components' interaction with cationic compounds like chitosan (Pavlović et al., 2018). CNPs-based drug delivery systems with similar drug concentrations have exhibited consistent and slow release over 24 hrs (Dahiya et al., 2023, Surendran and Palei, 2022).
The examination into cytotoxicity, which was carried out using the MTT test, provided valuable insights into the biocompatibility of CACNPs, which is an essential component for the potential uses of these nanomaterials in the field of medicine (Li et al., 2012). The MTT test confirmed CACNPs' biocompatibility, which is significant for medicine (Larsson et al., 2020). The intricate link between concentration of CACNPs and cell health must be examined since concentration of a drug affects cell viability. At the highest dose, cell viability decreased somewhat, indicating mild cytotoxicity. Lower doses retain cell viability, indicating limited cytotoxicity. Concentration-dependent patterns suggest therapeutic windows for CACNPs. Though biocompatible, excessive doses can be harmful. Besides IC50 data, negative and positive controls demonstrate the assay's sensitivity and specificity (Berrouet et al., 2020). Microscopic assays demonstrate cytocompatibility of the CACNPs.
The impact of CACNPs on 3 T3-L1 pre-adipocyte glucose absorption and development was dose-dependent, with a significant decrease at 500 µg/ml. At 250 µg/ml, CACNPs slightly improved glucose uptake, while at 500 µg/ml, differentiated adipocytes dramatically increased glucose absorption after 22 hrs. The undifferentiated and differentiated control groups showed constant optical density (OD), showing the experimental design is reliable for adipocyte differentiation. CACNP therapy reduced optical density (OD), indicating early adipogenesis and adipocyte differentiation suppression. The dosage-dependent association between OD values and glucose absorption showed that CACNP concentration is essential to adipocyte function. Increased glucose absorption at 500 µg/ml indicates CACNPs can boost glucose metabolism in mature fat cells. These findings show a complex relationship between CACNPs and adipocyte physiology. CACNPs restrict early differentiation but promote glucose absorption, which may affect adipocyte growth and function (Vishwanath et al., 2013).
The effects of CACNPs were next investigated on 3 T3-L1 preadipocyte adipocyte differentiation. Comparing the differentiated control group's intracellular lipid level to the non-differentiated group has proved differentiation's efficacy. The differentiated control group had excessive intracellular lipids. The absorbance rate of control differed significantly from test absorbance, indicating adipocyte differentiation. A follow-up study examined the effect of 500 µg/ml CACNPs on adipocyte differentiation. Contrary to expectations, CACNPs-treated cells had higher lipids. The unanticipated increase in lipid accumulation shows that CACNPs inhibit 3 T3-L1 preadipocyte development. Further seeded 3 T3-L1 cells were examined at 20x magnification for lipid buildup and found that differentiated grown cells had red lipid droplets in their cytoplasm, supporting the concept that they probably promoted positive adipogenesis (Majka et al., 2014).
Gene expression experiments showed that 3T3L1 cell line PI3K, GLUT4, and PPARg mRNA levels directly affect adipose tissue glucose metabolism. Results showed that CACNPs enhanced the expressions of all three genes. PI3K improves adipose tissue insulin signalling (Nelson et al., 2014). PPAR isoforms have been found to affect human processes like cell growth, differentiation, development, metabolism, and cancer, making them therapeutic targets. High amounts of PPAR in regions with high mitochondrial fatty acid oxidation control genes involved in lipoprotein metabolism, resulting in enhanced HDL (Grimaldi et al., 2010). Corresponding results from our study also revealed the increased expression of PPARg in CACNPs added cell lines when compared to differentiated and undifferentiated control cells.
Hemocompatibility assay is a critical and significant tool for analyzing the effects of a medical component when it is intended to be used for interacting with blood or its constituents (Nalezinková, 2020). In the current study, the physicochemical properties of nanomaterials define the way they interact with blood, cells and tissues which is deemed to be their hemocompatibility which was obvious from our results that showed less than 2 % lysis which is a non-hemolytic profile (Malehmir et al., 2023).
5 Conclusions
The analysis of CACNPs demonstrated their promising potential as therapeutic agents. The nanoparticles exhibited favorable properties such as a small particle size and a low PDI, supporting passive targeting of diseased cells. However, the reduction in zeta potential after six months suggests a need for further optimization to enhance long-term stability. Additionally, CACNPs positively impacted glucose uptake in differentiated adipocytes, and qPCR analysis revealed the modulation of key genes involved in glucose metabolism. In addition, the CACNPs presented excellent hemocompatibility and biocompatibility. The overall biocompatibility of CACNPs reinforce their suitability for further investigation suggesting them as promising candidates for future research in context of glucose metabolism.
CRediT authorship contribution statement
Vijay Kumar Deenadayalan: Writing – original draft, Methodology, Data curation, Conceptualization. Divya Sunder Raj: Writing – original draft, Methodology, Formal analysis, Data curation. ArulJothi Kandasamy Nagarajan: Writing – review & editing, Methodology, Formal analysis, Data curation. Judith Nivedha Baskar: Writing – review & editing, Formal analysis. David Prince: Writing – review & editing, Formal analysis, Data curation. Rajakrishnan Rajagopal: Writing – review & editing, Formal analysis, Data curation. Ahmed Alfarhan: Writing – review & editing, Formal analysis, Data curation. Rajasekhara Reddy Iska: Writing – review & editing, Formal analysis, Data curation. Vijaya Bhaskar Reddy Iska: Writing – review & editing, Formal analysis, Data curation. Yijun Shi: Writing – review & editing, Supervision, Formal analysis, Data curation, Conceptualization. Joe Antony Jacob: Writing – original draft, Supervision, Formal analysis, Data curation, Conceptualization.
Acknowledgements
This project was supported by the sixth “169″ engineering academic and technical backbone research project in Zhenjiang City, China, project number: 2021-169GG-27. Also, the authors extend their appreciation to the Researchers supporting project number (RSP2024R11), King Saud University, Riyadh, Saudi Arabia.
Declaration of competing interest
The authors declare that they have no known competing financial interests or personal relationships that could have appeared to influence the work reported in this paper.
References
- Moringa concanensis Nimmo ameliorates hyperglycemia in 3T3-L1 adipocytes by upregulating PPAR-γ, C/EBP-α via Akt signaling pathway and STZ-induced diabetic rats. Biomed. Pharmacother.. 2018;103:719-728.
- [Google Scholar]
- Comparison of drug inhibitory effects (IC 50) in monolayer and spheroid cultures. Bull. Math. Biol.. 2020;82:68.
- [Google Scholar]
- Novel hydrophilic chitosan-polyethylene oxide nanoparticles as protein carriers. J. Appl. Polym. Sci.. 1997;63:125-132.
- [Google Scholar]
- Triterpenoids from Kochiae Fructus: Glucose Uptake in 3T3-L1 Adipocytes and α-Glucosidase Inhibition, In Silico Molecular Docking. Int. J. Mol. Sci.. 2023;24:2454.
- [Google Scholar]
- Development of Forskolin and rutin-loaded polymeric nanoparticles for enhancement of topical ocular delivery: optimization, in-vitro, ex-vivo, and toxicity evaluation. J. Drug Delivery Sci. Technol.. 2023;82:104292
- [Google Scholar]
- Design, optimization, and in-vivo performance of glipizide-loaded O-carboxymethyl chitosan nanoparticles in insulin resistant/type 2 diabetic rat model. J. Drug Delivery Sci. Technol.. 2023;79:104040
- [Google Scholar]
- Comparison of cytotoxic activity of anticancer drugs against various human tumor cell lines using in vitro cell-based approach. Int. J. Biomed. Sci.. 2012;8:76.
- [Google Scholar]
- Drug release kinetics and transport mechanisms of non-degradable and degradable polymeric delivery systems. Expert Opin. Drug Deliv.. 2010;7:429-444.
- [Google Scholar]
- Preparation and characterization of salsalate-loaded chitosan nanoparticles. in vitro release and antibacterial and antibiofilm activity. Mar. Drugs. 2022;20:733.
- [Google Scholar]
- PER2 controls lipid metabolism by direct regulation of PPARγ. Cell Metab.. 2010;12:509-520.
- [Google Scholar]
- Targeting cariogenic pathogens and promoting competitiveness of commensal bacteria with a novel pH-responsive antimicrobial peptide. J. Oral Microbiol.. 2023;15:2159375.
- [Google Scholar]
- Size, stability, and porosity of mesoporous nanoparticles characterized with light scattering. Nanoscale Res. Lett.. 2017;12:74.
- [Google Scholar]
- Functionalization of silver and gold nanoparticles using amino acid conjugated bile salts with tunable longitudinal plasmon resonance. Colloids Surf. B Biointerfaces. 2009;73:387-393.
- [Google Scholar]
- Anticancer potential of NF-κB targeting apoptotic molecule “flavipin” isolated from endophytic Chaetomium globosum. Phytomedicine. 2019;61:152830
- [Google Scholar]
- Optimization of cell viability assays to improve replicability and reproducibility of cancer drug sensitivity screens. Sci. Rep.. 2020;10:5798.
- [Google Scholar]
- Biocompatibility and toxicity of nanoparticles and nanotubes. J. Nanomater.. 2012;2012:6.
- [Google Scholar]
- Preparation and evaluation of stable nanofluids for heat transfer application. Adv. Nanofluid Heat Transf. 2022:25-57.
- [Google Scholar]
- Analysis and isolation of adipocytes by flow cytometry. Methods in enzymology Elsevier 2014
- [Google Scholar]
- A review: hemocompatibility of magnetic nanoparticles and their regenerative medicine, cancer therapy, drug delivery, and bioimaging applications. Front. Chem.. 2023;11:1249134.
- [Google Scholar]
- Exploration and insights into the cellular internalization and intracellular fate of amphiphilic polymeric nanocarriers. Acta Pharm. Sin. B. 2021;11:903-924.
- [Google Scholar]
- In vitro hemocompatibility testing of medical devices. Thromb. Res.. 2020;195:146-150.
- [Google Scholar]
- Chlorogenic acid loaded chitosan nanoparticles with sustained release property, retained antioxidant activity and enhanced bioavailability. Asian J. Pharm. Sci.. 2015;10:203-211.
- [Google Scholar]
- Adipose tissue insulin resistance due to loss of PI3K p110α leads to decreased energy expenditure and obesity. Am. J. Phys. Endocrinol. Metab.. 2014;306:E1205-E1216.
- [Google Scholar]
- Bile acids and their derivatives as potential modifiers of drug release and pharmacokinetic profiles. Front. Pharmacol.. 2018;9:1283.
- [Google Scholar]
- A review on potential anti-diabetic mechanisms of chitosan and its derivatives. Carbohydrate Poly. Technol. App.. 2022;3:100188
- [Google Scholar]
- Activity of amphotericin B-loaded chitosan nanoparticles against experimental cutaneous leishmaniasis. Molecules. 2020;25:4002.
- [Google Scholar]
- Study on aggregation properties and interactive nature of bile salts in the presence of drugs: a comparative approach. Indian Chem. Eng.. 2022;64:57-67.
- [Google Scholar]
- Mollification of doxorubicin (DOX)-mediated cardiotoxicity using conjugated chitosan nanoparticles with supplementation of propionic acid. Nanomaterials. 2022;12:502.
- [Google Scholar]
- Formulation and characterization of rutin loaded chitosan-alginate nanoparticles: antidiabetic and cytotoxicity studies. Curr. Drug Deliv.. 2022;19:379-394.
- [Google Scholar]
- Controlled release of felodipine from 3D-printed tablets with constant surface area: influence of surface geometry. Pharmaceutics. 2023;15:467.
- [Google Scholar]
- Managing diabetes with nanomedicine: challenges and opportunities. Nat. Rev. Drug Discov.. 2015;14:45-57.
- [Google Scholar]
- Novel method to differentiate 3T3 L1 cells in vitro to produce highly sensitive adipocytes for a GLUT4 mediated glucose uptake using fluorescent glucose analog. J. Cell Commun. Signaling. 2013;7:129-140.
- [Google Scholar]
- Prevalence and treatment of diabetes in China, 2013–2018. J. Am. Med. Assoc.. 2021;326:2498-2506.
- [Google Scholar]
- Mortality and years of life lost in diabetes mellitus and its subcategories in China and its provinces, 2005–2020. J. Diab. Res.. 2022;2022(1):1609267.
- [Google Scholar]
Appendix A
Supplementary material
Supplementary data to this article can be found online at https://doi.org/10.1016/j.jksus.2024.103480.
Appendix A
Supplementary material
The following are the Supplementary data to this article:


