

Translate this page into:
Mapping structural features of the Wadi Umm Dulfah area using aeromagnetic data
⁎Corresponding author. luanpt@hus.edu.vn (Luan Thanh Pham)
-
Received: ,
Accepted: ,
This article was originally published by Elsevier and was migrated to Scientific Scholar after the change of Publisher.
Peer review under responsibility of King Saud University.
Abstract
One major purpose of interpretation of magnetic data is to highlight edges of geology structures. In this paper, we applied the edge methods such as the enhancement of total gradient (ETG), normalized horizontal gradient (TDX), theta map (TM) and fast sigmoid (FSED) methods to delineate geological structures that appear as lineaments in transformed magnetic anomaly maps. Initially, these methods were estimated on a magnetic model for understanding their capability. Further, we applied these methods to real aeromagnetic data for determining lineaments of the Wadi Umm Dulfah area. Additionally, the depths of the magnetic sources in the area were also computed by the tilt depth method. The obtained results indicate the presence in the study area of three major lineament trends in NW–SE, N-S, and NE–SW directions, and most of the lineaments are in the depth range of 0.1 km to 1 km. These results bring a better understanding of the edge methods capability, as well as the geology structures of the Wadi Umm Dulfah area.
Keywords
Magnetics
Edge detection
Lineaments
Geological structure

1 Introduction
The Wadi Umm Dulfah area lies in the Egyptian North Eastern Desert (ENED) to the west of Hurghada city. The area is covered by sediments in its central and eastern parts and with basement in the western part. The basements represent the northeastern portion of the Pan-African orogenic-belt that reveals evidence of a complicated crustal evolution that took place in many stages during the time from 1100 Ma to around 450 Ma age (Kennedy, 1964; Kroner, 1983). Tectonic and Igneous events in this Wadi Umm Dulfah region resulted in the action of primitive-ensimatic crustal terrains, which were created collapsed together, and were swallowed by granites through the last 400 Ma of the Precambrian (Engel et al., 1980). Hamimi et al. (2019) analyzed the structure regimes in the ENED. They noted that the intersection of NE-SW and NNW-SSE faults is followed by the late tectonic granite masses intrusions. Despite the structural importance of the Wadi Umm Dulfah area due to its proximity to the Gulf of Suez and Gulf os Aqaba rifts, there are no extensive studies to explain the tectonic situation of the region and delineate the dominant structures. Our study aims to produce a new and accurate structural map for the Wadi Umm Dulfah area using a sharp edge detector of aeromagnetic data.
Detection of the edges and depth of anomalous bodies is one of the most important aims in magnetic and gravity interpretation (Ghomsi et al., 2020, 2021; Hang et al, 2019; Eldosouky and Saada, 2020; Pham et al., 2019, 2021a,b; Eldosouky et al., 2021a; Hoang et al., 2021; Duong et al., 2021; Eldosouky and Mohamed, 2021; Melouah et al., 2021). The information of the edges is important in estimating the boundaries of geology formations (Pham et al., 2018a; Eldosouky et al., 2021b). There are a great number of edge detection methods developed for interpreting the potential field data (Eldosouky et al., 2020a,b; Pham, 2020). The total gradient method (TG) is one of the conventional methods that are commonly used for outlining the edges (Roest et al., 1992). Although this method is a very popular method used to interpret magnetic data, it also has some limitations (Pham et al., 2021c, 2021d). Hsu et al. (1996) suggested using an enhancement of the TG method (ETG) to increase the resolution of the result. These methods use the maximum location to extract the source edges. Miller and Singh (1994) proposed the tilt derivative method to balance the different anomalies. This method detects the edges of the geological structures by the zero contours. Wijns et al. (2005) proposed the theta map method that normalizes the TG by the total horizontal gradient. The negative contours of the theta map are located over the edges of magnetic structures. Cooper and Cowan (2006) proposed the normalized version of the horizontal gradient that normalizes the vertical derivative amplitude by the gradient amplitude. The method uses the maximum location to detect the edges of the geology structures. Pham et al. (2018b, 2020a) developed some methods based on hyperbolic tangent and logistic functions that provide the maximum values over the edges of the sources. These methods bring the edges with higher resolution compared to the conventional methods. Melouah and Pham (2021) proposed an improved version of the logistic method that is based on the derivatives of the total horizontal gradient of the vertical derivative of the potential field. Oksum et al. (2021) presented a new method that uses the fast-sigmoid function of the gradients of the gradient amplitude. Similar to the logistic filters, this method provides an image with high resolution for the source edges, and it uses the maximum values to outline the edges. In addition to the above-mentioned filters, there are many other methods based on the derivatives of magnetic and gravity data in the literature (Beiki, 2010; Cordell and Grauch; 1985; Ferreira et al., 2013; Pham et al., 2020b, 2021e; Pham, 2021).
In this paper, the methods such as the enhanced total gradient (ETG), normalized horizontal gradient (TDX), theta map (TM) and fast sigmoid (FSED) have been applied to aeromagnetic data to extract geology features of the Wadi Umm Dulfah area. Moreover, the depth to the magnetic sources in the area were also estimated by the tilt depth method.
2 Geological setting
The Egyptian Eastern Desert (EED) is divided into three main territories. These main parts are South (ESED), Central (ECED), and North (ENED). These three domains were generated in different tectonic frameworks in an independent, but in a very similar style and exhibit a specific younging from ESED to ENED (Abd El-Wahed and Hamimi, 2021). Geologically, these three domains differ from each other to their foremost revealed rock types (Kroner et al., 1987). The ENED, to the north of 27° 00′ lat., is distinguished by the presence of younger rocks (e.g., Dokhan volcanics, younger Gattarian granites, and Hammamat sediments), while the older types of the rocks rarely occur like the granodiorites, 610–680 Ma (Stern and Hedge, 1985).
The Wadi (W) Umm Dulfah area is located in the Egyptian North-Eastern Desert (ENED). The main wadis cutting the area are W Faliq, W Umm Dulfah, W Umm Duhaysi, and W Umm Kharazah (EGSMA, 2005). The area reaches the coast of the red sea from its north-eastern side and is covered by various rock units of different ages (Precambrian to Recent) (Fig. 1). The basements of the ENED are a part of the Arabian Nubian Shield (ANS) which were created throughout the Pan-African era (900–600 Ma) in a marine setting (Kroner, 1985; Shackleton et al., 1980). The eastern and central parts of W Umm Dulfah area are covered by the recent Holocene deposits (Wadi deposits, Coral Reefs, Sabkha, and Alluvial wadi deposits, Pleistocene deposits, Gabir formation (F) of Pliocene age, and Samh F and Gharamul F (Miocene) (Conoco, 1987; EGSMA, 2005). The basements (western part of W Umm Dulfah area) acidic-to-intermediate metavolcanics, Gabbro-Diorite, Granodiorite-Tonalite, Monzogranie, and Alkali feldspar granite (El-Gaby et al., 1990; EGSMA, 2005).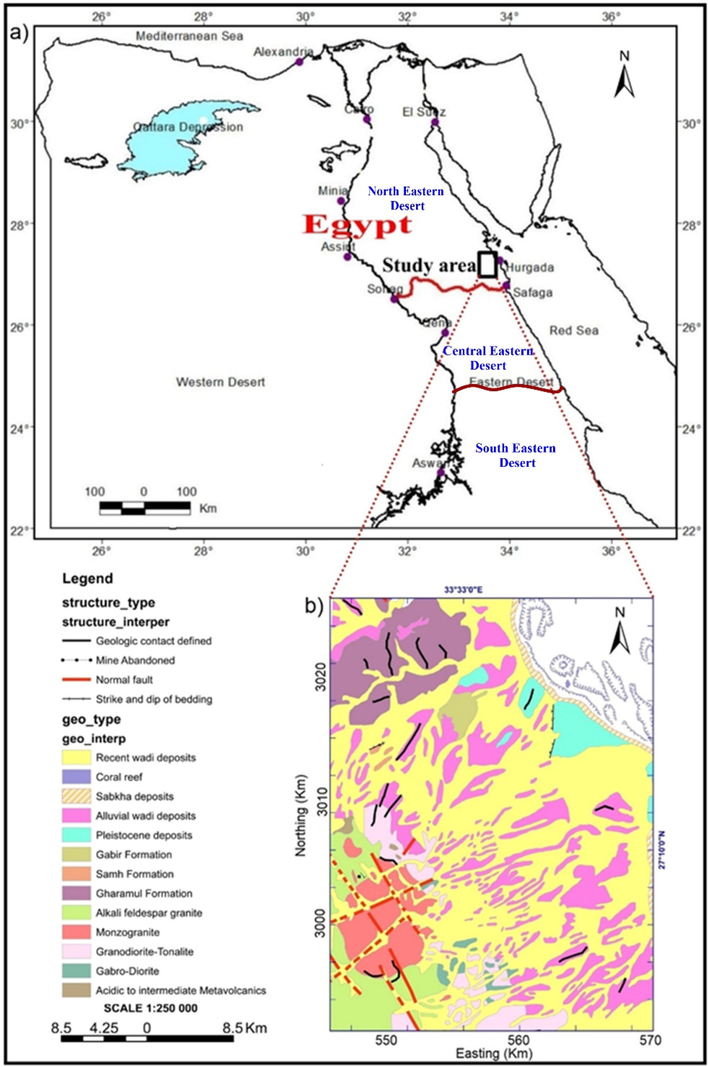
a) Geographical location (Abd El-Wahed and Hamimi, 2021), b) The geology of the Wadi Umm Dulfah area (modified after EGSMA, 2005).
3 Data
The studied area was operated by Aero-Service-Aircraft, Cessna-Titan, type 404. The separation of traverse lines was 1 km and 10 km, and tie-line separation was at 120 m altitude (terrain clearance). The traverse lines were situated in a north-east:south-west (NE-SW) direction and perpendicular tie lines to the traverse direction, north-west:south-east (NW-SE) (Aero-Service-Report, 1984). The data is obtained in the form of total magnetic intensity (TMI). The TMI data is digitized and gridded after subtracting the IGRF (=42425 nT). Then, the TMI is reduced to the north magnetic pole (RTP). The parameters employed for the reduction are an inclination of 39.5˚N and declination of 2˚E which express the mean value for the area. The RTP data range from 395 nT to 690 nT with high amplitude anomalies that appear in the southeastern region of the Wadi Umm Dulfah area (Fig. 2).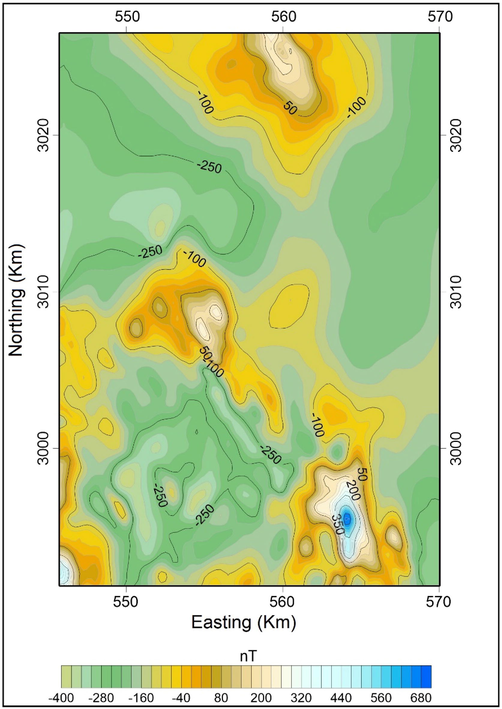
RTP aeromagnetic data of the Wadi Umm Dulfah area.
4 Methods
The ETG method is one of the high-resolution methods for enhancing the edges of the geology structures. The ETG of the field F is defined by the following equation (Hsu et al., 1996):
The TM method is defined by Wijns et al. (2005). It uses the ratio of the derivatives to balance the different anomalies. Its equation is given as:
The TDX is another balanced method, proposed by Cooper and Cowan (2006). The equation of the TDX is given as the following equation:
Another method for enhancement of the edges is introduced by Oksum et al. (2021), which is based on the gradients of the gradient amplitude. The method can enhance the edges of the shallow and deep bodies at the same time. Its equation is given by:
and
The FSED function provides maximum amplitudes over the source edges. Since the method design is based on the ratio of the derivatives of the total horizontal gradient, it can balance anomalies from shallow and deep sources simultaneously (Oksum et al., 2021).
The tilt depth method is introduced by Salem et al. (2007) for detecting the depth to the top of magnetic sources. The method uses the RTP data and derives the relationship between the tilt angle, horizontal location and depth of a vertical 2D contact model as
Equation (7) indicates the tilt angle value above the edges of the contact is 0° (h = 0) and equal to 45° when and –45° when . This suggests that contours of the tilt angle can identify both the horizontal location (θ = 0°) and depth (half distance between ±45° contours) of magnetic sources (Salem et al., 2007).
5 Test study
Initially, we generated a synthetic magnetic model to study the effectiveness of the methods, and their enhanced versions. The three-dimensional view of the model is displayed in Fig. 3a. This model consists of three prismatic sources, whose parameters are given in Table 1. The computed magnetic anomaly over the model is displayed in Fig. 3b. Fig. 4a shows the ETG of data in Fig. 3b. We can see that, the ETG method can bring clear images for the edges for the body A, but responses from the bodies B and C are blurred. Fig. 4b shows the TM of magnetic data in Fig. 3b. Although the TM can equalize the signals from shallow and deep sources, it brings the false boundaries around the body B. Fig. 4c shows the result of application of the TDX method to magnetic data in Fig. 3b. As can be seen from this figure, the TDX is more effective in determining all the edges than the ETG method. Similar to the TM method, the ETG method uses the ratio of the gradients, thus it can equalize the signals from shallow and deep bodies. However, the TDX method also brings the false boundaries around the body B. Fig. 4d displays the boundaries obtained from applying the FSED method to magnetic data in Fig. 3b. It is clearly seen that the peaks of the FSED are located directly over the source boundaries, and this method provides sharper responses over the source boundaries than ETG, TM and TDX methods.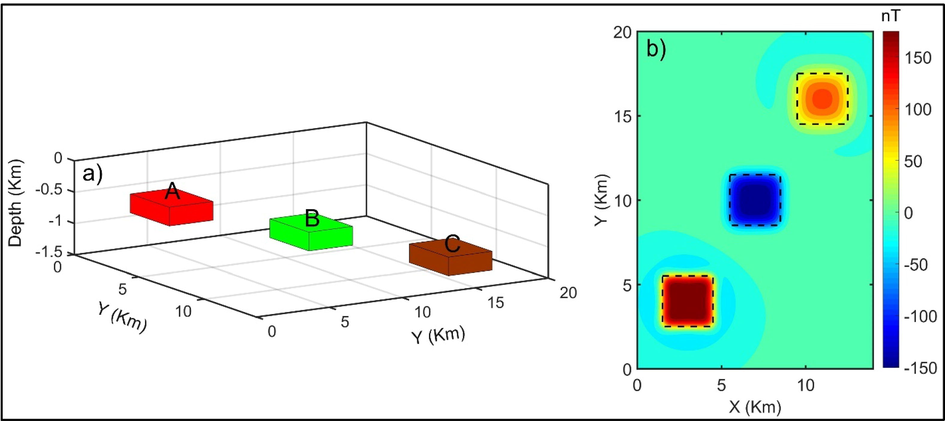
Three-dimensional view of the model (a) and its magnetic anomaly (b). The dashed lines show the true edges of the prismatic sources.
Parameters/Prism ID
A
B
C
Center coordinates (km; km)
3; 4
7; 10
11; 16
Width (direction x) (km)
3
3
3
Length (direction y) (km)
3
3
3
Depth of top (km)
0.5
0.8
1.1
Depth of bottom (km)
0.8
1.1
1.4
Declination (°)
0
0
0
Inclination (°)
90
90
90
Magnetization (A/m)
2
−2
2
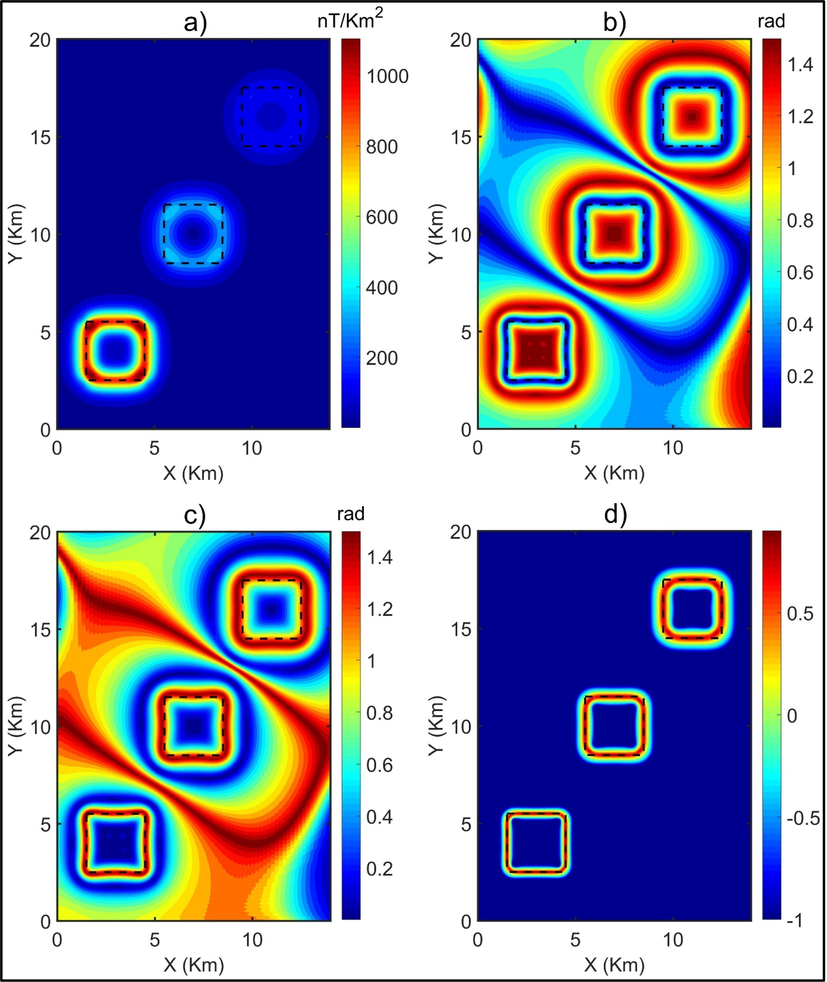
a) ETG, b) TM, c) TDX, d) FSED. The dashed lines show the true boundaries of the prismatic sources.
6 Results and discussion
We have applied the RAPS (radially averaged power spectrum) method to separate residual anomaly from RTP data. The amplitude spectrum of The RTP anomalies was computed using MagB_inv software that was developed by Pham et al. (2020c). A plot of the logarithm power spectrum versus wavenumber usually shows several straight-line segments that decrease in slope with increasing wavenumber. Fig. 5 shows a plot of the radially averaged amplitude spectrum of the RTP anomaly versus wavenumber. Here, the linear segment S1 relates to deep sources, linear segment S2 relates to intermediate sources, while the other linear segment S3 relates to shallower sources. The regional anomalies of deep structures were calculated by applying a low-pass filter to the RTP data using a cut-off wavenumber 0.2 km−1 at which the low wavenumber segment intercepts the intermediate segment (Fig. 5). Then the residual anomaly caused by localized magnetic effects was calculated by removing the regional anomaly from the observed anomaly. The calculated regional field and the residual field anomaly maps are shown in Fig. 6a and b, respectively.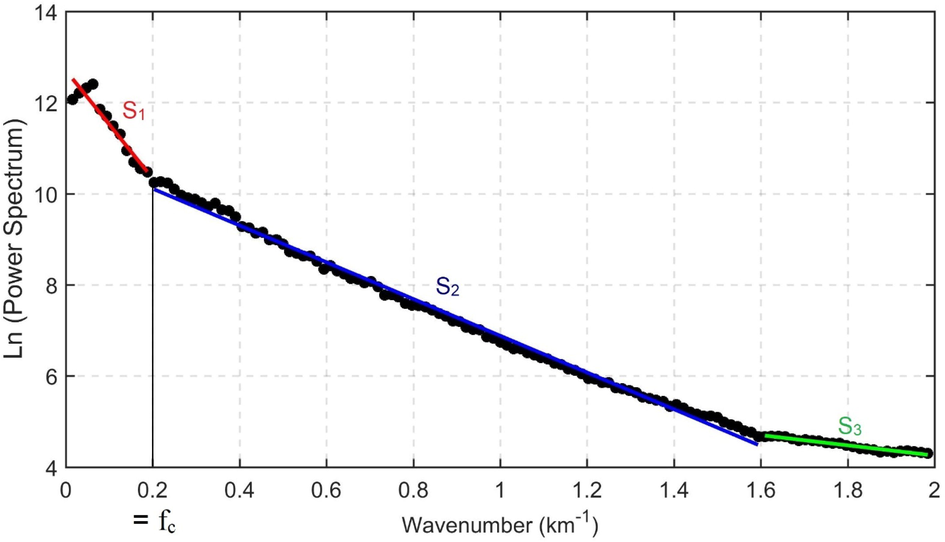
Radially averaged amplitude spectrum (Spector and Grant 1970) of the RTP data in Fig. 2 with three linear segments related to deep sources, intermediate sources, and shallower sources.
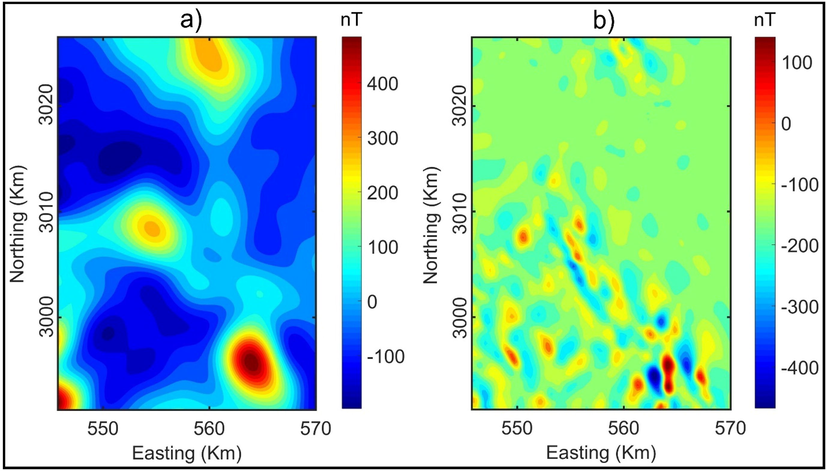
Regional field and the residual field anomaly maps.
We used the residual map (Fig. 6b) to extract the structural features of the Wadi Umm Dulfah area. Fig. 7a shows the boundaries determined by applying the ETG filter to the RTP data. We can see that the ETG filter is dominated by the anomalies with larger amplitudes in the southeastern region, and it cannot outline the edges of the small anomalies clearly. Fig. 7b shows the result obtained by applying the TM method to the RTP data. It is clearly seen that the TM method is very effective in balancing magnetic anomalies with different amplitudes, and it provides clearer geological features compared to the ETG. Fig. 7c shows the result obtained by applying the TDX method to the RTP data. Similar to the TM method, the TDX method is also effective in bringing a balanced image of the edges, and it provides clearer lineaments compared to the ETG. Fig. 7b and 7c show that both the TM and TDX methods gave the same result. Although the TM and TDX methods are not dominated by the anomalies with larger amplitudes in the southeastern part of the area, the boundaries determined by these methods are connected, making it hard for extracting structural features of the Wadi Umm Dulfah area. The reason is that the TM and TDX methods are based on the zero values of the vertical gradient that produces the false zero contours around the sources (Pham et al., 2021). Fig. 7d shows the result obtained from applying the FSED method to the RTP data. Clearly, the FSED method cannot only delineate the edges of strong and weak amplitude signals at the same time, but also brings sharp responses over geological features of the Wadi Umm Dulfah area.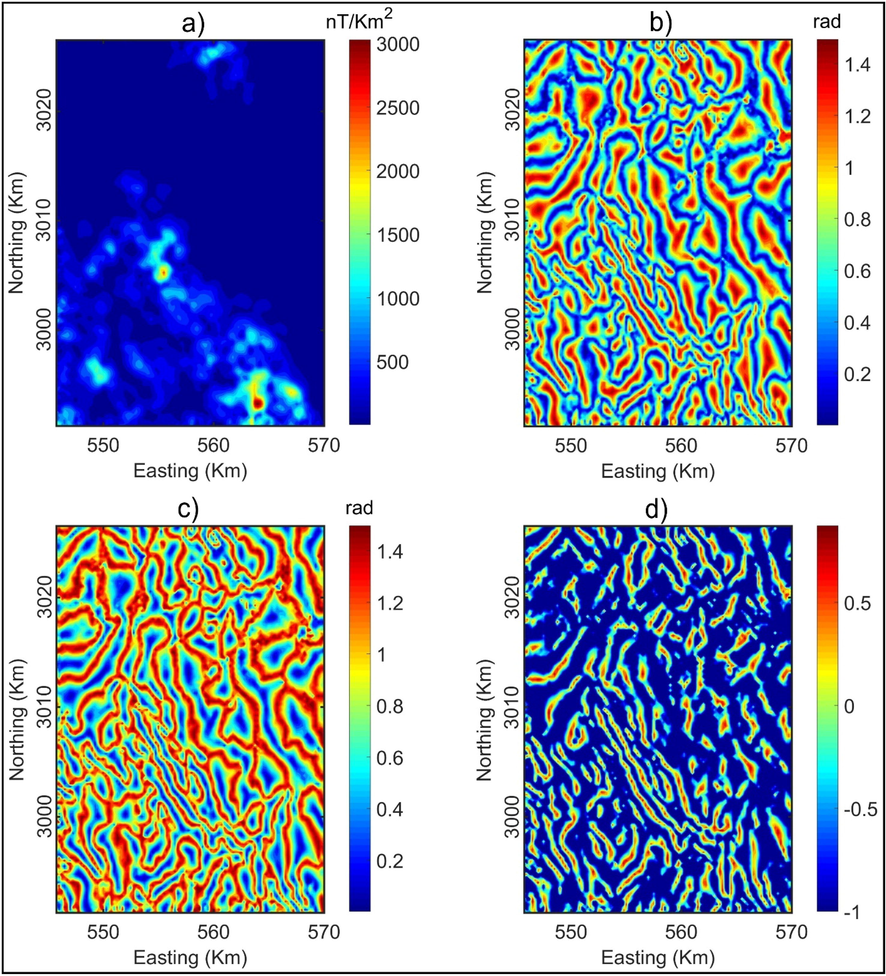
a) ETG, b) TM, c) TDX, d) FSED.
To estimate the depths to magnetic sources in the Wadi Umm Dulfah area, the tilt depth method (Salem et al., 2007) was be used. The best advantage of this method is that it does not need to use magnetization, window size or structure index. Fig. 8a shows the depths of magnetic structures in the area. The obtained result shows that most of the depth of magnetic structures ranges from 0.1 to 1 km. Here, we used the FSED map to extract the lineaments of geological features of the Wadi Umm Dulfah area. These lineaments are superimposed on the tilt depth map (Fig. 8b). The synoptic Rose diagrams of the lineaments delineated from the FSED method is shown in Fig. 8c. As can be seen from this figure, the main structures of the study area are NW–SE, N-S and NE–SW trending structures. In addition, most of the lineaments determined from the FSED method are verified by the magnetic sources in Fig. 8a.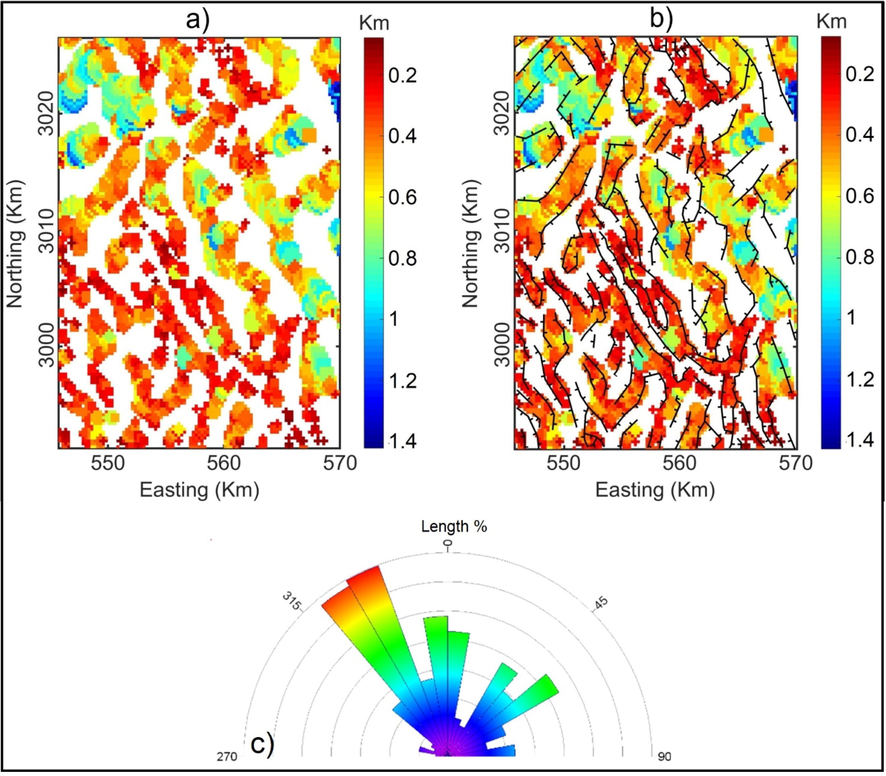
(a) Tilt depth contour map, (b) Lineaments from the FSED map superimposed on Tilt depth contour map, (c) Synoptic rose diagram for the lineaments in Fig. 8b.
We also compared the structures interpreted from the FSED map with the geologic structures of Fig. 1b (Fig. 9). The lineaments of the FSED method show that the Wadi Umm Dulfah area was affected by the Gulf of Suez rifting (GOSR) system. This can be notified by the excess of the NW-SE trends related to the GOSR system in the central and western parts bounding the basement blocks. The E-W (Tethyan or Mediterranean) trend is absent in the obtained lineaments map (Fig. 9).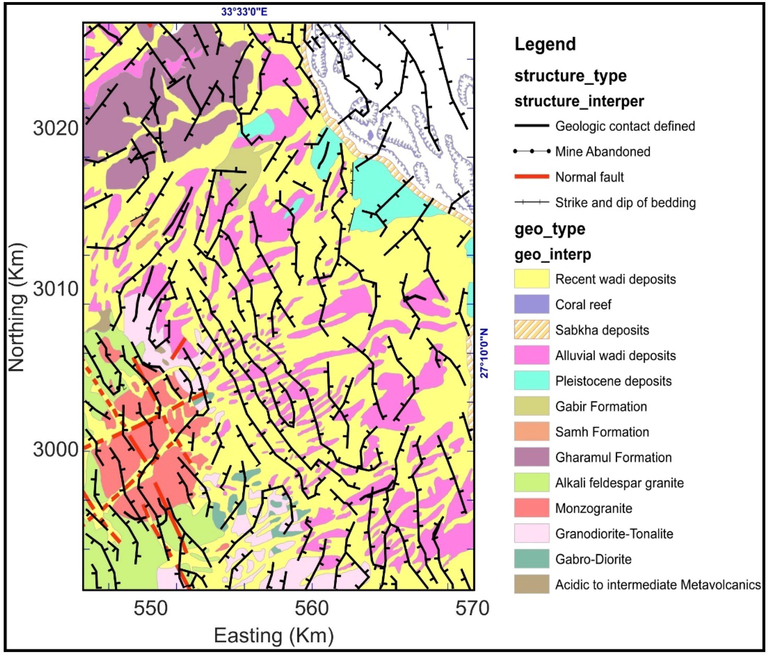
Lineaments from the FSED map superimposed on the geological map.
The NW-SE (Gulf of Suez-Red Sea, Erythrean or Clysmic) direction appeared as the main structural trend controlling the study area (Figs. 8 and 9). Our results agree with Meshref and El-Sheikh (1973) whose concluded that the NW-SE is the complementary shear fracture system that might result from a northern compressive force. El-Shazly (1966) defined the NE-SW trend as a transverse fracture to the dominant NW-SE fractures along which huge intrusions were emplaced. Fig. 7d shows that the NW-SE structural trend is dissected and being cut by the recent NE-SW trend.
NW-SE (Gulf of Suez) and NE-SW are the main trends affecting the area. On this Closed alternative elongated anomalies (negative and positive) have a NW-SE trend. We can presume that the NW-SE (younger) trend is dominant in the Wadi Umm Dulfa area (Meshref et al., 1980) and the area is affected by the GOSR system during Miocene. The NW-SE faults of the study area are aligned with main basement lineaments that may have developed preexisting basement structures during the rifting (Moustafa and El Shaarawy, 1987; Saada, 2016).
7 Conclusions
The aeromagnetic data interpretation allowed us to highlight the geological features of the Wadi Umm Dulfah area. This study is based on the use of the enhanced total gradient (ETG), normalized horizontal gradient (TDX), theta map (TM), fast sigmoid (FSED) and tilt depth methods. Findings show that the FSED method has permit to clearly identify the lineaments of geological features, while the tilt depth method can provide the information on the depth of structures in the Wadi Umm Dulfah area, which ranges 0.1 to 1 km. It is observed from the FSED map that the lineaments show three major trends in NW–SE, N-S, and NE–SW directions. These results are a very useful document in better understanding of the capability of the edge detecting methods, as well as the geological structures of the Wadi Umm Dulfah area.
Acknowledgements
Deep thanks and gratitude to the Researchers Supporting Project number (RSP-2022/351), King Saud University, Riyadh, Saudi Arabia for funding this research article.
Declaration of Competing Interest
The authors declare that they have no known competing financial interests or personal relationships that could have appeared to influence the work reported in this paper.
References
- The infracrustal rocks in the Egyptian Nubian Shield: an overview and synthesis. In: Hamimi Z., Arai S., Fowler A.R., El-Bialy M.Z., eds. The Geology of the Egyptian Nubian Shield. Regional Geology Reviews. Cham: Springer; 2021.
- [CrossRef] [Google Scholar]
- Aero-Service, 1984. Final operational report of airborne magnetic/radiation survey in the Eastern Desert, Egypt. For the Egyptian General Petroleum Corporation (EGPC) and the Egyptian Geological Survey and Mining Authority (EGSMA), Aero-Service Division, Houston, Texas, USA, Six Volumes. No.3609.
- Analytic signals of gravity gradient tensor and their application to estimate source location. Geophysics. 2010;75(6):I59-I74.
- [Google Scholar]
- Conoco, C., 1987. Geological map of Egypt. Scale 1, 500 000.
- Enhancing potential field data using filters based on the local phase. Comput. Geosci.. 2006;32:1585-1591.
- [Google Scholar]
- Mapping Basement Magnetization Zones from Aeromagnetic Data in the San Juan Basin. New Mexico: SEG Publication; 1985. p. :181-197.
- Relationship between seismicity and active faults in Thanh Hoa province detected by local seismic network. Vietnam J. Earth Sci.. 2021;43(2):199-219.
- [Google Scholar]
- EGSMA, 2005. Geologic map of Hurghada (Al Ghardaqah) Quadrangle, Egypt, Scale 1: 250 000.
- The basement complex of the Eastern Desert and Sinai. In: Said R., ed. Geology of Egypt. Rotterdam: AA Balkema; 1990. p. :175-184.
- [Google Scholar]
- A comparative study of THG, AS, TA, Theta, TDX and LTHG techniques for improving source boundaries detection of magnetic data using synthetic models: a case study from G. Um Monqul, North Eastern Desert, Egypt. J. Afr. Earth Sci.. 2020;170:103940.
- [Google Scholar]
- Enhancing linear features in aeromagnetic data using directional horizontal gradient at Wadi Haimur area, South Eastern Desert, Egypt. CarpathianJ. Earth Environ. Sci.. 2020;15(2):323-326.
- [Google Scholar]
- Source edge detection (SED) of aeromagnetic data: synthetic examples and a case study from Haimur area, south Eastern Desert, Egypt. Arab J. Geosci.. 2020;13:626.
- [CrossRef] [Google Scholar]
- Eldosouky, A.M., Pour, A.B., Hamed, A., Taha, A., Gamal, M., Mahmoud, A., Pham, L.T., 2021, Utilization of Landsat-8 imagery and aeromagnetic data for deciphering alteration zones and structures: implications for mineral exploration in the Southeastern Desert of Egypt, Front. Sci. Res. Technol. 2, 19-28.
- Eldosouky, A.M., Pham, L.T., El-Qassas, R.A.Y., Hamimi, Z., Oksum, E., 2021b. Lithospheric Structure of the Arabian–Nubian Shield Using Satellite Potential Field Data. In: Hamimi Z., Fowler AR., Liégeois JP., Collins A., Abdelsalam M.G., Abd EI-Wahed M. (eds) The Geology of the Arabian-Nubian Shield. Regional Geology Reviews. Springer, Cham. .
- Edge detection of aeromagnetic data as effective tools for structural imaging at Shilman area, South Eastern Desert, Egypt. Arab J. Geosci.. 2021;14:13.
- [CrossRef] [Google Scholar]
- Structural development of Egypt. In: U.A.R. Abstract of the 4th Annual Meeting. Cairo, Egypt: Geol. Society of Egypt; 1966. p. :31-38.
- [Google Scholar]
- Late Precambrian evolution of Afro Arabian crust from ocean to craton. Geol. Soc. Am. Bull.. 1980;91:699-706.
- [Google Scholar]
- Enhancement of the total horizontal gradient of magnetic anomalies using the tilt angle. Geophysics. 2013;78(3):J33-J41.
- [Google Scholar]
- Tectonics of the Eastern Desert of Egypt: Key to Understanding the Neoproterozoic Evolution of the Arabian–Nubian Shield (East African Orogen) In: Bendaoud A., Hamimi Z., Hamoudi M., Djemai S., Zoheir B., eds. The Geology of the Arab World---An Overview. Cham: Springer Geology. Springer; 2019.
- [CrossRef] [Google Scholar]
- An improved space domain algorithm for determining the 3-D structure of the magnetic basement. Vietnam J. Earth Sci.. 2019;41(1):69-80.
- [Google Scholar]
- Holocene sedimentation offshore Southeast Vietnam based on geophysical interpretation and sediment composition analysis. Vietnam J. Earth Sci.. 2021;43(3):336-379.
- [Google Scholar]
- High-resolution detection of geologic boundaries from potential field anomalies: an enhanced analytic signal technique. Geophysics. 1996;61:373-386.
- [Google Scholar]
- Cameroon’s crustal confguration from global gravity and topographic models and seismic data. J. Afr. Earth Sci.. 2020;161:103657
- [Google Scholar]
- Main structural lineaments of the southern Cameroon volcanic line derived from aeromagnetic data. J. Afr. Earth Sci.. 2022;186:104418.
- [Google Scholar]
- Kennedy, W.O., 1964. The structural differentiation of Africa in the Pan-African tectonic episode. In: 8th Ann. Rep., Res. Inst. Afr. Geol., Leeds Univ., pp 48–49.
- Evolution of tectonic boundaries in the Late Proterozoic Arabian-Nubian shield of northeast Africa and Arabia. In: Abstracts, International Symposium on Precambrian Crustal Evolution, Beijing, China. 1983. p. :24-25.
- [Google Scholar]
- Ophiolites and the evolution of tectonic boundaries in the Late Protero-zoic Arabian-Nubian Shield of northeast Africa and Arabia. Precamb. Res.. 1985;27:277-300.
- [Google Scholar]
- Pan-African crustal evolution in the Nubian segment of northeast Africa. Proterozic Lithospheric Evol. 1987:235-257.
- [Google Scholar]
- Improved ILTHG method for edge enhancement of geological structures: application to gravity data from the Oued Righ valley. J. Afr. Earth Sci.. 2021;177:104162
- [Google Scholar]
- Deep crustal architecture of the eastern limit of the West African Craton: Ougarta Range and Western Algerian Sahara. J. African Earth Sci.. 2021;183:10432.
- [Google Scholar]
- Magnetic trend analysis in the northern part of Arabian Nubian Shield and its tectonic implications. Ann. Geol. Surv. Egypt. 1980;10:939-953.
- [Google Scholar]
- Potential field tilt a new concept for location of potential field sources. J. Appl. Geophys.. 1994;32(2-3):213-217.
- [Google Scholar]
- Tectonic setting of the northern Gulf of Suez. Geophys Soc. Egypt Bull.. 1987;5:339-368.
- [Google Scholar]
- A novel approach based on the fast sigmoid function for interpretation of potential field data. Bull. Geophys. Oceanogr.. 2021;62(3):543-556.
- [Google Scholar]
- A comparative study on different filters for enhancing potential field source boundaries: synthetic examples and a case study from the Song Hong Trough (Vietnam) Arab. J. Geosci.. 2020;13(15):723.
- [Google Scholar]
- A high-resolution edge method for interpreting potential field data: a case study from the Witwatersrand basin, South Africa. J. Afr. Earth Sci.. 2021;178:104190
- [Google Scholar]
- Determination of maximum tilt angle from analytic signal amplitude of magnetic data by the curvature-based method. Vietnam J. Earth Sci.. 2018;40(4):354-366.
- [Google Scholar]
- A new method for edge detection in interpretation of potential field data. J. Eng. Sci. Design. 2018;6(4):637-642.
- [Google Scholar]
- Estimation of curie point depths in the southern Vietnam continental shelf using magnetic data. Vietnam. J. Earth Sci.. 2019;41(3):216-228.
- [Google Scholar]
- Enhancement of potential field source boundaries using an improved logistic filter. Pure Appl. Geophys.. 2020;177:5237-5249.
- [Google Scholar]
- A new high-resolution filter for source edge detection of potential field data. Geocarto Int.. 2020;1–18
- [CrossRef] [Google Scholar]
- MagB_inv: a high performance Matlab program for estimating the magnetic basement relief by inverting magnetic anomalies. Comput. Geosci.. 2020;134:104347.
- [Google Scholar]
- A comparative study on the peak detection methods used to interpret potential field data: a case study from Vietnam. Geocarto Int. 2021
- [CrossRef] [Google Scholar]
- Performance evaluation of amplitude- and phase based methods for estimating edges of potential field sources. Iran J. Sci. Technol. Trans. Sci.. 2021;45:1327-1339.
- [Google Scholar]
- Mapping subsurface structural lineaments using the edge filters of gravity data. J. King Saud. Univ. Sci.. 2021;33:101594.
- [Google Scholar]
- Delineation of structural lineaments of the Southwest Sub-basin (East Vietnam Sea) using global marine gravity model from CryoSat-2 and Jason-1 satellites. Geocarto Int.. 2021;1–18
- [CrossRef] [Google Scholar]
- Edge detection of potential field sources using the softsign function. Geocarto Int.. 2021;1–14
- [CrossRef] [Google Scholar]
- Magnetic interpretation using the 3-D analytic signal. Geophysics. 1992;57:116-125.
- [CrossRef] [Google Scholar]
- Edge detection and depth estimation of Galala El Bahariya Plateau, Eastern Desert-Egypt, from aeromagnetic data. Geomech. Geophys. Geoenerg. Georesour.. 2016;2:25-41.
- [CrossRef] [Google Scholar]
- Tilt-depth method: a simple depth estimation method using first-order magnetic derivatives. Leading Edge. 2007;26(12):1502-1505.
- [CrossRef] [Google Scholar]
- Late Precambrian ophiolite melange in the Eastern Desert of Egypt. Nature. 1980;285:472-474.
- [Google Scholar]
- Geochronologic and isotopic constraints on late Precambrian crustal evolution in the Eastern Desert of Egypt. Am. J. Sci.. 1985;285:97-127.
- [CrossRef] [Google Scholar]
Appendix A
Supplementary data
Supplementary data to this article can be found online at https://doi.org/10.1016/j.jksus.2021.101803.
Appendix A
Supplementary data
The following are the Supplementary data to this article:


