Translate this page into:
Magnetic survey for delineating subsurface structures and estimating magnetic sources depth, Wadi Fatima, KSA
-
Received: ,
Accepted: ,
This article was originally published by Elsevier and was migrated to Scientific Scholar after the change of Publisher.
Abstract
The studied area is characterized by having complex structures that trend mainly in the NNW–SSE, N–S and E–W to ENE–WSW directions. Magnetic survey is used to delineate the subsurface structures and to estimate the magnetic sources depth of the selected area in Wadi Fatima, Saudi Arabia. Reduction to pole (RTP), 3D Euler deconvolution, and edge enhancement using standard deviation filters have been applied in order to achieve the above mentioned goals. Edge enhancement using standard deviation is mainly used to delineate the subsurface structures while the 3D Euler deconvolution is used not only to delineate major subsurface structures but also to determine the structural indices of them as well as the average depth of the magnetic sources. The calculated structural indices show that the area is mainly affected by contacts/thin sheet and the estimated depth of magnetic sources ranged between ≈15 m and ≈31 m.
This study has given a clear picture of the geologic structures beneath the study area as well as guidance for geoelectric studies necessary for groundwater and engineering investigations.
Keywords
Magnetic
Wadi Fatima
Reduced-to-pole
3D Euler deconvolution
Edge enhancement using standard deviation
1 Introduction
The study area is located in Wadi Fatima within the Arabian Shield and bounded by the northing coordinate 2382861 and 2382853N and the easting coordinate 568620 and 568888E (Fig. 1).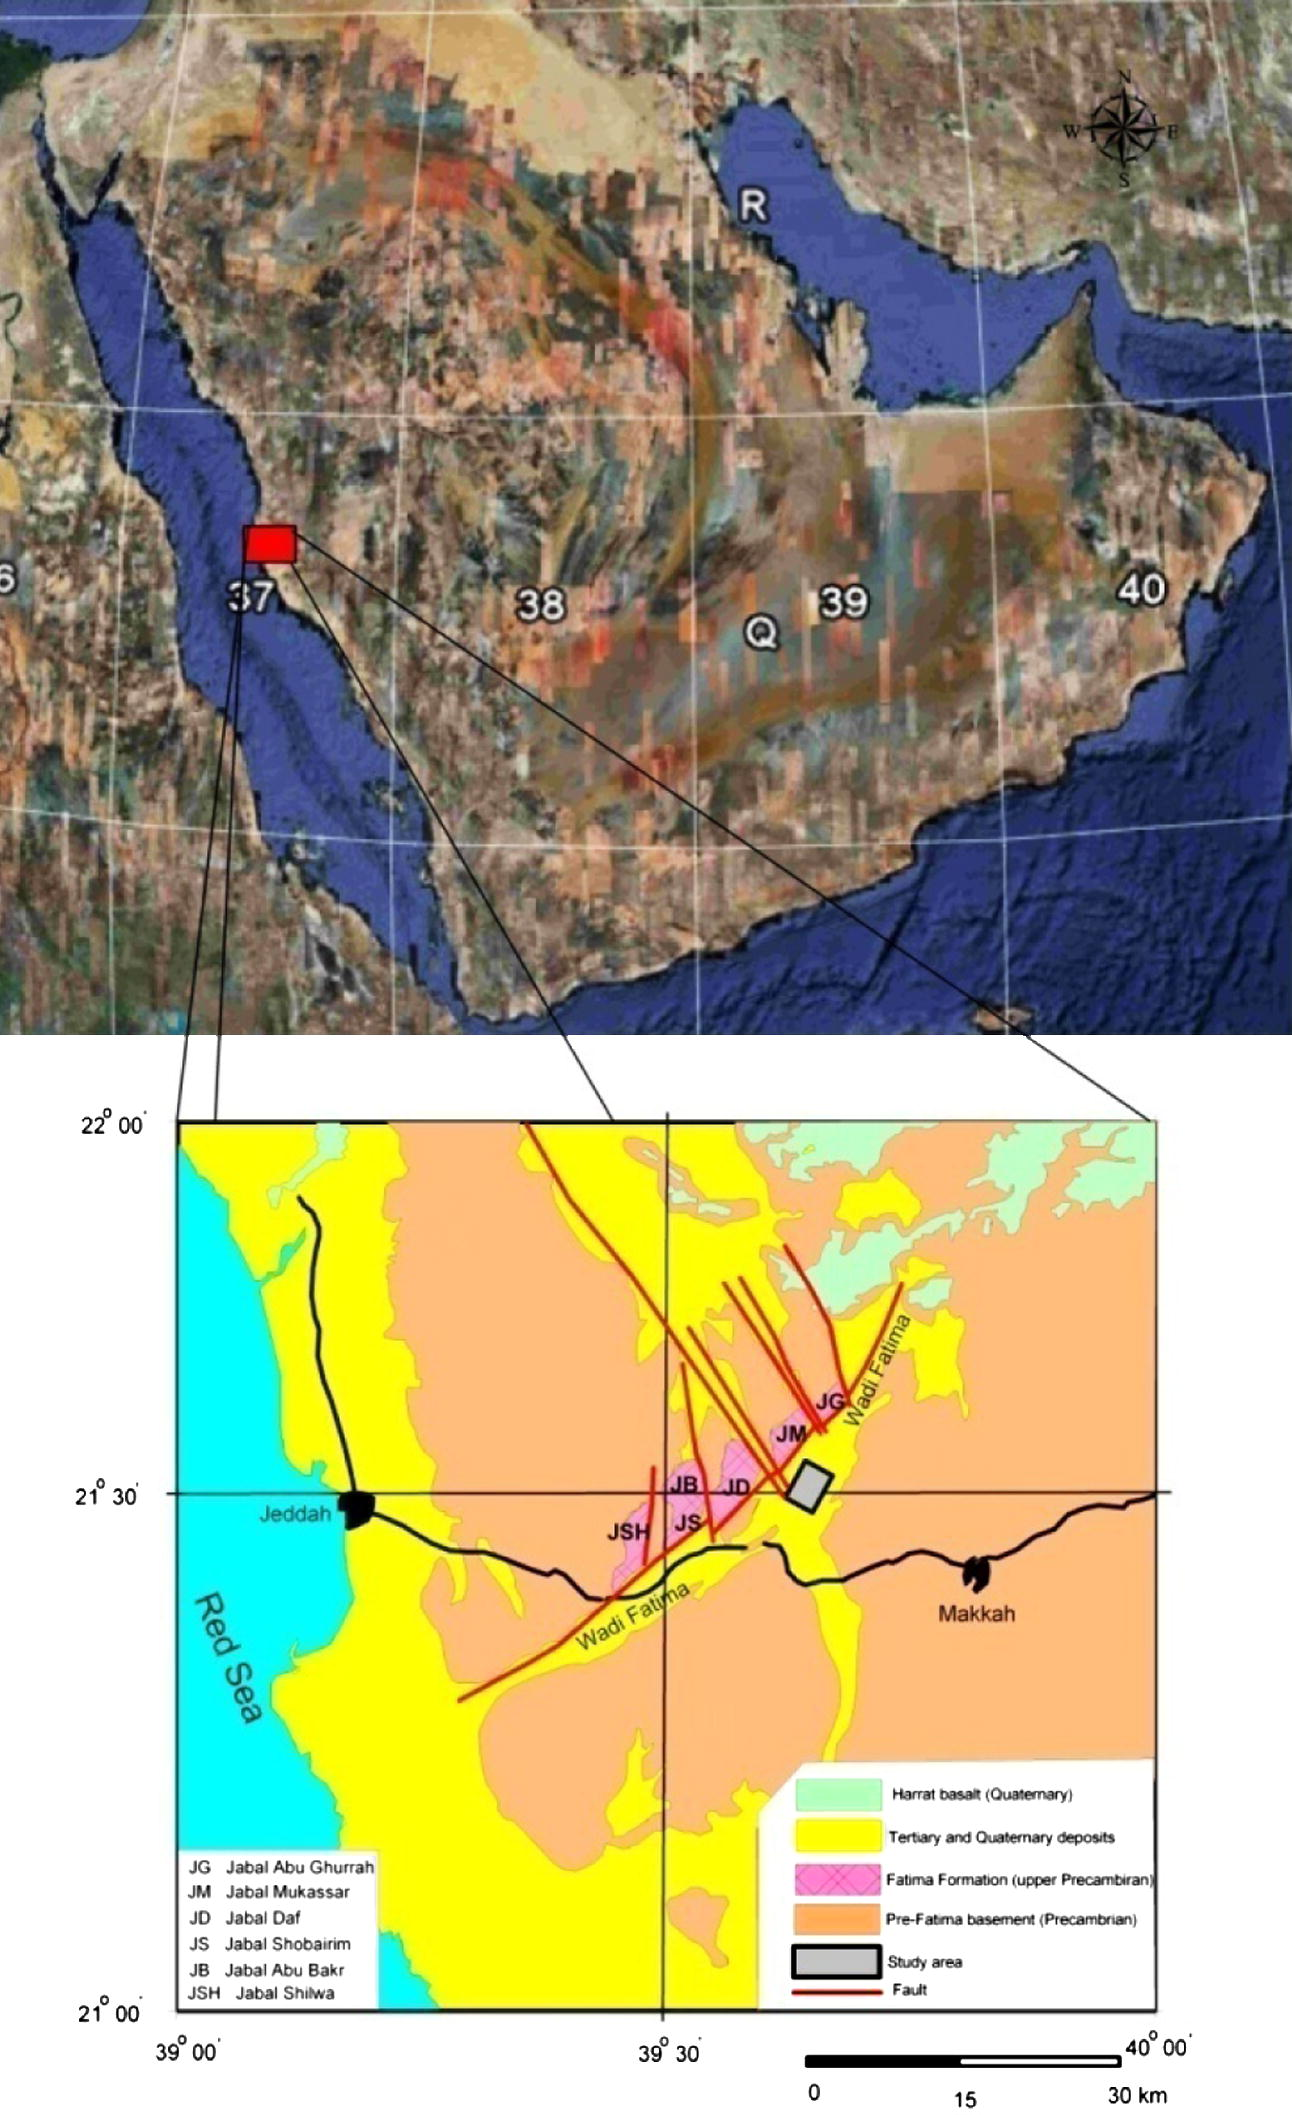
Location and the geological map of the study area (Nebert et al., 1974).
Magnetic survey is a well known technique to delineate subsurface structures and has been extensively used in many parts of the world namely (Al-Garni, 2004a,b, 2005; Al-Garni et al., 2005; Al-Garni et al., 2006; Al-Garni, 2009, in press; Sultan et al. 2009, and many others). In this study, different algorithms have been applied to delineate the subsurface structures of the studied area. Analytic signal, reduce-to-pole, 3D Euler deconvolution, and fine edge enhancement of the subsurface structures using normalized statistics, have been used to estimate the depth and the structure indices of the causative targets.
Wadi Fatima has a NE-SW trend with downstream towards the SW and ending into the Red Sea (Fig. 1). It is considered as a major fault bounded graben with a length of about 50 km and reaches almost 10 km in width at the Red Sea. There are numerous NW–SE faults, which are related to the Red Sea tectonics, dissect the NE–SW major graben fault. These faults trend affect the rock exposures in the NW side of the study area, building several separated mountainous blocks (Fig. 1) (Nebert et al., 1974). These blocks are represented as masses of granite and mainly outcropping at the northern side of the study area where the basement rocks are covered by successions of sedimentary and meta-sedimentary rocks (Al-Garni, in press). It is obvious that the study area has highly deformed and fractured basement rocks. Therefore, magnetic survey was proposed to outline the framework of these structures and estimate their depths.
2 Survey layout
The study area has undergone detailed magnetic survey. The survey was conducted along eighteen profiles covering the study area. Two units of GEM's proton precession magnetometers system were used in this survey where one unit was setup as a base station and the other was used for survey along profiles. A total of more than 1047 measurement points of observation were recorded with station interval of 20 m and 50 m as interline distance, whereas a total of 1246 stationary readings at 60 s interval were recorded using the base station unit. The survey was subjected to corrections for diurnal and micropulsation time variations. These corrections are required if the anomalies of interest are typically less than 20–50 gammas (Breiner, 1973) or if the profile lines are very long or if the objective of the survey is to have a high quality magnetic contour map, truly expressive of deep-seated anomaly sources.
The discreet raw data in time-domain were filtered in the same-domain using a series of robust filters of a special MATLAB set of codes, to remove the man-made source of noise. The rover and base stations readings were checked to remove any further effects due to artificial objects. Furthermore, the International Geomagnetic Reference Field (IGRF) of the study area was then removed from the reduced to diurnal magnetic data using the 10th Generation, revised (2004). In the present ground magnetic survey, and due to the relatively small spatial extent of the surveyed area, the coordinates of 22° 12′ N, and 39° 10′ E were used as the base coordinates for IGRF calculations for the whole survey grid. The elevation is taken as 0 km from ground surface. The geomagnetic field parameters were calculated for the study area using the above equation and listed as: declination = 2.55°, inclination = 30.35°, horizontal intensity = 34812.1 nT, north component = 34767.1 nT, east component = 1769.3 nT, vertical component = 20571.6 nT, and total field = 40436.1 nT. Fig. 2 shows the total magnetic intensity (TMI) map of the study area where diurnal correction, IGRF added, and Gaussian filtered (to damp the minor field variation) were applied.
3 Qualitative interpretation
Qualitatively the corrected total intensity map (Fig. 2) shows the magnetic field amplitude, which reaches 380 nT, where it is relatively high compared with its spatial distribution of the survey. The map shows an acute variation in the magnetic intensity, indicating variations in either lithology or basement topography. These variations can be classified into distinctive zones, as shown on the TMI map (Fig. 2). There are three different zones based on the magnetic intensity variations, which are possibly related to the zones of structural variations based on the geologic investigations. The highest magnetic intensity values are located at the north east part of the study area (Zone A) where most of the wells are dry (according to the site investigations). It may represent very shallow basement with a very rough topography. This feature was referred to as “body or structure X” in the magnetic survey, and was confirmed through drilling to be an andesitic body (or sheet/sheets) of high magnetic susceptibility, acting as the sources of these intense variations in the magnetic intensity that varies from 40,490 to 40,655 nT. It seems that there are considerable variations in the subsurface magnetic sources. To the west of this zone, Zone B is located. It is characterized by relatively low magnetic anomaly amplitude, indicating that there are relatively deep and or/non magnetized source and/or basement with a slope directed toward west. This is followed to the south by a very low magnetic anomaly (40,280 nT), and referred to as zone C. This zone is circular in shape and crossed by about 9 profiles (P1 to P9) of the study area. Zone D is located to the West of both zones B and C. It is relatively of high magnetic intensity (40,385 to 40,460 nT). As this zone is located far to the western border of the study area, the anomaly detected at this zone was not completely surveyed.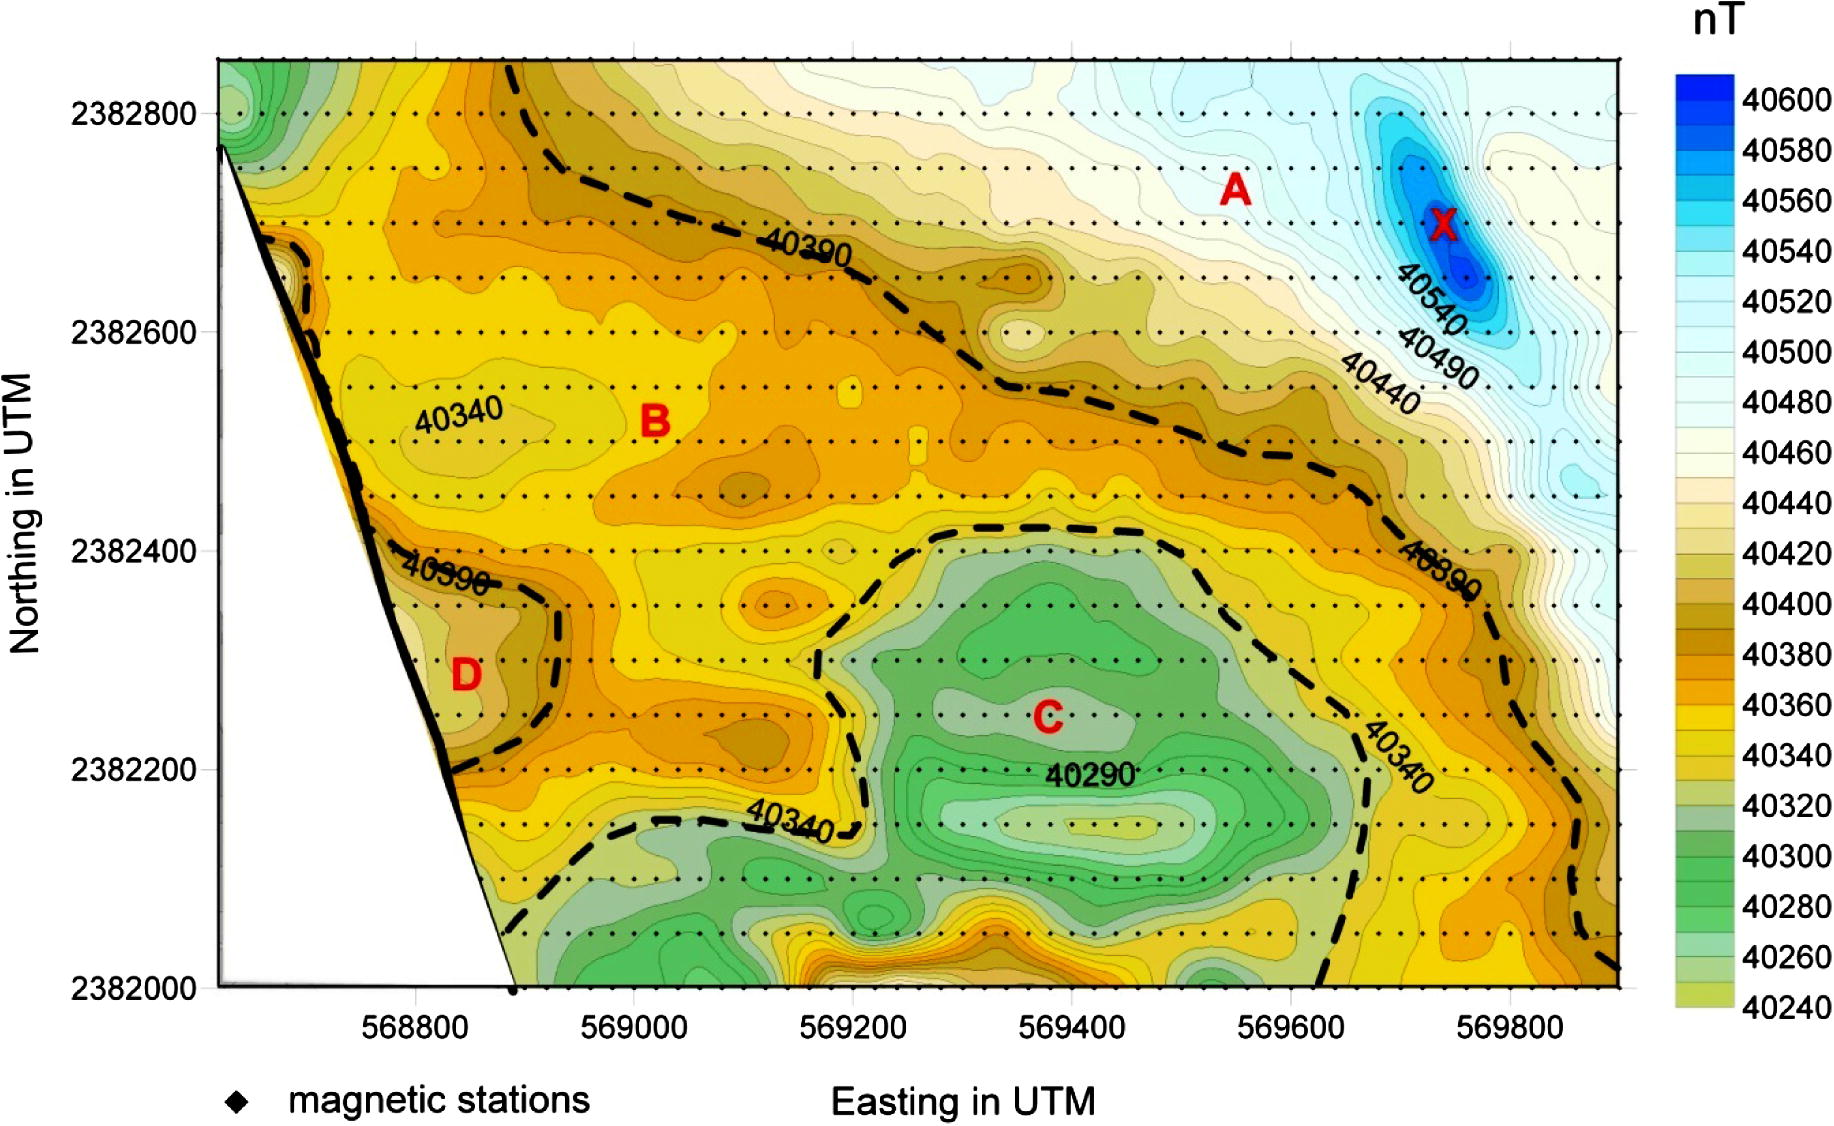
Total intensity ground magnetic map for the study area: diurnal corrected, Gaussian filter applied, IGRF added.
4 Data processing and quantitative interpretation of results
In order to qualitatively interpret the magnetic data such as estimation of the structural setting and the depth to the magnetic sources, analytic signal, reduced-to-pole, 3D Euler deconvolution and fine edge enhancement of the subsurface structures using normalized statistics filters, were implemented.
4.1 Analytic signal
The analytic signal was calculated for the target area of interest to extract the location of magnetic sources contacts or edges. A short introduction to the method used is given below:
The analytic signal method uses the square of the analytic signal amplitude defined as
For total field anomaly data, KA = [2kF(1 − cos2i sin2a) sind]2, where d is the dip of the contact, i is the inclination of the geomagnetic field, and a is the angle between the profile direction and magnetic north. When applied to the observed magnetic field, the analytic signal method generally produces good horizontal locations for contacts and sheet sources regardless of their geologic dip or the geomagnetic latitude (AS-MAG). Depths are accurate for contacts, and are too shallow for most other source types. Dipolar effects are absent. Analogous to the horizontal gradient method, the analytic signal method can be applied to the pseudogravity field, or to the first vertical integral of the magnetic field, to have more accurate depths to sheet sources. Fig. 3 shows some of the possible magnetic contacts.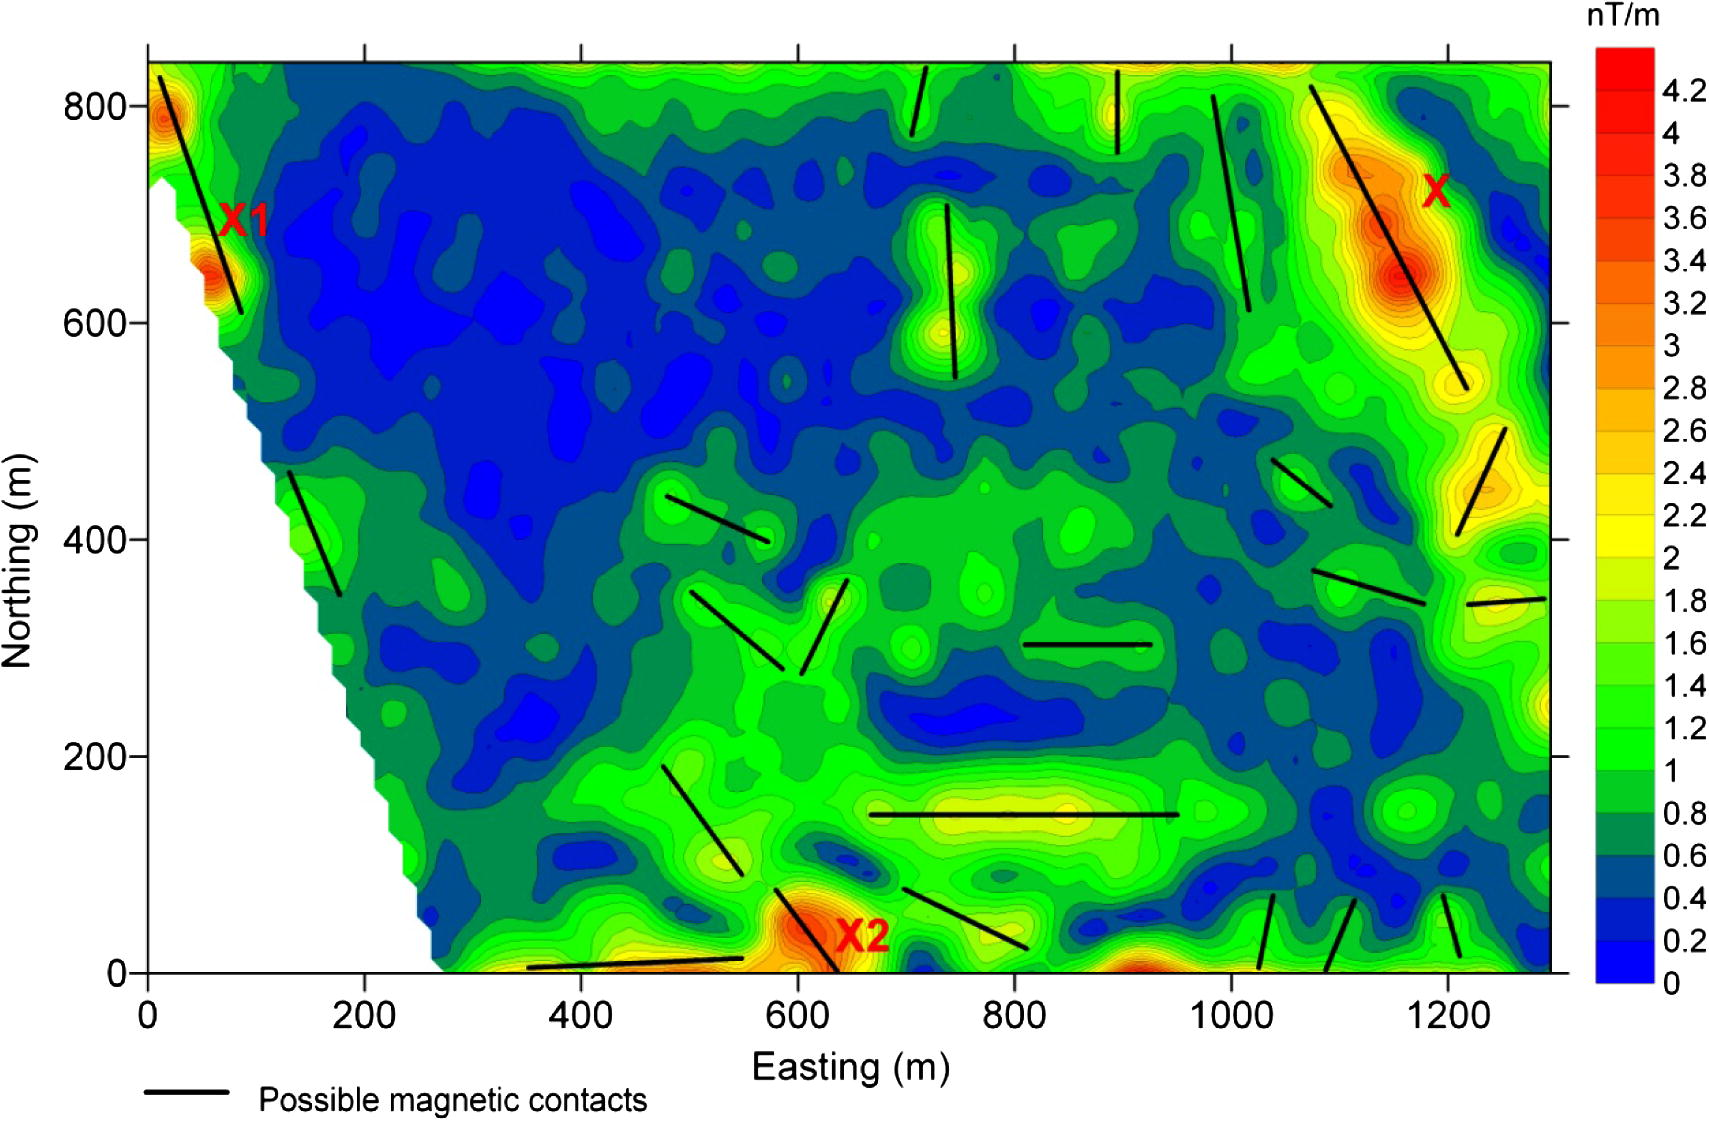
Analytic signal analysis of the studied area.
Analysis of the analytic signal confirm the existence of abnormal limiting/or bounding structures (anomaly peaks). These lineaments/contacts are in correlation with the magnetic bodies X, X1, and X2. Body X was confirmed from drilling to be of andesitic composition. Zones X1 and X2 may have the same composition, yet their spatial distribution is not large.
4.2 Reduction to pole filter
To minimize the dipolar nature of the field, the reduced-to-pole (RTP) magnetic anomaly map is calculated for a regular grid of the total intensity map. A MATLAB function is used to diskewed the field based on the Fourier transform. The declination = 2.55°, and inclination = 30.35° that were determined from the IGRF calculations are used. The filter transforms a regular gridded total-field anomaly (extracted from the original map) into new anomalies with new directions of magnetization and ambient field. The following steps were used: (1) Fourier transform applied to the field data, (2) multiplying by the phase filter, and (3) inverse Fourier transforming the product. Anomaly values are specified on the rectangular grid with (UTM East) and (UTM North) axes directed east and north, respectively. The final map is shown in (Fig. 4). To produce such a map, a regular grid of 100 × 71 cells was used where such a filter requires a regular grid to be successfully applied.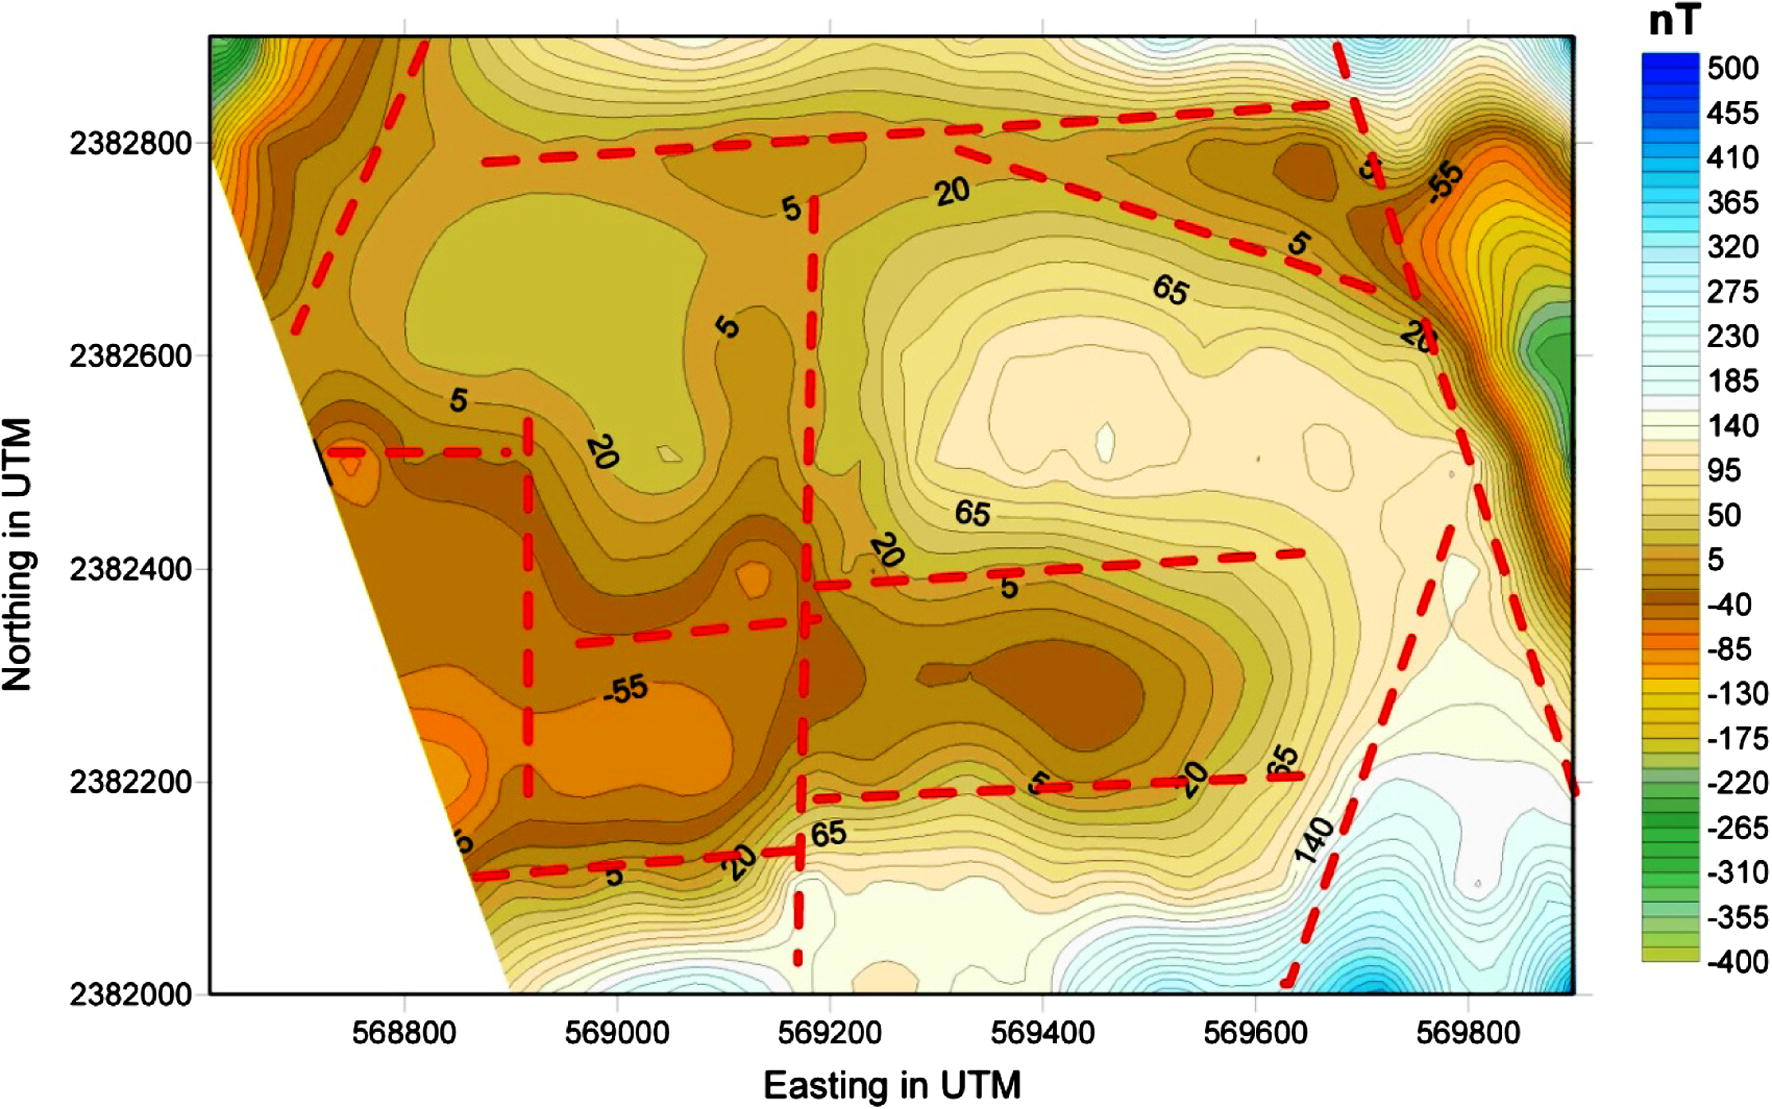
Reduced-to-pole magnetic anomaly map, with IGRF reduction.
The area under study and surrounding were subjected to various tectonic events along the geologic time. Each of these tectonic events has changed the structural setting of the area where these changes were appeared on the RTP magnetic contour map (Fig. 4). The extension and density of the magnetic contour lines reveal these variations. Accordingly, the subsurface structural configuration of the basement structures beneath the study area was traced by the extensions and density of the contour lines. The interpretation of magnetic anomaly map preliminary began with a visual inspection of the shapes and trends of the major anomalies. After delineating the structural trends, a closer investigation about the characteristic features of each individual anomaly was carried out. These features represent the relative locations and amplitudes of the positive and negative contours of the anomaly, the elongation and aerial extent of the contours and the sharpness of the anomaly as seen by the spacing of contours (Sharma, 1976). The following considerations are taken into account:
-
–
In sedimentary regions, particularly where the basement depth exceeds 1.5 km, the magnetic contours are normally smooth and variations are small, reflecting the basement features rather than those of the near-surface (Telford et al., 1990). The magnetic relief observed over sedimentary basin areas is almost always reflects more the lithology of the basement rather than its topography (Dobrin and Savit, 1988). Meanwhile, the regions where igneous and metamorphic rocks predominate, usually show complex magnetic variations. Deep features are frequently hidden by higher frequency magnetic effects of those of the near surface (Telford et al., 1990).
-
–
Changes in the magnetization of basement rocks a kilometer or more deep may result in magnetic anomalies up to several hundreds gammas (nT) in magnetic readings at the surface. The density of contour lines often provides a useful criterion about the structures. The closer the contours, i.e., the greater the gradients, the shallower, in general, is the source. Any sudden change in the spacing over an appreciable distance suggests a discontinuity in depth, possibly a fault (Dobrin, 1960).
-
–
The magnetic anomalies of large areal extent reflect a deeper source than small-size anomalies (Vacquier et al., 1951).
-
–
Often, a well-defined boundary between zones with appreciably different degrees of magnetic relief can indicate the presence of a major basement fault (Dobrin and Savit, 1988).
The reduced-to-pole total-intensity aeromagnetic contour map (Fig. 4) is outlining the discontinuity lines which divide the study area into characteristic structural zones. These zones represent the outlines of the local and regional variations in basement structures beneath the study area. Fig. 4 shows that the NNW–SSE, N–S, and E–W to ENE–WSW are the main trends in the studied area where it represents lineament structure map of the studied area obtained through the interpretation of the TMI map.
Magnetic contours may be drawn out along the fractures, or individual anomalies which may be aligned in relation to fracture system (Hall, 1964). An observed magnetic pattern represented on magnetic contour map is the reflection of the contrasts in magnetic properties of rocks. The observed structural features of the area are reflected significantly in the pattern, where the trends and intensities of magnetic anomalies are shown on the aeromagnetic maps (Danzalski, 1966).
Fig. 4 shows the long regional trends which control the subsurface structure beneath the studied area. In this study, NNW–SSE, N–S, and E–W to ENE–WSW are the dominant trends affecting the study area. The relationships among these three trends suggest that the area was subjected to more than a single tectonic event.
4.3 3D Euler deconvolution and depth estimation
Euler deconvolution provides estimates of geometrical parameters for elementary causative bodies, from magnetic anomalies and their horizontal and vertical derivatives. This method assumes that the anomaly is a homogeneous function of spatial coordinates. The method is originally reported by Thompson (1982) and Reid et al. (1990). In order to detect the depth to the causative magnetic bodies, that were detected from derivative analysis and analytic signal, 3D Euler deconvolution technique is applied (Gerovska and Bravo, 2003).
The total field intensity map of the study area was re-digitized to 100 × 66 even data points from the TMI map (Fig. 2). The Euler deconvolution was applied with window chosen as 6 × 6 grid data points in the x and y-direction, respectively. It was chosen not to increase the window size which leads to including many interfering singular points in one window. The grid spacing in both x and y-directions is 0.013 km. The partial horizontal derivatives of the field were calculated after approximating the field with bicubic splines. The vertical derivative is obtained in the frequency domain, using a standard filter. The procedure overcame the problem with the edge effects by extending the grid 10% in each direction with half a cosine function before the vertical derivative calculation. The extended area of the chosen grid is then clipped back to the initial grid size. The survey height is taken as zero.
The necessary arguments and parameters for carrying out the deconvolution are:
-
Acceptance Level. It represents the maximum value allowed for the relative standard deviation (in relation to the estimated depth) weighted by the estimated structural index. This is taken as 0.05 and it is an empirical criterion as suggested by Thompson (1982). This value is compared to a threshold value, τ = 0.009 for second cluster stage to eliminate highly dispersed solutions.
-
ρmic, fraction of grid spacing parameter to be used in the microscale clustering. When multiplied with the grid spacing, it gives the maximum horizontal distance allowing two solutions belonging to the same cluster. ρmic is taken as 1 scale unit in the present analysis.
-
ρmac, this is used in the cluster fusion after multiplication by the maximum horizontal radius of confidence of all the clusters. It calculates the maximum distance which allows for two clusters to be fused. This is taken as 1.
-
ρz, a scaling factor to convert the depth to circles with radii proportional to the depths in the 2D graph representations. This is taken as equal to 0.5 units. (1 unit = 13 m).
The inclination and declination of the study area are 2° 55′ and 30° 35′, respectively. The new deconvolution technique was applied where many dispersed solutions can be observed in the study area especially to the northern and northeastern zones. Figs. 5–10 represent the complete analysis using 3D Euler deconvolution. Fig. 5 shows the depths to magnetic sources whereas Fig. 6 shows the calculated structural indices. The common accepted structural element in the studies area is fault/or magnetic contact/thin sheet (Fig. 7) and that can be seen in Table 1. Figs. 8 and 9 show that the data are well clustered (after second cluster stage) after rejecting the dispersed solutions, moreover the confidence level of the clustered solutions is generally accepted (Fig. 7). Fig. 10 summaries the final cluster indices of the accepted solutions as grouped from G1 to G12. The average depth as obtained from this final clustering solutions is 21 m, and average structure indices 0.0.36, indicating a magnetic contact model (Reid et al., 1990). Cluster index G9, represents the most common structural element (35 point solution). It has an average depth 28.93 m and average structure index 1.03. Table 1 summarizes the numerical results of such an analysis. Table 2 gives the results of the present analysis that are classified for each group. NumPoi: number of points. Xave: average x value. Xcon: confidence interval for variable X. Yave: average Y value. Ycon: confidence interval for variable Y. Zave: average z value. Zcon: confidence interval for variable Z. Nave: average estimated structural indices for each cluster. Ncon: confidence interval for estimated structural indices N.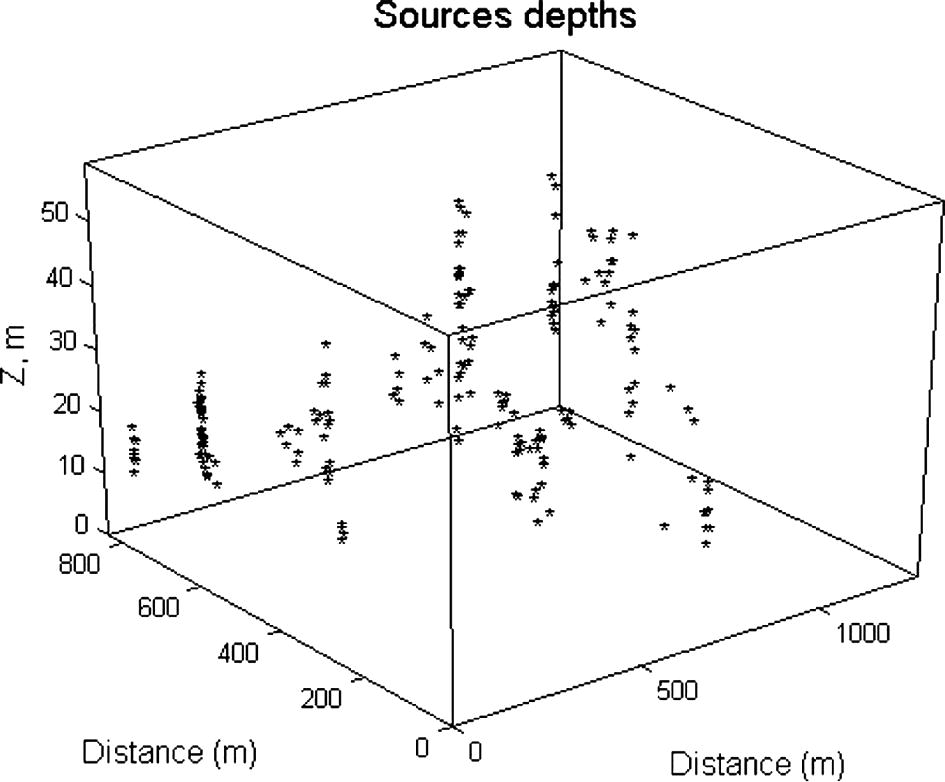
Source depths solutions.
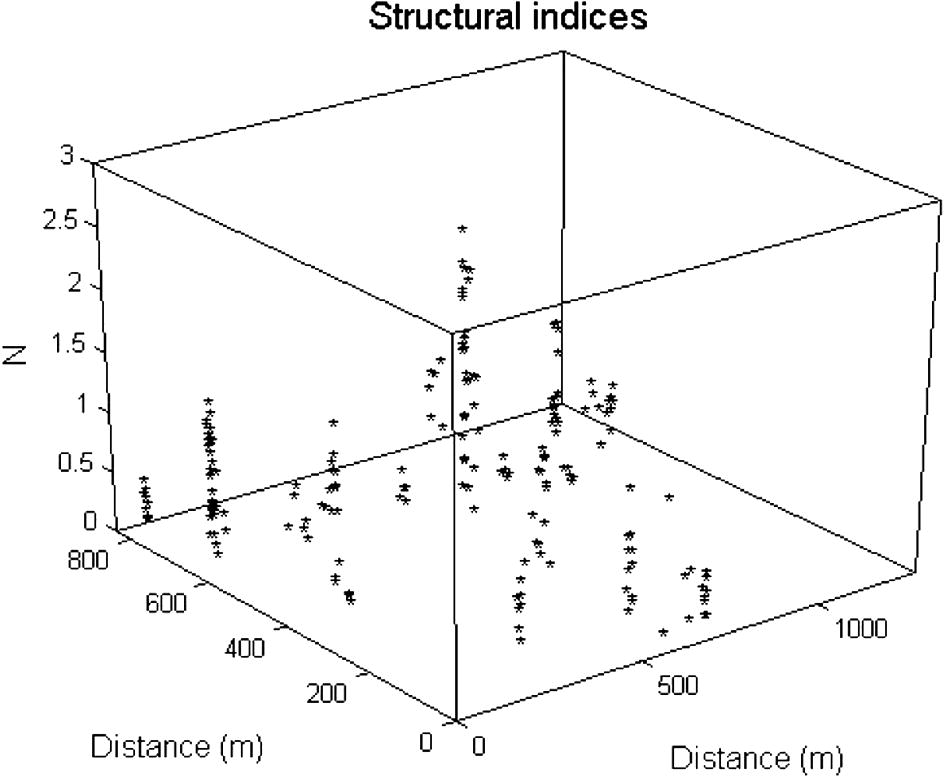
Calculated structural indices.
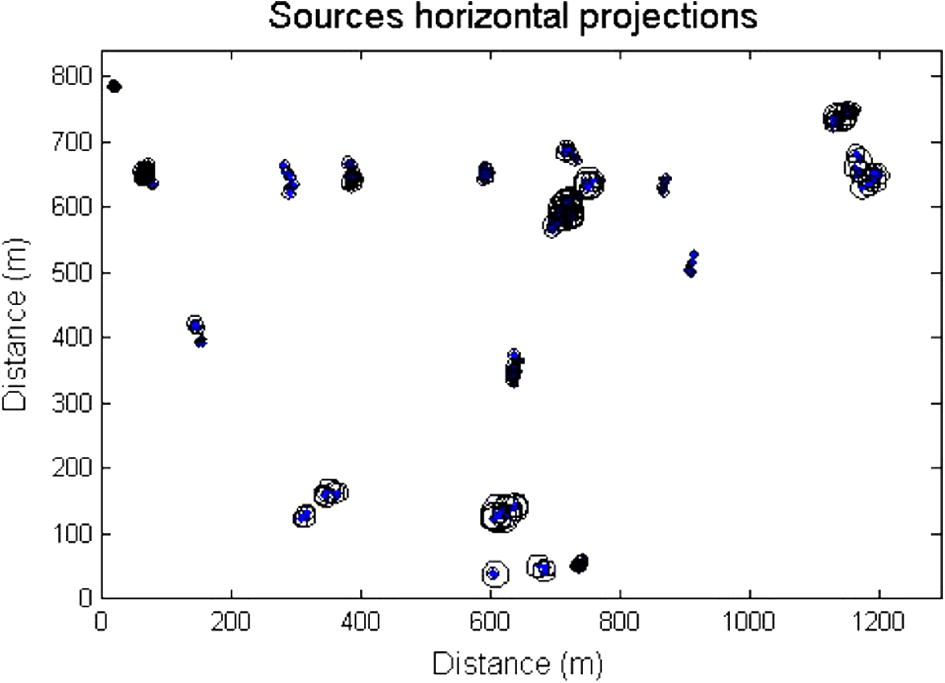
Source horizontal projections of the accepted solutions.
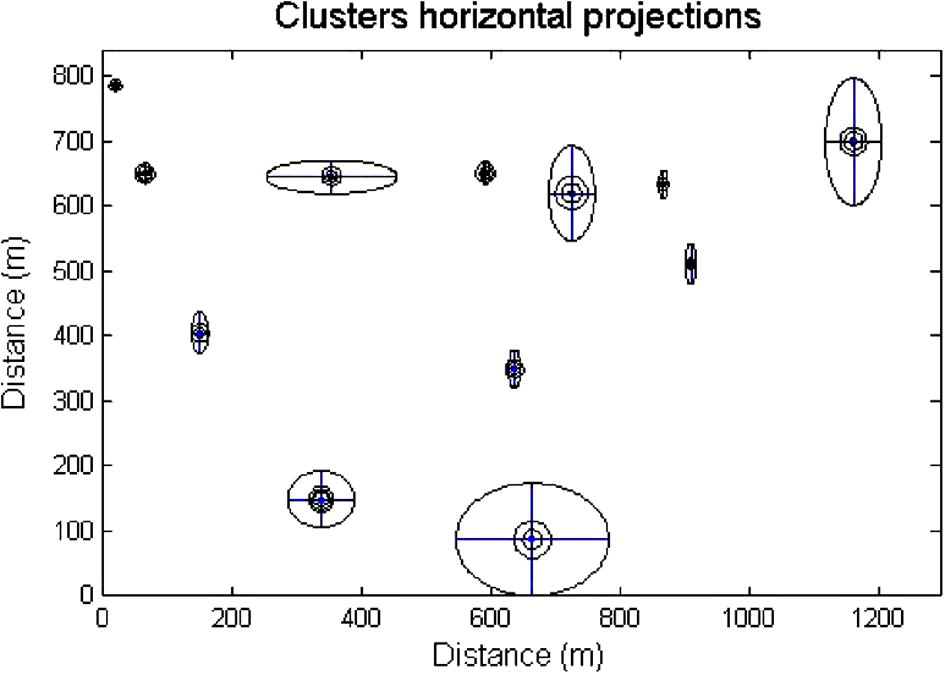
Cluster horizontal projections of the accepted solutions.
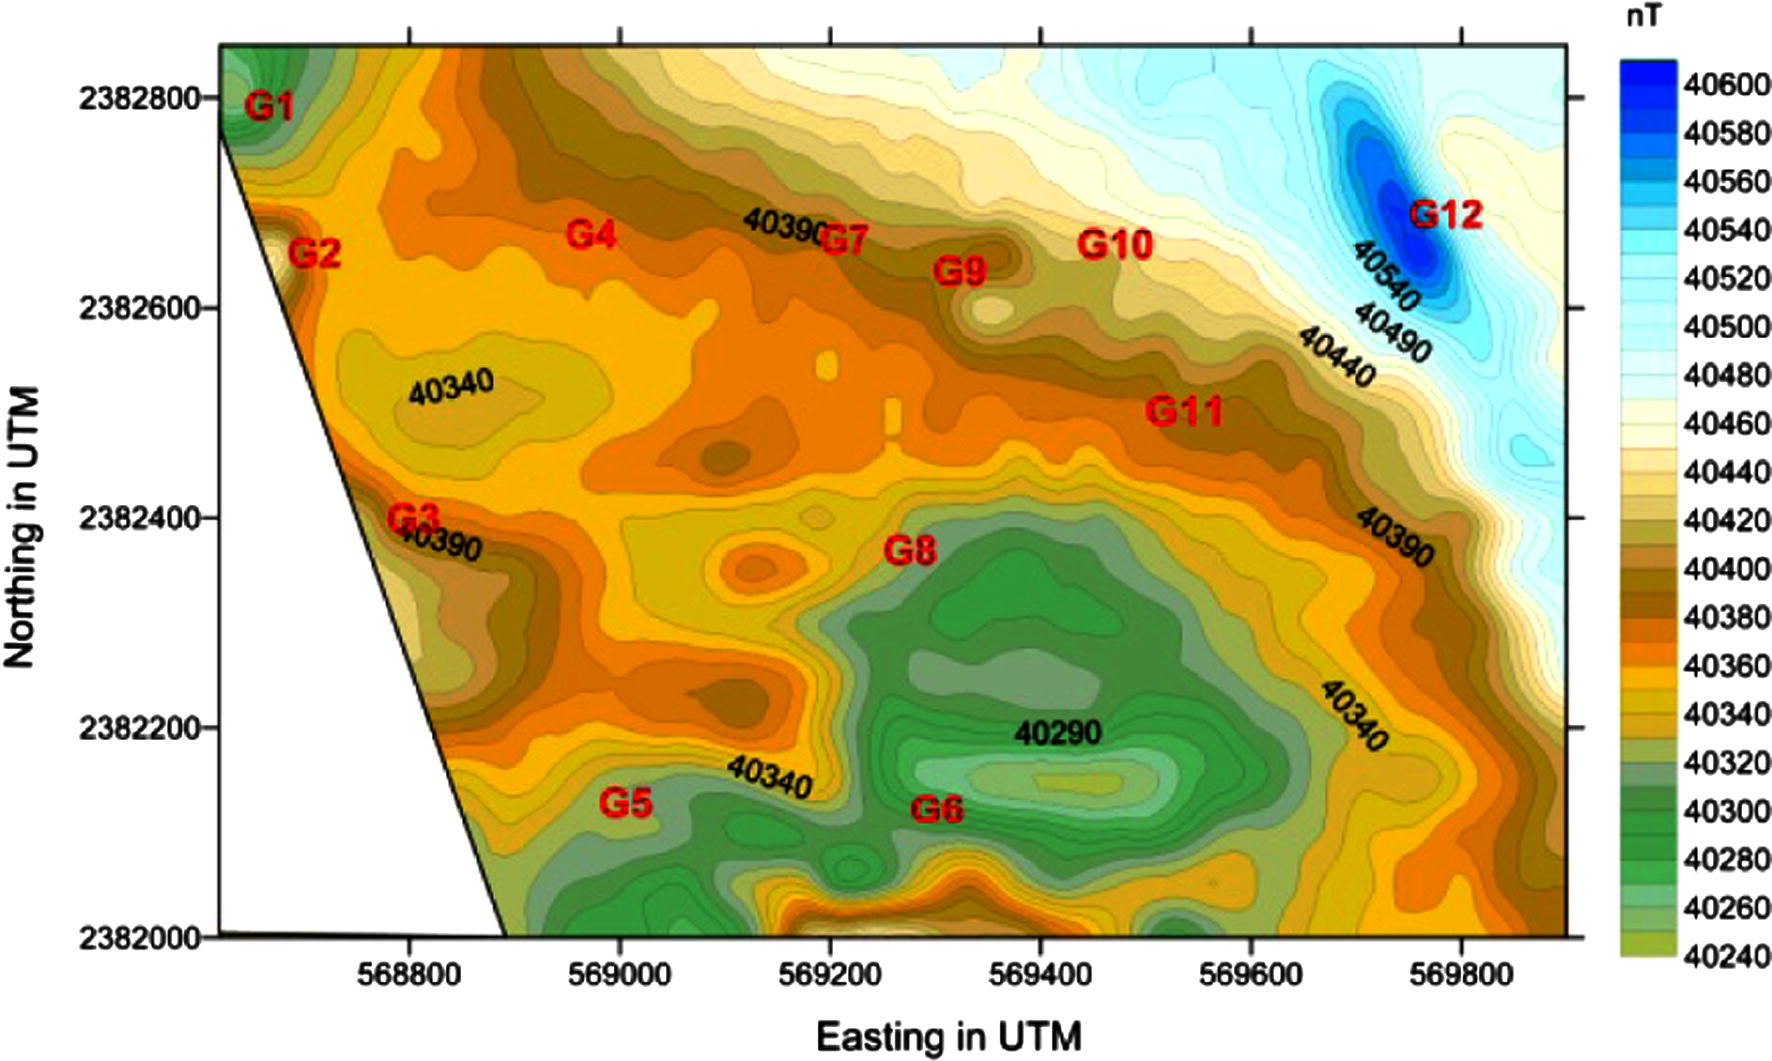
Final cluster indices of the accepted solutions, posted on TMI map.
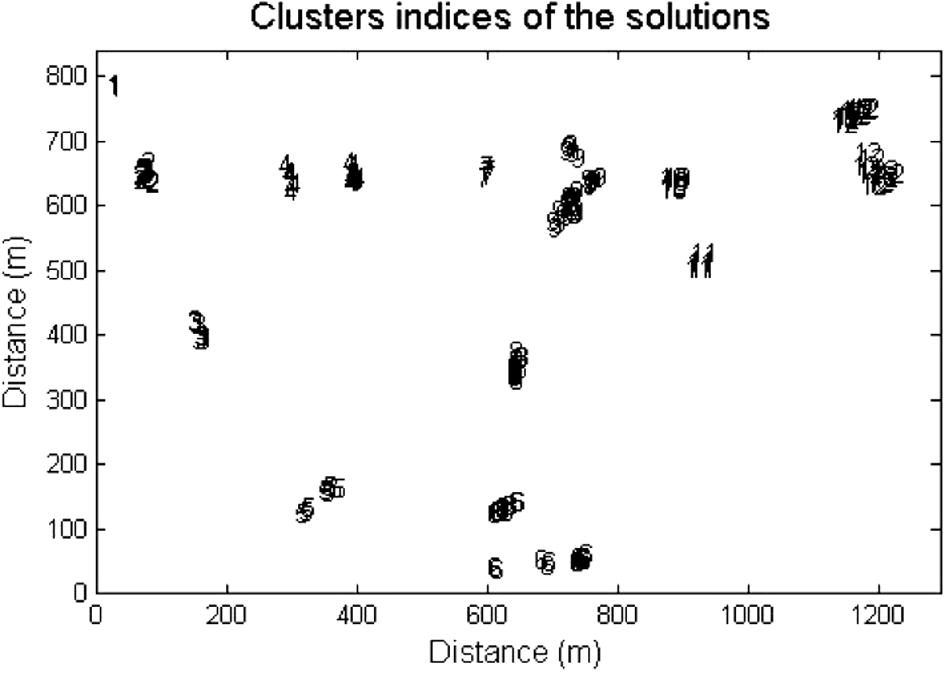
Final structural indices of the accepted solution.
Clusters index
NumPoi
Xave
Xcon
Yave
Ycon
Zave
Zcon
Nave
Ncon
1
8
785.48
2.48
20.61
4.07
14.20
5.47
0.28
0.27
2
32
649.91
13.11
66.43
9.50
21.08
9.31
0.69
0.72
3
7
405.13
32.37
150.90
12.04
15.91
11.24
0.13
0.23
4
18
644.79
25.75
354.49
100.35
18.37
9.86
0.30
0.49
5
8
148.54
43.28
338.53
51.37
29.72
8.46
0.31
0.43
6
24
86.83
86.38
664.94
117.19
30.20
26.12
0.33
0.63
7
5
651.24
18.14
592.57
5.04
20.10
8.06
0.12
0.28
8
13
349.72
28.35
637.09
8.68
15.76
10.69
0.50
0.76
9
35
619.65
72.23
725.70
35.45
28.93
20.99
1.03
1.19
10
6
634.27
21.44
867.37
6.80
12.77
5.12
0.07
0.15
11
5
511.32
29.63
910.14
8.28
13.85
2.58
0.21
0.10
12
26
699.18
97.59
1160.76
43.04
27.64
14.56
0.35
0.55
Group
Zave
Nave
Structure
G1
14.21
0.28
Contact
G2
21.08
0.69
Contact/thin sheet
G3
15.91
0.13
Contact
G4
18.37
0.30
Contact
G5
29.72
0.31
Contact
G6
30.20
0.33
Contact
G7
20.10
0.12
Contact
G8
15.76
0.50
Shallow contact
G9
28.93
1.03
(Sill/dike)
G10
12.77
0.07
Contact
G11
13.84
0.21
Contact
G12
27.64
0.35
Shallow contact
4.4 Fine edge enhancement of the basement using normalized statistics
Many filters are available to enhance subtle detail in potential field data, such as downward continuation, horizontal and vertical derivatives, and other forms of high-pass filters. A commonly used edge-detection filter is the total horizontal derivative (TDX),
Miller and Singh (1994) introduced the tilt angle, amplitude normalized vertical derivative:
Because the tilt angle is based on a ratio of derivatives, it enhances large- and small-amplitude anomalies as well. The tilt angle is effective in balancing the amplitudes of the different anomalies, but it is not primarily an edge-detection filter.
Verduzco et al. (2004) suggest using the total horizontal derivative of the tilt angle as an edge detector (THDR):
The THDR successfully delineates the edges of the largest amplitude anomalies, but its results for the deeper bodies are less impressive. Because the THDR uses derivatives of a derivative-based filter, i.e., the tilt angle, it can enhance also the noise in the data. The theta map (Wijns et al. 2005) uses the analytic signal amplitude to normalize the total horizontal derivative. It is given by:
The drawback of this filter is that the response from the deeper bodies is usually diffused.
4.5 Edge enhancement using standard deviation
The windowed computation of the standard deviation of an image is a simple measure of the local variability. It has relatively small values when the data are smooth and relatively large values when they are rough, e.g., over edges. If it is used as an edge detector, the response over large-amplitude gradients will dominate the result, similarly to other filters, e.g., the total horizontal derivative. Tense, using a filter based on the ratio of related normalized standard deviations (NSTD) to make large- and small-amplitude edges visible simultaneously (Cooper et al., 2008). This is given by:
The standard deviations σ in the above equation (Eq. (8)) are computed using a moving square window of data points. The standard deviation can be computed in a given direction (to preferentially enhance edges normal to that direction). Larger windows are less sensitive to noise than the smaller ones but smear out edges are smaller than the window size. Using a moving window to compute the standard deviation yields a border loss of approximately one-half of the window size around the image edges.
This filter is applied to the RTP map of the study area for fine detection of sharp edges in the magnetic data. The NSTD clearly gives valuable resolution of the edges of the deeper sources (Fig. 11). The filter was applied with windows W = 3, 5, 9, and 11 units (1 unit = 13 m) to show filter effect on edge resolution. Very high resolution of the normalized SD map (Fig. 11a) is noticed for W = 3. A large number of edges and fine basement topography can be recognized. By increasing the window size the fine details are damped and only the major basement features still appear on the map. This is clearly shown in Fig. 11b–d where the bounding features (North, West, and East) are clear.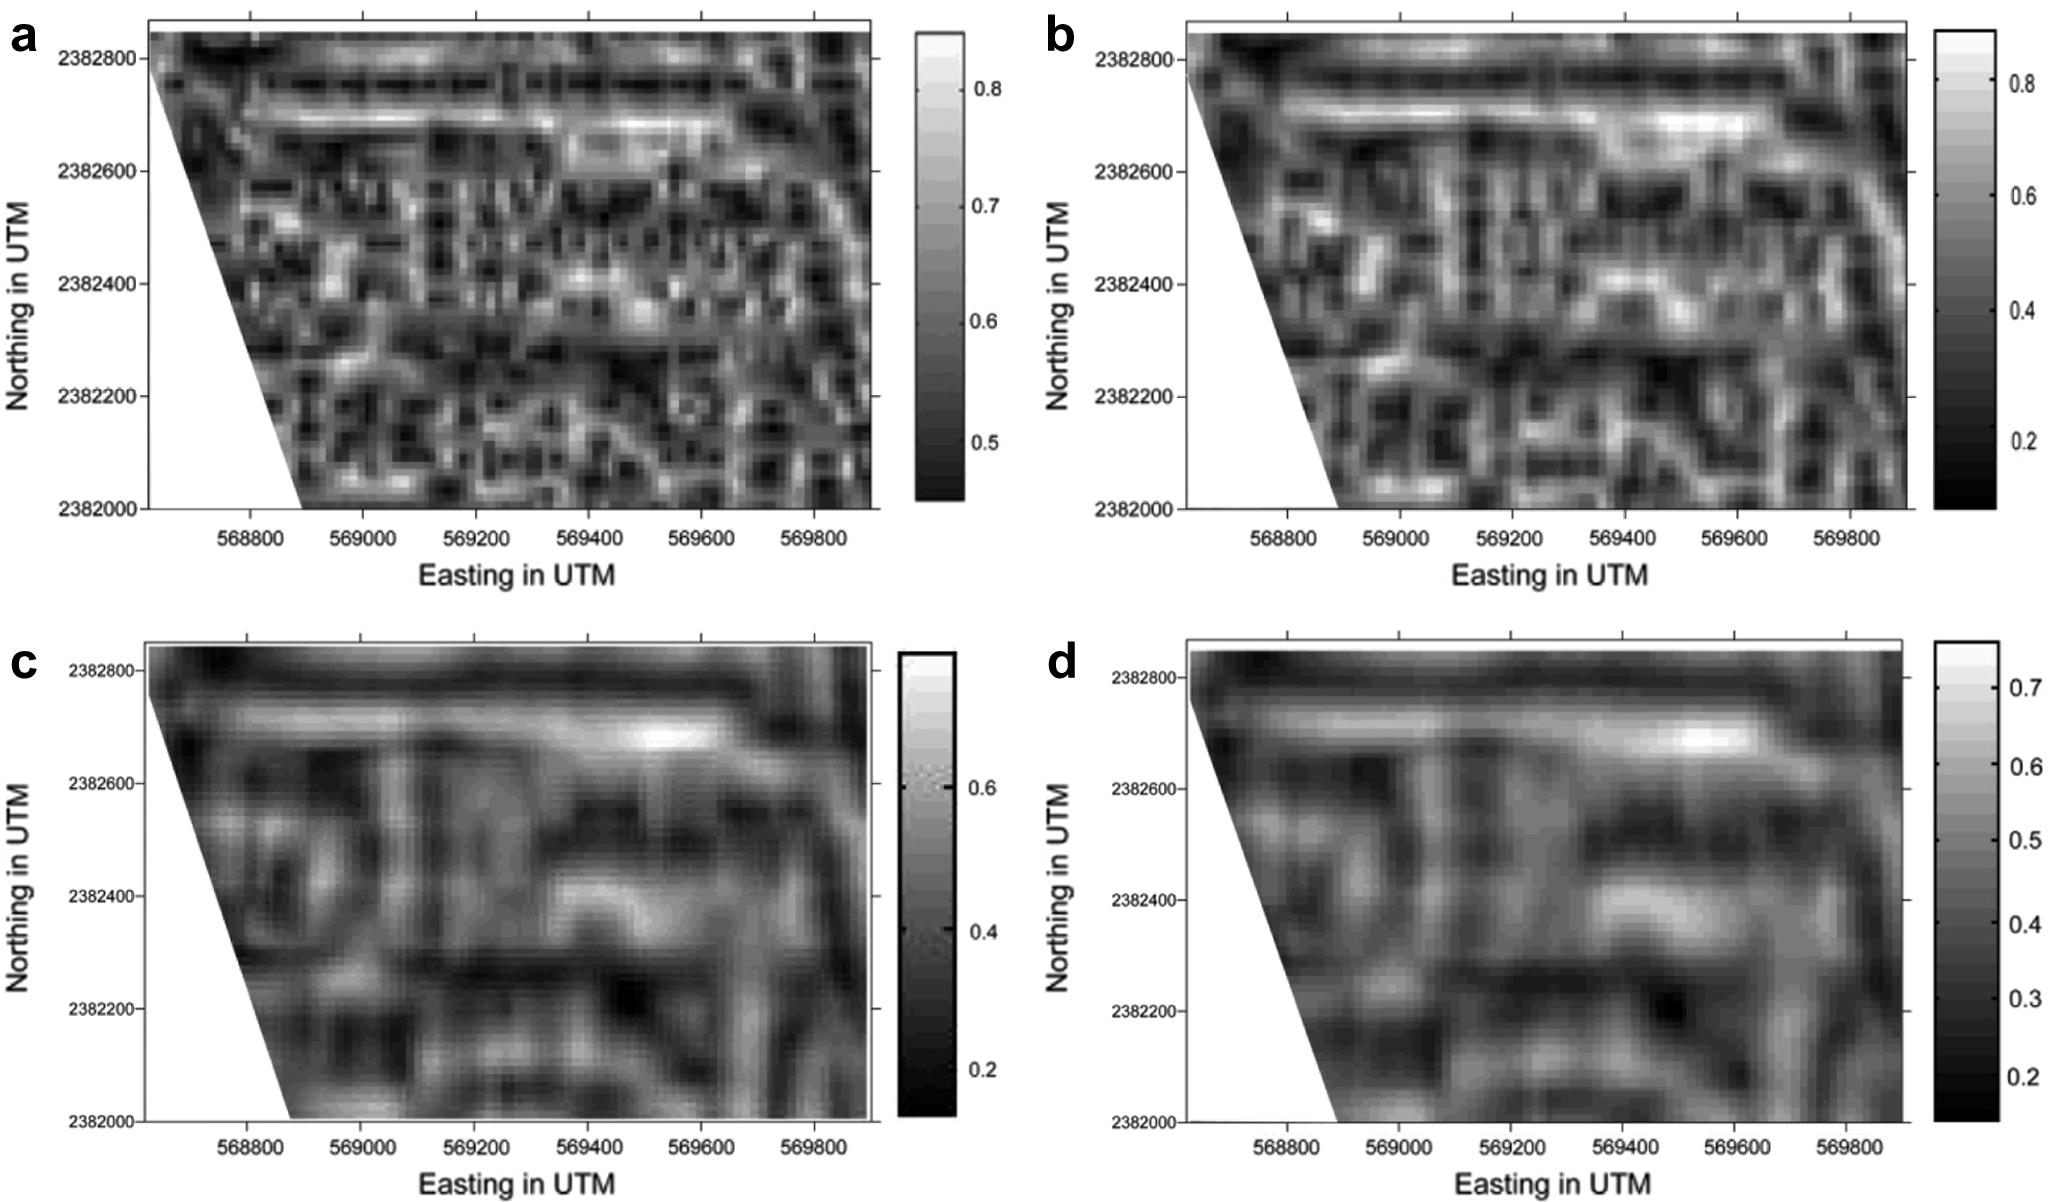
Normalized SD solution using (a) window = 3 units, (b) window = 5 units, (c) window = 9 units, and (d) window = 11 where 1 unit = 13 m.
5 Discussions and conclusion
In arid/semi arid areas, the groundwater flow is almost controlled by the subsurface structures. In order to delineate the subsurface structures and the depth to the magnetic basement rocks of study area, magnetic survey was carried out along profiles with a net-like survey, covering the study area. In this study, various algorithms were applied to the magnetic data to delineate the subsurface structures and estimate the depth to magnetic sources. Reduction to pole was implemented on the field data to remove any skewness related to magnetic inclination.
To minimize the dipolar nature of the field, the Reduced-To-Pole (RTP) magnetic anomaly map is calculated for a regular grid of the total intensity map. The RTP magnetic contour map was used along with the standard deviation to outline the discontinuity lines which divide the study area into distinct structural zones. These zones represent the local and regional variations in basement structures beneath the study area. The longer trends define the regional trends which relate to the subsurface structures beneath the studied area. Lineaments structure map of the studied area delineate three structural trends. The NNW–SSE, N–S and E–W to ENE–WSW are the main trends in the studied area. The relationships among these three trends suggest that the area was subjected to more than a single tectonic event.
3D Euler deconvolution was used not only to delineate magnetic contacts but also for estimating the structural indices and the average depths of magnetic sources. The calculated structural indices show that the area is affected mainly by contacts/thin sheet and minor sills. Furthermore, the calculated average depths of the magnetic sources show that these magnetic sources vary from ≈15 m to ≈31 m in depth. Edge enhancement using standard deviation was used mainly to delineate magnetic contacts.
Magnetic survey with application of different algorithms has given a clear picture of the subsurface structures that might control the groundwater flow and would be used as a guidance for electrical survey.
Acknowledgments
The author would like to thank the poultry of Wadi Fatima corporation for supporting this study. Many thanks go to Prof. Mohamad Gobashy and Prof. Hamdy Hassanein of the King Abdulaziz University for their helpful discussions. Also, the author would like to thank the two anonymous reviewers for their helpful comments which definitely improved the original manuscript. Finally, the author is thankful to the staff member of Dept. of Geophysics, King Abdulaziz University.
References
- Al-Garni, M.A., 2004a. Schlumberger sounding and magnetic survey in Wadi Al-Damm, Makkah Al-Mukarramah, Saudi Arabia. Journal of Petroleum and Mining Engineering (JPME) 7, 45–60.
- Al-Garni, M.A., 2004b. Application of magnetic and electrical geophysical methods in exploration of groundwater resources of Wadi Malakan, Sauid Arabia. Journal of King AbdulAziz Univeristy: Earth Sciences 16, 67–93.
- Al-Garni, M.A., 2005. Investigating the groundwater occurrence in Wadi Rahjan and its potential contribution to Ain Zubaida using magnetic and electric methods, KSA, Saudi Arabia. Journal of King AbdulAziz Univeristy: Earth Sciences 18, 23–47.
- Al-Garni, M.A., 2009. Geophysical investigation for groundwater in a complex surface Terrain, Wadi Fatima, KSA: A Case History: Jordan. Journal of Civil Engineering 3, 118–136.
- Al-Garni, M.A., in press. Magnetic and DC resistivity investigation for groundwater in a complex subsurface Terrain. Arabian Journal of Geosciences. doi:10.1007/s12517-009-0071-z.
- Al-Garni, M.A., Hassanein, H.I., Gobashy, M., 2005. Ground-magnetic survey and Schlumberger sounding for identifying the subsurface factors controlling the groundwater flow along Wadi Lusab, Makkah Al-Mukarramah, Saudi Arabia, Egypt. Journal of Applied Geophysics 4, 59–74.
- Al-Garni, M.A., Hassanein, H., Gobashy, M., 2006. Geophysical investigation of groundwater in Wadi Lusab, Haddat Ash Sham Area, Makkah Al-Mukarramah, Arab Gulf. Journal of Scientific Research 24 (2), 83–93.
- Breiner, S., 1973. Applications Manual for Portable Magnetometers.
- Cooper, G.R.J., Duncan, R., Cowan Duncan, R.C., 2008. Edge enhancement of potential-field data using normalized statistics. Geophysics 73 (3).
- Introduction to Geophysical Prospecting. New York: McGraw-Hill Book Company; 1960. 445p
- Introduction to Geophysical Prospecting (fourth ed.). New York: McGraw-Hill Book Company; 1988. 867p
- Danzalski, W., 1966. Interpretation of aeromagnetic in evaluation of structural control of mineralization. Geophysics Prosp. 14 (3), 273–291.
- Automatic interpretation of magnetic data based on Euler deconvolution with unprescribed structural index. Computer and Geosciences. 2003;29:949-960.
- [Google Scholar]
- Hall, D.H., 1964. Magnetic and tectonic regionalization on Texada Island, British Colombia. Geophysics 29 (4), 566–581.
- Miller, H.G., Singh, V., 1994. Potential field tilt – a new concept for location of potential field sources. Journal of Applied Geophysics 32, 213–217.
- The analytic signal of two-dimensional magnetic bodies with polygonal cross-section: its properties and use for automated anomaly interpretation. Geophysics. 1972;37:507-517.
- [Google Scholar]
- Nebert, k., Alshaibi, A.A., Awila, M., Bounny, I., Nawab, Z.A., Sharief, O.H., Sherbini, O.A., Yeslam, A.H., 1974. Geology of the area North of Wadi Fatma, Kingdom of Saudi Arabia. Center for Applied Geology, Ministry of Petroleum and Mineral Resources, Bull. No. 1, 31p.
- Magnetic interpretation in three dimensions using Euler deconvolution. Geophysics. 1990;55:80-91.
- [Google Scholar]
- Sharma, P.V., 1976. Geophysical Methods in Geology. Elsevier Publ. Co.
- Geophysical measurements for subsurface mapping and groundwater exploration at the central part of the Sinai Peninsula, Egypt. The Arabian Journal for Science and Engineering. 2009;34:103-119.
- [Google Scholar]
- Applied Geophysics (second ed.). Cambridge: Cambridge University Press; 1990. 770pp
- EULDPH – a new technique for making computer-assisted depth estimates from magnetic data. Geophysics. 1982;47:31-37.
- [Google Scholar]
- Vacquier, V., Steenland, N.C., Henderson, R.G., Zeitz, I., 1951. Interpretation of aeromagnetic maps. Geol. Soc. Am., Memoir No. 47.
- Verduzco, B., Fairhead, J.D., Green, C.M., MacKenzie, C., 2004. The meter reader – new insights into magnetic derivatives for structural mapping. The Leading Edge 23, 116–119.


