

Translate this page into:
Low cost feedstock for the production of endoglucanase in solid state fermentation by Trichoderma hamatum NGL1 using response surface methodology and saccharification efficacy
⁎Corresponding author at: Department of Botany and Microbiology, College of Science, King Saud University, Riyadh 11451, Saudi Arabia. aelgorban@ksu.edu.sa (Abdallah M. Elgorban)
-
Received: ,
Accepted: ,
This article was originally published by Elsevier and was migrated to Scientific Scholar after the change of Publisher.
Peer review under responsibility of King Saud University.
Abstract
Cellulases hydrolyze cellulosic material and the production is highly expensive than other commercial enzymes. Hence, there is a continuous search for cheap and novel substrates to minimize the production of this enzyme. In our study, a fungal isolate, Trichoderma hamatum NGL1 was isolated to produce endoglucanase (EGase) using cow dung in solid state fermentation (SSF). The process parameters were initially screened by a traditional one variable-at-a-time approach method, followed by a two level full factorial design. A two level full factorial design showed that pH, moisture (physical factors) and oat meal (nitrogen source) were the significant process parameters to improve the enzyme production (p < 0.05). Statistical approach revealed over threefold increase in cellulase production than before optimization. In this study, paddy straw was used as the substrate to evaluate the efficacy of sacchairification and saccharification process was maximum at 60 °C (p < 0.05).
Keywords
Cow dung
Fungus
Solid-state-fermentation
Central composite rotary design
Carboxymethyl Cellulase
Saccharification

1 Introduction
Cellulases catalyze the hydrolysis of cellulose into sugar and other oligomeric units (Pandey et al., 1999). These enzymes are available commercially for more than 30 years and they are used in paper and pulp industries, textile industries, bio-ethanol industries, wine and brewery industries, food processing industries and agricultural industries (Dienes et al., 2004). Both fungi and bacteria produce cellulases. However, fungi are the prime source of cellulase and most of the reported cellulose producing fungi was from mesophilic origin. These include Trichoderma sp., Acremonium sp., Aspergillus sp., Rhizopus sp., Penicillium sp., Fusarium sp. and Chaetomium sp. Of all these, the filamentous fungus Trichoderma sp. is found to have the potential to synthesize cellulase (Bayer et al., 1994). Solid state fermentation (SSF) allows usage of low cost substrate, easier downstream processing and higher volumetric productivity. However, most of the studied reports the production of cellulases in submerged fermentation using synthetic culture medium. The filamentous fungi, Trichoderma sp. was reported to utilize various substrates for enzyme production (Bayer et al., 1998). In enzyme industries, the fermentation medium alone meets about 40% of enzyme cost. So, a search of a novel, low cost, inducible cheap substrate is an ultimate goal to minimize the cost of industrial enzymes production (Zhang and Himmel, 2006). Among the naturally available resources, lignocellulose is one of the best resources and has potential nutrient components for the synthesis of biofuels. The applications of these lignocelluloses material are highly limited because of their limited availability in certain seasons and the typical substrate should be available throughout the year in large quantities. Cow dung is one of the substrates, which is available in substantial amount and has been reported as the cheap substrate for hydrolytic enzymes production from various bacterial strains (Vijayaraghavan and Vincent, 2012, Vijayaraghavan et al., 2016). However, the report on EGase production by fungal isolates using cow dung substrate is limited or not available.
Optimization of culture medium parameters highly useful to improve the enzyme yield and has been reported by (El-Hadi et al., 2014). Optimization of biomolecules production has been frequently achieved by the traditional method. RSM is highly useful statistical tool and has been used in many industrial and biotechnological processes. The statistical optimization of enzymes production is useful to evaluate the required optimum level of the critical factors influenced on enzymes production. Central composite design has been used frequently for cellulose production from a fungal strain by lignocellulosic biomass as a low cost substrate (Bagewadi et al., 2018). Optimization of enzyme production is very important to analyze the exact concentration of various nutrient factors and physical parameters at optimum level, like carbon source, nitrogen source, type of cellulosic materials, inoculum size, temperature, pH value of the medium and moisture content of the substrate material during fermentation process (Kumar and Takagi, 1999). Trichoderma species has the ability to secrete large amount of cellulases than other fungi and are highly suitable for the commercial production of cellulases. In this study, cellualse production by T. hamatum was optimized by statistical method and was isolated from the natural environment. Optimization of medium components including, physical parameters for EGase production under SSF when considering this process for various industrial applications. Because SSF is highly useful for cost-effective production of various enzymes especially using fungal isolates. Various solid agro- wastes could be used as the substrates for SSF (Bansal et al., 2012). Recently, Srivastava et al. (2018) used agriculture waste for the production of fungal cellulases. These fungal cellulases were used for recycling of waste papers (Pathak and Bhardwaj, 2018). Cellulase production and saccharification process have been reported earlier by Palaniyandi et al. (2014) using the mutant strain Hypocrea koningii RSC1. Lim et al. (2016) used cellulases and chemicals for saccharification process. The present study is useful to analyze the influence of cow dung on cellulase production under solid substrate fermentation.
2 Materials and methods
2.1 Cellulase-producing fungi from plantain field
About 10 g of soil was collected from the banana plant root tip from the agricultural field. Suitable dilutions (10 -4 to 10-8) were made and the fungi were isolated using potato dextrose agar (PDA) medium. The morphologically variant isolates were isolated by continuous streaking on PDA agar medium and subjected for EGase screening.
2.2 Screening of the fungal isolates for EGase activity
Twenty morphologically variant isolates were grown in culture medium for 72 h. Then the cow dung was extracted as described by Vijayaraghavan et al. (2012) by simple filtration and centrifugation. The culture supernatant was restraining by centrifugation and the cell free extract was loaded on CMC - agarose plates (0.9% agarose, 1% CMC, pH 6.0) and incubated for 5 h at room temperature (30 ± 2 °C). Then the plates were flooded with Congo red (1%, (w/v) an incubated for 15 min at 30 ± 2 °C, followed by 1 M of NaCl (10 mL) to stain the plate. Appearance of clear zones around sample wells indicated EGase hydrolysis.
2.3 Identification of the organism
In our study, potent amylase producing fungal isolate was subjected for molecular characterization. The PCR protocol was carried out using the forward primer, ITS1 (5′TCCGTAGGTGAACCTGCGG3′) and a reverse primer, ITS4 (5′TCCTCCGCTTATTGATATGC3′). The resulted PCR amplicon was sequenced and 18S rDNA partial sequence obtained from this study was submitted to NCBI with accession number, KX424842.
2.4 Inoculum preparation
T. hamatum NGL1 was culture into the medium consists of sucrose – 30; NaNO3- 3.0; and K2HPO4-0.5 and the medium pH was maintained as 6.0. Experiment was performed in 100-mL Erlenmeyer flask containing culture medium and incubated in static condition at room temperature (30 ± 2 °C) for 5 days.
2.5 Substrate
Saw dust, paddy straw, cow dung, banana peel and wheat bran were used as the substrate for the production of EGase. Cow dung was collected from a farm house and dried under sunlight for a week. The dried cow dung and other substrates were finely powdered.
2.6 Solid state fermentation
Two gram of substrate (Saw dust, paddy straw, cow dung, banana peel and wheat bran was taken in 100-ml Erlenmeyer flask and initial moisture content was adjusted using Tris-HCl buffer (pH 8.0, 0.05 M) as 60% (v/w). The content was sterilized at 121 °C for 20 min. After sterilization, a density of 2 × 10⁶ spores was inoculated on the substrate aseptically and incubated for 6 days at 37 °C. EGase was extracted as described previously by Vijayaraghavan and Vincent (2012). One-way analysis of variance (ANOVA) was used to find the potent substrate for optimization studies.
2.7 Enzyme assay
Endoglucanase activity was estimated from the crude extract as described by (Irfan et al., 2013).
2.8 Screening of process parameters
The process parameters such as, carbon, nitrogen, and ionic sources were screened by supplementing solitarily along with substrate. To evaluate the optimum pH on EGase production, the culture substrate pH value was adjusted from pH 3.0 to 8.0 using various buffers. To anzlyze the optimum moisture level, the moisture level was adjusted between 40% and 80%. One-way analysis of variance (ANOVA) was used to analyze the significance of process variables (P < 0.05).
2.9 Screening the significant process parameters by statistical approach
In our study, important process parameters influencing EGase production in SSF was screened. Totally five variables were selected for this study. The experiment involved pH, moisture, maltose, oat meal and magnesium based on initial screening experiments. Each of the process parameters was analyzed at two different levels (low and high). The actual values corresponding to the coded levels were shown in Table 1a. For five variables, a total experimental run was 32. About 5 g of substrate was weighed and transferred into all 32 Erlenmeyer flasks and the process variables were adjusted as described in Table 1b. Design Expert 9.0, StatEase Inc., Minneapolis, Minnesota was used to design the experiment and to analyze the experimental data. Eq. (1) gives the first order polynomial equation that governs the response (Y) of the enzyme bioprocess.
Symbol
Variables
Units
Coded levels
−1
+1
A
pH
5
7
B
Moisture
%
60
90
C
Maltose
%
0.1
1
D
Oat meal
%
0.1
1
E
Magnesium
%
0.1
0.5
Run
A:pH
B:Moisture %
C:Maltose %
D:Oat meal %
E:Magnesium %
Enzyme activity (U/g)
1
−1
−1
−1
1
−1
67.5
2
1
1
−1
−1
1
71.3
3
−1
−1
1
−1
−1
56.8
4
−1
1
1
−1
1
2.4
5
−1
1
1
1
1
28.9
6
1
1
1
1
1
76.2
7
−1
1
1
−1
−1
2.6
8
−1
1
1
1
−1
11.4
9
1
1
1
−1
1
3.9
10
1
−1
−1
1
1
102.6
11
−1
−1
1
1
1
40.1
12
1
−1
1
−1
1
11.9
13
1
1
−1
1
−1
0.9
14
1
−1
−1
−1
−1
64.5
15
−1
−1
−1
−1
1
2.6
16
1
1
−1
1
1
1.8
17
1
1
1
−1
−1
30.3
18
−1
−1
−1
−1
−1
3.7
19
1
1
1
1
−1
61.4
20
1
−1
1
1
1
7.9
21
−1
1
−1
1
−1
1.3
22
−1
−1
1
1
−1
18.7
23
−1
−1
1
−1
1
10.4
24
−1
1
−1
1
1
2.8
25
−1
1
−1
−1
1
0.9
26
1
−1
−1
−1
1
37.8
27
1
−1
−1
1
−1
27.4
28
1
−1
1
1
−1
7.8
29
1
1
−1
−1
−1
1.4
30
1
−1
1
−1
−1
2.8
31
−1
1
−1
−1
−1
8.6
32
−1
−1
−1
1
1
2.1
Source
Sum of squares
df
Mean square
F-Value
p-Value
Model
24721.91
22
1123.72
25.92
<0.0001
Significant
A-pH
1939.09
1
1939.09
44.73
<0.0001
B-Moisture
785.07
1
785.07
18.11
0.0021
D-Oat meal
674.36
1
674.36
15.56
0.0034
AB
508.01
1
508.01
11.72
0.0076
AC
1096.29
1
1096.29
25.29
0.0007
AE
1216.48
1
1216.48
28.06
0.0005
BC
2448.25
1
2448.25
56.47
<0.0001
BE
338.65
1
338.65
7.81
0.0209
CD
418.33
1
418.33
9.65
0.0126
DE
285.01
1
285.01
6.57
0.0305
ABC
3134.34
1
3134.34
72.30
<0.0001
ABE
319.41
1
319.41
7.37
0.0238
ACD
986.79
1
986.79
22.76
0.0010
ACE
1089.28
1
1089.28
25.13
0.0007
BCD
3051.76
1
3051.76
70.39
<0.0001
BDE
295.85
1
295.85
6.82
0.0282
CDE
611.63
1
611.63
14.11
0.0045
ABCD
240.35
1
240.35
5.54
0.0430
ABDE
648.90
1
648.90
14.97
0.0038
ACDE
623.93
1
623.93
14.39
0.0043
BCDE
297.07
1
297.07
6.85
0.0279
ABCDE
3713.07
1
3713.07
85.65
<0.0001
Residual
390.18
9
43.35
Cor Total
25112.08
31
2.10 RSM for optimizing the parameters
The three most significant factors which influence on EGase production were selected from two level full factorial design for optimization of EGase production in SSF (Table 2a). Design Expert 9.0, StatEase Inc., Minneapolis, Minnesota has been used to design the experiment and to analyze the experimental data. The experiment involved a central composite design with 20 randomized experimental runs for the selected three variables. In our experiment, 5.0 g of solid substrate was added into the Erlenmeyer flask and the other variable levels were maintained as described in Table 2b. All Erlenmeyer flasks were sterilized as described earlier and inoculated with a density of 2 × 10⁶ spores and incubated for 6 days and enzyme was extracted and assayed as described earlier. The model was built using the data and the same was subjected for analysis of variance (ANOVA) to check for statistical significance (Table 2c). The second order polynomial equation describing the response (Y) of the process is given as:
Variables
Symbol
Coded values
−α
−1
0
+1
+ α
pH
A
4.31821
5
6
7
7.68179
Moisture
B
43.1821
50
60
70
76.8179
Oat meal
C
−0.0727171
0.2
0.6
1
1.27272
Run
A:pH
B:Moisture
C:Oat meal
Enzyme activity (U/g)
1
−1.000
−1.000
1.000
2.8
2
0.000
1.682
0.000
89.3
3
−1.000
1.000
1.000
26.28
4
1.000
−1.000
−1.000
56.23
5
0.000
0.000
1.682
47.12
6
0.000
0.000
0.000
112
7
0.000
0.000
0.000
121.3
8
−1.000
1.000
−1.000
153.1
9
1.000
1.000
1.000
82.5
10
1.000
−1.000
1.000
96.13
11
1.000
1.000
−1.000
90.5
12
1.682
0.000
0.000
103.1
13
0.000
0.000
0.000
102
14
0.000
0.000
−1.682
98.81
15
0.000
0.000
0.000
119.3
16
−1.682
0.000
0.000
55.09
17
0.000
−1.682
0.000
37.21
18
0.000
0.000
0.000
98.5
19
−1.000
−1.000
−1.000
72
20
0.000
0.000
0.000
108.4
Source
Sum of squares
df
Mean square
F-Value
p-Value
Model
24710.72
9
2745.64
42.84
<0.0001
Significant
A-pH
1690.03
1
1690.03
26.37
0.0004
B-Moisture
3316.60
1
3316.60
51.75
<0.0001
C-Oat meal
4615.05
1
4615.05
72.01
<0.0001
AB
880.74
1
880.74
13.74
0.0041
AC
6493.44
1
6493.44
101.31
<0.0001
BC
1391.81
1
1391.81
21.72
0.0009
A2
1552.99
1
1552.99
24.23
0.0006
B2
3680.59
1
3680.59
57.43
<0.0001
C2
2269.14
1
2269.14
35.40
0.0001
Residual
640.93
10
64.09
Lack of fit
224.31
5
44.86
0.54
0.7434
Not significant
Pure error
416.61
5
83.32
Cor total
25351.64
19
The designed statistical model was experimentally validated by carrying out SSF using the predicted levels of parameters and the response was compared.
2.11 Enzymatic hydrolysis of paddy straw
In this study, saccharification analysis was performed in 100 mL Erlenmeyer flask containing paddy straw and crude enzyme mixture. The initial substrate concentration was kept as 1.0% and the reaction was performed (30–60 °C) under shaking condition at 150 rpm for 72 h as suggested by (Selig et al., 2008). To the control reaction, commercial enzyme (150 U) was added (Novozymes A/S, Denmark). After the saccharification process, enzyme was inactivated by boiling the tubes for about 10 min. Further reducing sugar of the sample was measured using DNA method (QI et al., 2004) and saccharification rate (%) was calculated.
3 Results and discussion
3.1 T. Hamatum NGL1 as the best isolate capable of EGase production by utilizing cow dung as solid waste
Twenty fungi were subjected for EGase screening which was isolate from the vicinity of banana root tip. Among the isolates, NGL1 emerged as the potent EGase producing organism. The fungus produced a clear zone of 7.5 mm on the CMC agar plate. It was cultured in SSF for the EGase production and the yield was 39.8 ± 2.7 U/g solid substrate in cow dung substrate. Enzyme production was 12.4 ± 1.2 U/g, 17.1 ± 2.2 U/g, 10.1 ± 0.7 U/g, 30.3 ± 2.1 U/g for saw dust, paddy straw, banana peel and wheat bran, respectively (P < 0.05). Since SSF medium such as, cow dung resembles the natural environment of the organism; increased enzyme production can be expected than submerged fermentation. The cost of the culture medium reflects on the final product cost of enzymes. Hence, use of a low cost substrate is always desired in a commercial point of view. Cow dung is an easily available, cheap, tail end waste which may cause environment pollution if left unutilized. It can be effectively utilized as a solid medium in SSF process for enzymes production. (Bansal et al., 2012) earlier applied kitchen waste residues for cellulose production by Aspergillus niger NS-2 in SSF. Trichoderma sp. is one of the important fungi which were widely used to produce cellulases commercially (Nathan et al., 2014). In recent years, cellulase has been produced by Trichoderma sp. using various substrates, including lignocellulose waste from vinegar industry (Liu and Yang, 2007). These substrates are available in seasonal basis and some substrates are not available in very large quantity. Considering its low cost and availability, cow dung is highly effective for EGase production.
3.2 Selection of best yielding medium components
The production of enzyme can be further improved by supplementing additional nutrient sources in some cases. Also, each bacterium is unique and each organism requires its own nutrients composition based on its original environmental conditions. Hence many solid substrates were tested to choose the best yielding medium components using OVAT approach. Maltose emerged as the suitable carbon source for EGase production from hamatum NGL1 (51 ± 4.7 U/g) (Fig. 1a). These carbon sources induce the production of EGase (P < 0.05). In Aspergillus hortai, lactose induced cellulase production (El-Hadi et al., 2014). Oat meal led to maximum enzyme activity (43.5 ± 3.1 U/g), followed by skimmed milk (41.3 ± 3.5 U/g) (P < 0.05) (Fig. 1b). The organic nitrogen sources supplemented with cow dung showed better yield than the inorganic nitrogen sources. The supplementation of magnesium ions gave maximum enzyme activity (37.5 ± 3.5 U/g) compared to other ions (P < 0.05) (Fig. 1c). EGase production was found to be high at 70% moisture (54 ± 2.3 U/g). Enzyme production was 13.7. ± 1.8, 37.5 ± 1.1, 42.4 ± 1.9%, 23.8 ± 3.1%, respectively at 40, 50, 60 and 80% respectively (P < 0.05). Also enzyme activity was high at pH 6.0 (55.3 ± 2.8 U/g). Enzyme production was 11.3 ± 2.1, 18.2 ± 3.8, 37.5 ± 1.95, 46.8 ± 2.7 and 31.4 ± 3.3 U/g substrate at pH 3.0, 4.0, 5.0, 7.0 and 8.0, respectively (P < 0.05).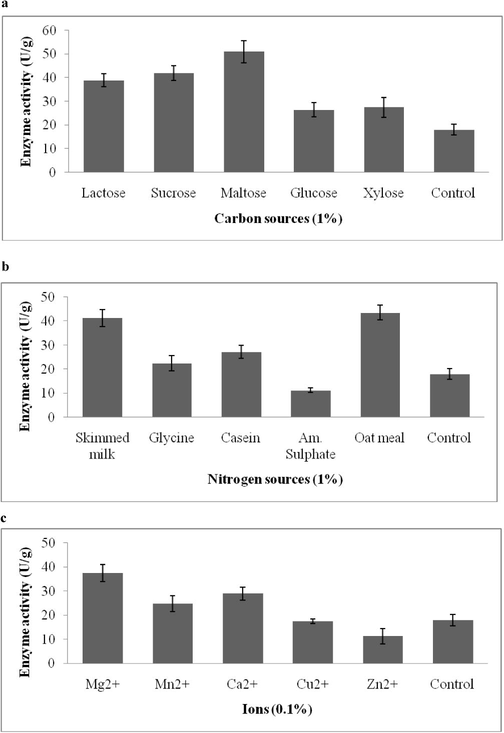
A–c. Effect of various carbon sources (a), nitrogen sources (b) and ions (c) on production of EGase in solid state fermentation by T. hamatum NGL1.
3.3 Elucidation of significant process parameters using statistical method
The randomized trial involved 32 experimental runs for five variables as shown in Table 1b and a regression model was built based on the results. The enzyme activity ranged from 0.9 U/g to 102.6 U/g. ANOVA was performed on the results was tabulated (Table 1c). The F value of the model was 25.92 and was statistically significant. The model had an R2 value of 0.9845. The predicted R2 value was found to be 0.8036 and the adjusted R2 value was 0.9465. The equation in terms of the coded factors can be given as
EGase activity = + 24.08 + 7.78A – 4.95B + 4.59D + 3.98AB – 5.85AC + 6.17AE + 8.75BC + 3.25BE + 3.62CD + 2.98DE + 9.90ABC – 3.16ABE + 5.55ACD – 5.83ACE + 9.77BCD – 3.04BDE + 4.37CDE + 2.74ABCD – 4.50ABDE – 4.42ACDE + 3.05BCDE + 10.77ABCDE
In the equation, the process variables were included in coded levels. Hence the coefficients of results of each model terms could be considered as a measure of the relative impact of each term on the process conditions. The negative coefficient for parameter B (moisture content of the medium) indicates that the EGase activity could be further improved by decreasing the moisture content of the substrate. Based on these results, pH, moisture and oat meal were the medium components that appeared as the important process parameters and were considered for RSM. Recently, (Bagewadi et al., 2018) used Plackett–Burman design for optimizing cellulase production.
3.4 Response surface methodology using central composite design
The interaction effects between the significant process parameters were analyzed using the central composite design and the pinnacle of EGase activity was explored using response surface plots. The surface plot implied the interactions of variables on EGase production (Fig. 2a-c). Table 2b shows the three process parameters (pH, moisture and oat meal) in their response (−α, −1, 0, +1, +α) for the CCD experimental design. ANOVA was performed on the results and the quadratic equation obtained was given as,
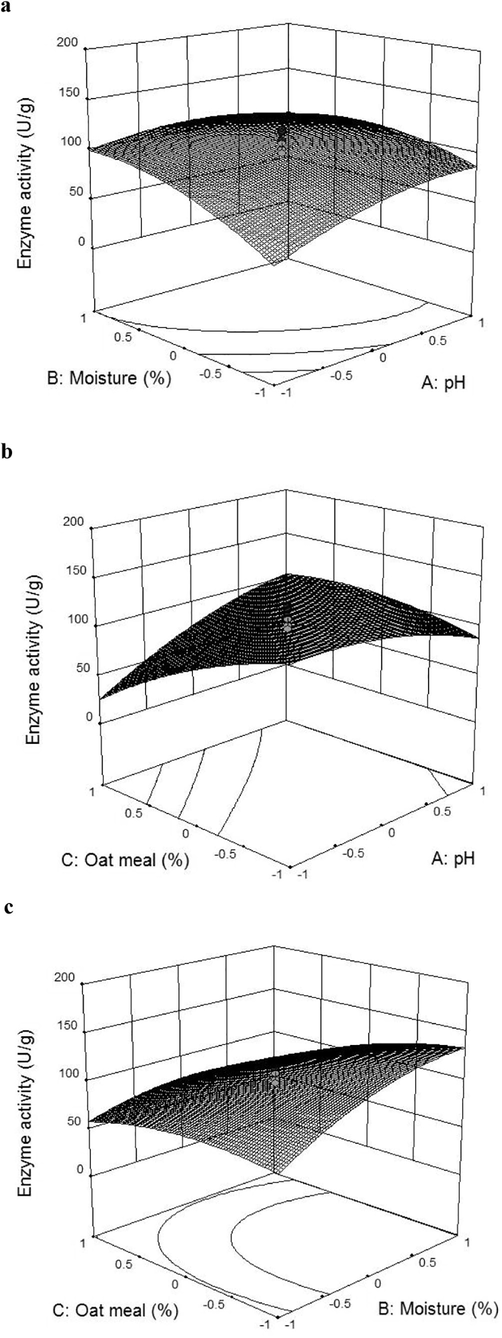
Three dimensional response surface plots depicting the interactive effect between moisture and pH (a), oat meal and pH (b) and oat meal and moisture (c) on production of EGase by T. hamatum NGL1.
The model F value of 42.84 indicated the statistical significance of the experimental model and was statistically significant (p < 0.0001). The model terms having a probability less than 0.05 can be considered as statistically significant (Table 2c). The lack of fit F-value was 0.54 and it was not significant indicated goodness of fit. The predicted R2 value of this model was 0.9085, and the adjusted R2 value was 0.9520. The model had an R2 value of 0.9747. The R2 value of the design could be at least 0.8 to fit the model. So, our designed model is best fit with R2 value 0.9747. CCD and RSM are used to provide optimum concentration of selected factors. In an enzymatic bioprocess enhanced enzyme production can be frequently achieved by means of statistical optimization design. Response surface plot generally helps to visualize the interactive effect of selected factors on EGase production. In our study, a three-fold increase in the EGase activity was obtained in SSF using cow dung substrate by T. hamatum NGL1 than unoptimized medium. Medium optimization by employing RSM showed that the SSF medium containing oat meal (0.2%), pH 6.14 and moisture (66.49%) helps the maximum amount of EGase production. In this study, the increase of moisture content and pH of the medium enhanced EGase production at certain level and enzyme production was further decreased. The predicted value for the SSF process parameters were 151.3 U/g solid waste the observed activity and the experimental response was 148 ± 3.5 U/g. Recently, (Bagewadi et al., 2018) used statistical approach to optimize the medium components for enzyme production and reported 2.31-fold increase on EGase production. Likewise, (Lee et al., 2015) optimized EGase production from Trichoderma harzianum KUC1716 using response surface methodology and the reported optimized independent factors were 1.85% cellulose, 0.48% soy peptone and 0.10% thiamine.
3.5 Hydrolysis of paddy straw using EGase from T. Hamatum NGL1
The saccharification efficacy of EGase from T. hamatum NGL1 and commercial EGase was described in Fig. 3. In this study, paddy straw was used as the substrate to evaluate the efficacy of sacchairification. According to Maeda et al. (2011) no microorganism produces cellulases with desirable properties for biomass hydrolysis. Hence, saccharification process on lignocellulostic materials using enzymes is interesting. In this study, saccharification process was maximum at 60 °C than other temperatures and saccharification efficacy was significant (p < 0.05) at optimized temperature. The cellulose content of paddy straw positively correlated with saccharification process during this study. However, lignin content of paddy straw negatively correlated in this experiment.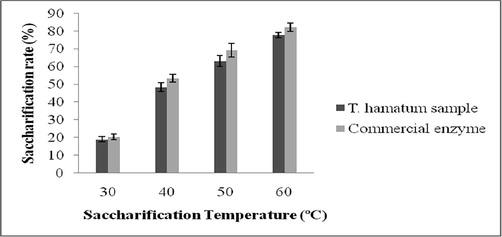
Saccharification process of paddy straw at various temperature after 72 h of incubation. Error bar represents standard deviation (n = 3).
4 Conclusions
Trichoderma hamatum NGL1 was shown to produce EGase in SSF by utilizing cheap substrate as the tail end substrate. EGase yield increased over three fold while after statistical approach. The physical parameters were influenced on EGase production. This bioprocess reduces the production cost of enzymes. Further, cow dung is readily available; using it as the solid substrate for enzyme production is a still-better way of waste management. The EGase from T. homatum NGL1 showed saccharification efficiency which was comparable with commercial enzyme.
Acknowledgment
The authors extend their appreciation to the Deanship of Scientific Research at King Saud University for funding this work through research group no (RG-1436-025).
Declaration of Competing Interest
The authors declare that they have no known competing financial interests or personal relationships that could have appeared to influence the work reported in this paper.
References
- Optimization of endoglucanase production from Trichoderma harzianum strain HZN11 by central composite design under response surface methodology. Biomass Convers. Biorefin.. 2018;8:305-316.
- [Google Scholar]
- Production of cellulases from Aspergillus niger NS-2 in solid state fermentation on agricultural and kitchen waste residues. Waste Manage.. 2012;32:1341-1346.
- [Google Scholar]
- The cellulosome—a treasure-trove for biotechnology. Trends Biotechnol.. 1994;12:379-386.
- [Google Scholar]
- Treatment of recycled fiber with Trichoderma cellulases. Ind. Crops Prod.. 2004;20:11-21.
- [Google Scholar]
- Optimization of cultural and nutritional conditionsfor carboxymethylcellulase productionby Aspergillus hortai. J. Radiat. Res. Appl. Sci.. 2014;7:23-28.
- [Google Scholar]
- Production of cellulases and hemicellulases from cellulytic fungal cultures in submerged fermentation using agricultural wastes. Electron. J. Biol.. 2013;9:62-66.
- [Google Scholar]
- Microbial alkaline proteases: from a bioindustrial viewpoint. Biotechnol. Adv.. 1999;17:561-594.
- [Google Scholar]
- Optimization of endoglucanase production by Trichoderma harzianum KUC1716 and enzymatic hydrolysis of lignocellulosic biomass. Bioresources.. 2015;10:7466-7476.
- [Google Scholar]
- Complete saccharification of cellulose through chemo-enzymatic hydrolysis. Biomass Bioenergy. 2016;94:31-38.
- [Google Scholar]
- Cellulase production by Trichoderma koningii AS3. 4262 in solid-state fermentation using lignocellulosic waste from the vinegar industry. Food Technol. Biotechnol.. 2007;45:420-425.
- [Google Scholar]
- Enzymatic hydrolysis of pretreated sugar cane bagasse using Penicillium funiculosum and Trichoderma harzianum cellulases. Process Biochem.. 2011;46(5):1196-1201.
- [Google Scholar]
- Process optimization and production kinetics for cellulase production by Trichoderma viride VKF3. SpringerPlus.. 2014;3:92.
- [Google Scholar]
- Cellulase production and saccharification of rice straw by the mutant strain Hypocrea koningii RSC1. J. Basic Microbiol.. 2014;54(1):56-65.
- [Google Scholar]
- Solid state fermentation for the production of industrial enzymes. Curr. Sci.. 1999;149–62
- [Google Scholar]
- Fungal enzymes application for recycling of waste papers. Curr. Biotechnol.. 2018;7(3):151-167.
- [Google Scholar]
- Study on measuring reducing sugar by DNS reagent. J. Cellulose Sci. Technol.. 2004;3:17-20.
- [Google Scholar]
- Enzymatic saccharification of lignocellulosic biomass. Laboratory analytical procedure. Laboratory Analytical Procedure (LAP) 2008:1617.
- [Google Scholar]
- Fungal cellulases production for biodegradation of agriculture waste. In Microorganisms for Green Revolution. Singapore: Springer; 2018. p. :75-89.
- Cow dung as a novel, inexpensive substrate for the production of a halo-tolerant alkaline protease by Halomonas sp. PV1 for eco-friendly applications. Biochem. Eng. J.. 2012;69:57-60.
- [Google Scholar]
- Cow dung: a potential biomass substrate for the production of detergent-stable dehairing protease by alkaliphilic Bacillus subtilis strain VV. SpringerPlus. 2012;1(1):76.
- [Google Scholar]
- Solid-substrate bioprocessing of cow dung for the production of carboxymethyl cellulase by Bacillus halodurans IND18. Waste Manage.. 2016;48:513-520.
- [Google Scholar]
- Mielenz JR. Outlook for cellulase improvement: screening and selection strategies. Biotechnol. Adv.. 2006;24:452-481.
- [Google Scholar]


