

Translate this page into:
Leptin gene polymorphism Rs7799039; G2548A, metabolic and oxidative stress markers in polycystic ovarian syndrome
⁎Corresponding author at: Department of Biochemistry, K.S. Hegde Medical Academy (KSHEMA), Nitte (Deemed to be University), Deralakatte, Mangalore, Karnataka, India. kumarin@nitte.edu.in (N. Suchetha Kumari)
-
Received: ,
Accepted: ,
This article was originally published by Elsevier and was migrated to Scientific Scholar after the change of Publisher.
Peer review under responsibility of King Saud University.
Abstract
Objectives
Stress which includes various similar categories such as emotional, inflammatory, oxidative, and metabolic stress is an important component of the Polycystic Ovarian Syndrome (PCOS). The current study examines the relationship of leptin gene polymorphism with metabolic, oxidative stress, and inflammatory markers in polycystic ovarian syndrome.
Methods
A total of 300 subjects were enlisted (Control-150; PCOS-150). Commercially available kits were used to measure the glycemic, inflammatory, and lipid profile status. Standard methods were used to examine oxidative stress markers. Polymerase chain reaction-restriction fragment length polymorphism (PCR-RFLP) was carried out for SNP rs7799039 genotyping. Statistical Package for Social Sciences (SPSS) software (version 20.0, IBM, Armonk, NY, USA) was used for statistical analyses.
Results
The groups exhibited a difference with statistical significance in terms of body mass index (BMI), insulin, HOMA-IR, Triglyceride, Follicle-stimulating hormone (FSH), Testosterone, vitamin D, leptin, TNF-alpha, IL-4, IL-10, total antioxidant capacity, and myeloperoxidase. Statistically significant differences between HOMA-IR, TC, TG, and inflammatory markers (TNF-alpha, IL-2) were exhibited by the three genotype models.
Conclusion
The subjects and controls in this investigation have significantly different rs7799039 genotype distributions. To acquire a better knowledge of the leptin gene’s role in polycystic ovarian syndrome, more research on a larger population of PCOS patients is required.
Keywords
Leptin gene polymorphism (rs7799039-g2548a)
Metabolic markers
Oxidative stress markers
Polycystic ovarian syndrome

1 Introduction
Polycystic ovarian syndrome (PCOS) is an endocrine-metabolic disorder with a multitude of hormonal imbalances, with a preponderance of hyperandrogenism symptoms that have both immediate and long-term implications on female health (Rojas et al., 2014). An essential component of PCOS is stress encompassing variant equivalent definitions like emotional, inflammatory, oxidative, and metabolic stress (Papalou and Diamanti-Kandarakis, 2017). PCOS symptoms are not limited to the gynaecological realm; obesity, dyslipidemia, hypertension, metabolic syndrome (MS), and type 2 diabetes mellitus (DM2) are all more common in women with PCOS than in those without the condition (Rojas et al., 2014). These characteristics, as well as additional changes such as endothelial dysfunction and a low-grade inflammatory state, all contribute to the patients' higher risk of cardiovascular disease and all-cause death (Rojas et al., 2014). Because obesity is a prevalent characteristic of PCOS patients, researchers hypothesized that leptin might play a role in the disease's development (Rojas et al., 2014; Moran et al., 2012; Calcaterra et al., 2021). Obesity causes hyperleptinemia and oxidative stress, which may have a role in developing PCOS (Calcaterra et al., 2021).
Leptin is a protein produced by the LEP gene that regulates food intake, energy balance, and reproduction (Tu et al., 2017). Leptin, a 16-kDa protein produced by adipocytes, was initially discovered in laboratory mice due to the ob (obese) gene (Tu et al., 2017; Zhou and Rui, 2013). Leptin reduces glucose absorption, glycogen synthase, inhibits lipogenesis and inhibits lipolysis in adipocytes (Pandey et al., 2015; Zhang et al., 1994; MacDougald et al., 1995). Leptin causes insulin-like actions in hepatocytes by altering the insulin signalling pathway. As a result, leptin and insulin signalling may interact, making hepatocytes more insulin sensitive (MacDougald et al., 1995; Muller et al., 1997). Leptin levels rise with rising body mass index (BMI) and body fat since it is an adipokine. However, its relation to PCOS is fascinating because PCOS individuals have higher leptin levels than healthy people (Pandey et al., 2015; Zhang et al., 1994; MacDougald et al., 1995). Oxidative stress is a major factor in the progression of PCOS (Mohammadi, 2019). Oxidative stress is now widely acknowledged as a critical factor in the pathogenesis of various diseases, including PCOS. The oxidant and antioxidant imbalance and the production of excessive reactive oxygen species (ROS) levels is referred to as oxidative stress (Sharifi-Rad et al., 2020). Many studies have found circulating oxidative indicators as a potential inducer of PCOS pathogenesis (Manna and Jain, 2015). Several theories on the pathology have been presented to explain the complete range of symptoms and indications, but no definitive answers have been found (Fratantonio et al., 2005). Genetic and environmental factors are known to play a role in the differing pathophysiology of PCOS phenotypes. As a result, gene abnormalities in women with PCOS have extensively investigated to determine if their mutations or polymorphisms are responsible for the condition. However it is unlikely to have a single cause for PCOS. Most of the studies have focused on studying leptin gene polymorphism alone but have not linked it to its interaction with metabolic and oxidative stress markers which will shed light on whether and how leptin gene polymorphism would be associated with metabolic and oxidative stress markers and could contribute to the PCOS pathogenesis and progression. With this the present study investigated the interplay between leptin gene polymorphism metabolic, oxidative stress and inflammatory markers in polycystic ovarian syndrome.
2 Materials and method
Institutional ethical clearance was obtained (NU/CEC/2018/0195 dated 16-06-2018). Individuals visiting Justice K.S. Hegde Charitable Hospital, Deralakatte, Mangaluru for regular health check-up from July 2018- June 2021 were approached for the study. Informed consent was duly signed and subjects were recruited (Control-150; PCOS-150) in 18–40 years of age as per the exclusion and inclusion criteria. The subjects with PCOS (age group 18–40 years) will be recruited based on the Rotterdam criteria (Legro et al., 2013): Oligo and/or amenorrhea or anovulation, clinical and /or biochemical signs of hyperandrogenism, the polycystic appearance of the ovary on ultrasonography. Other causes of clinically diagnosed hyperandrogenism include hyperprolactinemia, Cushing's syndrome, androgen-secreting tumors, non-classical congenital adrenal hyperplasia, and patients on drugs that alter the sex hormone level were excluded. The Control group included healthy women aged 18–40 years with regular menstrual cycles (26–34 days). Pregnant women and subjects not willing to give consent were excluded. A detailed case history was taken during the first visit. 2 mL of peripheral blood was collected in the plain tube for biochemical estimations and2mL in EDTA vacutainer tubes for DNA isolation.
2.1 Biochemical measurements
2.1.1 Hormones, vitamin D and lipid profile estimation
Serum was separated and evaluated for follicle-stimulating hormone (FSH), luteinizing hormone (LH) (Xema, Russia), total testosterone (T) (Xema, Russia), Insulin (Epitope USA) (Xema, Russia), 17-beta-estradiol (17-ß-E2) (Xema, Russia) (Xema, Russia), Prolactin, leptin (Sincere Biotech, Taiwan) and Vitamin D level (Diamitra, Italy) was measured by ELISA kit. Lipid profile status (TC, TG, HDL-C) was measured using commercially available kits (LiquiCHEKTMAGAPPE). Low-Density LDL cholesterol (LDL-C) was estimated indirectly using the Friedewald formula (Friedewald et al., 1972).
2.1.2 Inflammatory, oxidative stress markers and HOMA-IR
The phosphomolybdenum technique was used to determine the total antioxidant level in the serum. Serum malondialdehyde was estimated by the TCA-TBA method. Serum Vitamin C levels were evaluated by the dinitrophenylhydrazine method. Serum superoxide dismutase was estimated by the nitroblue tetrazolium method. A standard protocol was used to analyze Glutathione peroxidase and myeloperoxidase levels. Serum IL-2, IL-4, IL-10, and TNF-alpha (Boster CA, USA) were analyzed using standard ELISA kits. The HOMA of IR index (HOMA-IR) was calculated as HOMA-IR = [Fasting glucose](mmol/dl) × [Fasting plasma insulin](µIU/mL)/22.5 (Matthews et al., 1985).
2.2 Molecular studies
2.2.1 DNA isolation and quantification
A standardized protocol was applied for DNA isolation (Sergeant et al., 2012). DNA sample concentration was determined using a bio-spectrophotometer and stored at −20 °C until further analysis.
2.2.2 Single nucleotide polymorphism (SNP) selection and genotyping
Based on the prior publications, SNP rs7799039 was chosen. The primer pair for SNP rs7799039 (G > A) and PCR conditions are described in Table 1.
SNP
Polymorphism
Primer Sequence
Product length
PCR condition
Restriction Enzyme
rs7799039
G > A
F: 5′ TTTCCTGTAATTTTCCCGTGAG 3′
R: 5′ AAAGCAAAGACAGGCATAAAAA 3′242 bp
94 °C − 5 min
93 °C- 45 s
61 °C-30 s
72 °C-35 s
72 °C- 7 min
HhaI
2.3 Statistical analysis:
SPSS (version 20.0, IBM, Armonk, NY, USA) was used to conduct statistical analysis. Comparison of the variables between genotypes in each group was done by one-way ANOVA and Bonferroni correction tests. A two-tailed p‐value <0.05 was considered to be statistically significant.
3 Results
3.1 General characteristics of study and control population
Table 2 shows the control and study group's anthropometric, glycemic profile, lipid profile, hormonal levels, and inflammatory markers. A statistically remarkable difference between the groups was shown by the Body mass index (BMI), insulin, HOMA-IR, Triglyceride (TG), follicle-stimulating hormone (FSH), testosterone, vitamin D, leptin, TNF-alpha (Tumor necrosis factor-alpha), IL-4 (interleukin-4), IL-10, total antioxidant capacity (TAC), and myeloperoxidase (MPx). *P-value ≤ 0.05 was considered statistically significant. *Student t-test: data are shown as mean ± SD. Abbreviations: Body mass index (BMI), Fasting blood sugar (FBS), Homeostasis Model Assessment (HOMA-IR), Total Cholestrol (TC), Triglyceride (TG), High Density Lipoprotein (HDL), Low- Density Lipoprotein (LDL) Follicle-stimulating hormone (FSH), Luteinizing Hormone (LH), Tumor necrosis factor-alpha (TNF-œ), Interleukin -4,2, 10 (IL-4,2,10), C-reactive Protein (CRP), Total antioxidant capacity (TAC), Myeloperoxidase (MPx), Malonadehyde (MDA), Glutathione peroxidase (GPx).
Parameters
Control
N = 150Study
N = 150p-value
Demographics
Age (yrs)
24.64 ± 5.89
26.95 ± 5.34
0.746
Hip/WaistRatio
0.81 ± 0.06
0.86 ± 0. 0.06
0.71
Weight
(Kg)54.81 ± 10.29
64.08 ± 14.67
0.56
Height
(cm)158.64 ± 7.17
157.98 ± 5.99
0.342
Metabolic Stress Markers
BMI (Kg/m2)
21.91 ± 4.023
25.43 ± 5.00
0.050
Vitamin D (ng/mL)
29.03 ± 10.73
19.56 ± 5.49
0.000
Leptin (ng/mL)
22.06 ± 0.94
26.81 ± 1.75
0.000
Glycemic Profile
FBS
(mg/dL)86.16 ± 14.97
92.12 ± 21.21
0.15
Insulin (pmol/L)
3.92 ± 1.82
5.90 ± 0.68
0.00
HOMA-IR
0.82 ± 0.21
1.33 ± 0.33
0.049
Lipid Profile
TC (mg/dL)
159.93 ± 27.14
163.61 ± 41.42
0.06
TG (mg/dL)
101.69 ± 35.56
117.93 ± 53.83
0.02
HDL (mg/ dL)
61.14 ± 10.02
50.03 ± 8.72
0.066
LDL(mg/ dL)
1.36 ± 0. 0.54
1.98 ± 0. 0.71
0.189
LDL/HDL
1.38 ± 0. 0.58
1.98 ± 0.77
0.830
Hormone Levels
FSH (IU/L)
5.62 ± 4.08
4.89 ± 2.18
0.006
LH (IU/L)
11.21 ± 2.93
12.53 ± 1.57
0.164
Testosterone (nmol/L)
2.01 ± 1.34
3.91 ± 2.25
0.000
Estradiol (nmol/L)
0.67 ± 0.07
0.63 ± 0.03
0.134
Prolactin (mIU/L)
559.31 ± 180.99
640.71 ± 141.16
0.434
Inflammatory Stress markers
TNF-alpha (ρg/mL)
3.96 ± 1.00
8.21 ± 0.52
0.000
IL-2 (ρg/mL)
1.74 ± 0.07
2.93 ± 0.57
0.296
IL-4 (ρg/mL)
1.57 ± 0.33
1.87 ± 0.25
0.050
IL-10 (ρg/mL)
4.66 ± 0. 85
2.59 ± 0.31
0.000
CRP (ρg/mL)
1.57 ± 0.09
2.65 ± 0.30
0.000
Oxidative Stress Markers
TAC (mM/L)
0.46 ± 0.077
0.82 ± 0.15
0.001
MDA (µM/L)
4.45 ± 0.86
5.70 ± 0.69
0.050
GPx (µg/min/mg protein)
87.27 ± 4.17
129.47 ± 5.35
0.137
MPx (ρM/L)
26.53 ± 4.83
41.94 ± 3.60
0.001
3.2 Allele and genotype frequencies for rs7799039
Fig. 1 illustrates RFLP genotyping of rs7799039 by agarose gel electrophoresis. The agarose gels revealed that each allele had a single-band pattern: allele G, which does not contain the HhaI restriction site, was defined by a 242 bp fragment, while allele A, which contains this restriction site, was defined by two digestion bands of 181 and 61 bp.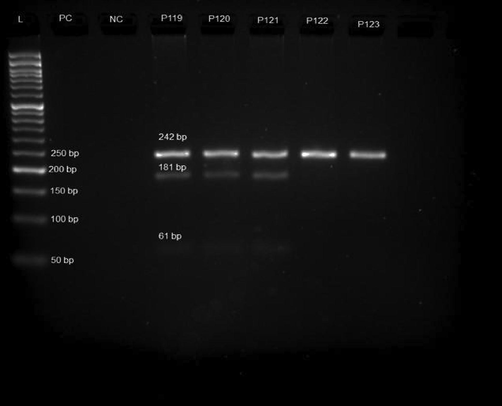
Agarose gel electrophoresis (3%) of polymerase chain reaction (PCR) product (PC-Positive Control; NC-Negative Control and P119-P123 Samples).
The wild type genotype is GG (single band −242 bp) for rs7799039 G > A, thehomozygous recessive variant is AA (three bands- 242 bp; 181 bp and 61 bp), and the heterozygous genotype is GA (Two bands 181 bp and 61 bp). The allele frequency of G and A was 0.65 (65%) and 0.35 (35%), respectively, in the control group. In the study group, the allele frequency of G was 0.50 (50%) and 0.50 (50%), respectively. The genotype frequency of GG is 0.29 (29%), and GA is 0.71 (71%) in the control group. It is 0.5 (50%) for GG, 0.05 (5%) for GA, and 0.45 (45 %) for AA in the study group.
3.3 Comparison of biochemical characteristics in the study subject based on the genotype models.
Various genotype models like the additive model (CC vs. CG vs. GG), dominant model (CC + CG vs. GG), and recessive model (CC vs. CG + GG) were compared with the biochemical characteristics (Table 3). *P-value of ≤ 0.05 was considered statistically significant. * Data shown as mean ± SD. Abbreviations: Body mass index (BMI), Fasting blood sugar (FBS), Homeostasis Model Assessment (HOMA-IR), Total Cholestrol (TC), Triglyceride (TG), High Density Lipoprotein (HDL), Low- Density Lipoprotein (LDL) Follicle-stimulating hormone (FSH), Luteinizing Hormone (LH), Tumor necrosis factor-alpha (TNF-œ), Interleukin -4,2, 10 (IL-4,2,10), C-reactive Protein (CRP), Total antioxidant capacity (TAC), Myeloperoxidase (MPx), Malonadehyde (MDA), Glutathione peroxidase (GPx).
Biochemical Characteristics
Additive Model
(GG vs GA vs AA)
(mean ± SD)Dominant Model
(GG + GA vs AA)
(mean ± SD)Recessive Model
(GG vs GA + AA)
(mean ± SD)
GG
GA
AA
p-value
GG + GA
AA
p-value
GG
GA + AA
p-value
Metabolic Stress Markers
BMI (Kg/m2)
26.25 ± 5.90
23.06 ± 4.32
24.79 ± 3.83
0.391
25.95 ± 5.79
24.79 ± 3.83
0.050
26.24 ± 5.9
24.61 ± 3.83
0.021
Vitamin D (ng/mL)
20.04 ± 8.56
24.95 ± 10.5
18.44 ± 8.06
0.418
20.48 ± 8.84
18.44 ± 8.05
0.814
20.03833±
19.09000±
0.776
Leptin (ng/mL)
26.77 ± 1.77
27.87 ± 1.83
26.74 ± 1.76
0.566
26.87 ± 1.77
26.73 ± 1.76
0.828
26.77300±
26.85167±
0.969
Glycemic Profile
FBS(mg/dL)
87.37 ± 21.31
107.66 ± 18.23
95.67 ± 20.55
0.144
89.21 ± 21.61
95.66 ± 20.55
0.952
87.36 ± 21.30
96.87 ± 20.37
0.927
Insulin (pmol/L)
5.99 ± 0.52
5.71 ± 0.25
5.83 ± 0.86
0.596
5.96 ± 0.50
5.82 ± 0.85
0.53
4.34 ± 1.44
3.75 ± 1.95
0.665
HOMA-IR
1.49 ± 0.32
1.17 ± 0.09
1.18 ± 0.29
0.001
1.46 ± 0.31
1.18 ± 0.2
0.717
1.00 ± 0.0419
0.75 ± 0.040
0.665
Lipid Profile
TC (mg/dl)
178.47 ± 36.50
161.33 ± 16.25
146.41 ± 43.52
0.013
156.03 ± 42.51
172.88 ± 38.81
0.585
178.46 ± 36.5
147.9 ± 27.90
0.458
TG (mg/dl)
139.47 ± 60.83
101 ± 48.08
95.89 ± 34.64
0.006
109.81 ± 41.09
127.85 ± 48.23
0.635
139.47 ± 32.62
99.6 ± 36.89
0.009
HDL (mg/dl)
48.33 ± 6.02
52 ± 8.7
51.70 ± 10.95
0.325
52.36 ± 10.08
47.18 ± 5.69
0.050
48.33 ± 6.01
51.73 ± 10.62
0.070
LDL(mg/dl)
104.79 ± 33.13
95.66 ± 11.2
86.45 ± 38.71
0.156
1.83 ± 0.73
2.16 ± 0.66
0.583
104.79 ± 33.12
87.37 ± 36.87
0.753
LDL/HDL
2.25 ± 0.65
1.85 ± 0.19
1.70 ± 0.72
0.011
1.84 ± 0.75
2.14 ± 0.76
0.774
2.25 ± 0.64
1.71 ± 0.68
0.795
Hormone Levels
FSH (IU/L)
4.51 ± 1.85
5.15 ± 0.6
5.31 ± 2.56
0.386
4.57 ± 1.78
5.30 ± 2.56
0.114
4.50910±
5.29033±
0.277
LH (IU/L)
11.34 ± 9.02
17.38 ± 1.02
13.33 ± 10.58
0.498
11.88 ± 8.77
13.33 ± 10.58
0.467
11.33533±
13.73567±
0.576
Testosterone (nmol/L)
3.76 ± 2.02
4.8 ± 1.57
3.99 ± 1.02
0.715
3.85 ± 1.98
3.99 ± 2.5
0.051
3.75710±
4.07633±
0.050
Estradiol nmol/L)
0.60 ± 0.54
0.53 ± 0.12
0.67 ± 0.05
0.839
0.59 ± 0.051
0.67 ± 0.05
0.702
0.60113±
0.66027
0.96
Prolactin mIU/L)
616.25 ± 212
573.81 ± 85
675.33 ± 263.87
0.767
612.32 ± 295.19
675. 32 ± 260.87
0.033
616.25467±
665.17367±
0.005
Inflammatory stress markers
TNF-alpha (ρg/mL)
8.45 ± 0.47
7.38 ± 0.16
8.05 ± 0.63
0.000
5.55 ± 2.29
8.04 ± 0.62
0.000
8.452 ± 0.469
7.97 ± 0.62
0.026
IL-2 (ρg/mL)
2.91 ± 0.47
2.52 ± 0.16
3.01 ± 0.41
0.006
2.15 ± 0.15
3.1 ± 0.4
0.123
2.91 ± 0.33
2.96 ± 0.42
0.232
IL-4 (ρg/mL)
1.55 ± 0.11
1.58 ± 0.050
1.88 ± 0.87
0.727
1.56 ± 0.10
1.88 ± 0.37
0.000
1.55 ± 0.10
1.85 ± 0.66
0.005
IL-10 (ρg/mL)
2.54 ± 0.32
2.78 ± 0.31
2.63 ± 0.31
0.000
3.89 ± 1.23
2.63 ± 0.311
0.000
2.53 ± 0.32
2.64 ± 0.30
0.563
CRP (ρg/mL)
2.70 ± 0.37
2.37 ± 0.15
2.65 ± 0.21
0.209
2.66 ± 0.36
2.64 ± 0.20
0.001
2.69 ± 0.36
2.42 ± 0.22
0.007
Oxidative stress markers
TAC (mM/L)
0.82 ± 0.15
0.85 ± 0.087
0.82 ± 0.16
0.914
0.82 ± 0.11
0.82 ± 0.16
0.574
0.8190±
0.8255
0.903
MDA (µM/L)
5.56 ± 0.67
6.04 ± 0.43
5.83 ± 0.73
0.244
5.60 ± 0.66
5.82 ± 0.73
0.870
5.5603±
5.8500
0.996
GPx (µg/min/mg protein)
129.46 ± 5.39
134.2 ± 1.73
128.96 ± 5.44
0.279
129.89 ± 5.33
128.96 ± 5.43
0.961
129.4627±
129.4840
0.990
MPx (ρM/L)
42.09 ± 3.65
13.79 ± 4.62
41.57 ± 3.27
0.577
42.24 ± 3.87
41.57 ± 3.27
0.244
42.0940±
41.7957
0.587
4 Discussion
Insulin resistance plays an essential role in the origination of both reproductive and metabolic defects and affects 50–70% of women with PCOS. Obesity, especially abdominal obesity, can contribute to the development of IR and its complications associated with it, for example, impaired glucose tolerance and T2DM (Zhu et al., 2013).
According to earlier studies, women with PCOS are more likely to develop glucose intolerance, type 2 diabetes mellitus, metabolic syndrome, and risk of cardiovascular disease with abnormal postprandial glucose levels (Zhu et al., 2013). In the present study, fasting blood sugar, insulin, and HOMA-IR levels were higher in the study group than in the control group. Most studies relate PCOS to lower HDL-C and higher triglyceride levels and lipid profile to IR. In previous studies (Talbott et al., 1995; Orio et al., 2004; Legro et al., 2001; Erel et al., 2003), it was also found that women with polycystic ovaries had higher serum lipids (total cholesterol, LDL, triglycerides) and lower HDL than healthy people. The present study is consistent with these results. Lipolysis is checked by hyperinsulinemia, which increases esterified acids (Liu et al., 2019). Non-esterified fatty acids (NEFA) lower HDL levels and raise triglyceride levels (Fenkci et al., 2003). Oxidative stress is the generation of reactive oxygen species (ROS) like superoxide anions, hydrogen peroxide (H2O2), and hydroxyl radicals not sufficiently detoxified by cellular antioxidants and causing ROS build-up. Oxidative stress is caused by the reduction of antioxidant/anti-inflammatory activity of HDL (Pandey et al., 2015; Mohammadi, 2019; Sharifi-Rad et al., 2020; Liu et al., 2019).
Total antioxidant capacity (TAC) is the ability to scavenge free radical production (Fenkci et al., 2003) compared TAC levels in PCOS patients to age, BMI, and smoking status matched controls and found that TAC levels in PCOS individuals were considerably lower. According to (Verit and Erel, 2008) TAC levels were distinctly higher in PCOS patients than in age and BMI-matched controls. The results of our study are in line with these facts. On the basis of the results, it can be hypothesized that TAC may be elevated to counteract the increased oxidative stress.
Malonaldehyde (MDA) is formed by the lipid peroxidation of polyunsaturated fatty acids. A comparison of MDA blood levels between PCOS subjects and healthy controls was made in the study by Kuşçu and Var (2009), which showed that MDA level was remarkably higher in the PCOS group but independent of obesity. The current study showed parallel results. In the PCOS group, glutathione peroxides (GPX) and myeloperoxidase (MPX) levels were higher as well. This rise in GPX and MPX levels may be a protective mechanism against oxidative damage.
Chronic low-grade inflammation is a key indicator of PCOS. It is suggested that it plays a role in the origin and progression of the disease. Inflammation has also been related to IR in PCOS. The present study observed elevated levels of CRP, TNF-alpha, and IL-2. Consistent results were shown by Papalou et al. (2015), Orio et al. (2004) and Herlihy et al. (2011).
Leptin can be described as a double-edged sword. It positively stimulates estrogen secretion, causing puberty, and negatively inhibits gonadotrophin-stimulated ovarian response in hyperleptinemia (18–20). As reported previously, the present study showed a statistically substantial difference between the two groups concerning leptin. Leptin resistance causes the loss of peripheral glucose homeostasis by lowering the hypothalamus insulin response, giving rise to overproduction of androgenic hormones and thereby contributing to insulin resistance (Martins et al., 2017; Bains et al., 2020; Mohamed et al., 2021). Several genetic variations have been studied for their predictive value for the PCOS, as prediction accuracy is affected by factors like the participating gene number, the frequency of risk alleles, and the associated risks with genotypes (Bains et al., 2020; Mohamed et al., 2021). The present study examined leptin gene polymorphism in polycystic ovarian syndrome. The additive model showed a remarkable difference between HOMA-IR, TC, TG, and inflammatory markers (TNF-alpha, IL-2) among the three groups studied. There was a statistically striking difference between BMI, prolactin, and inflammatory markers. The recessive model showed similar results. This indicates that the leptin gene may play a part in the pathogenesis of PCOS. Based on the current study findings, the suggestive mechanism enumerating the interaction between leptin insulin resistance and developing of PCOS is that insulin resistance increases insulin levels which in turn results in leptin resistance leading to hyperleptinemia. Similarly variation in leptin gene may also result in altered levels of leptin. The ovarian physiology in PCOS is directly impacted by hyperlepitemia, thereby stopping follicle formation and PCOS pathogenesis.
Though this study addressed numerous parameters, it had a limitation of small size. To validate the significance of the leptin gene polymorphism and PCOS pathogenesis, future research on a larger sample of PCOS patients is required. The explanation of this complex interplay between the leptin gene, inflammation, and metabolic stress at the molecular level is also necessary.
5 Conclusion
The findings demonstrate a functional relationship between leptin gene polymorphism, insulin resistance, and inflammatory markers. Interpreting the interaction of these factors with each other and with the onset and clinical manifestations of PCOS is a critical step in understanding the causes of the disease. It also helps identify prospective molecules and pathways to target therapeutic and preventive intervention. The present study findings can be confirmed and expanded by conducting additional studies on a larger spectrum of PCOS patients combined with genotyping of other leptin variants. These studies can also provide a detailed understanding of the leptin gene and its influence on the emergence of PCOS and its pathogenesis.
Acknowledgement
This work was supported by Vision Group of Science and Technology (VGST), Karnataka Science and Technology Promotion Society (KSTePS), Karnataka, India (Grant Number: K-FIST(L2)/2016-17/GRD-544/2017-18/107/408/1).
Declaration of Competing Interest
The authors declare that they have no known competing financial interests or personal relationships that could have appeared to influence the work reported in this paper.
References
- Association analysis of polymorphisms in LEP (rs7799039 and rs2167270) and LEPR (rs1137101) gene towards the development of type 2 diabetes in North Indian Punjabi population. Gene. 2020;754:144846.
- [Google Scholar]
- Polycystic ovary syndrome in insulin-resistant adolescents with obesity: the role of nutrition therapy and food supplements as a strategy to protect fertility. Nutrients. 2021;13(6):1848.
- [Google Scholar]
- Is serum leptin level regulated by thyroid functions, lipid metabolism and insulin resistance in polycystic ovary syndrome? Gynecol. Endocrinol.. 2003;17(3):223-229.
- [Google Scholar]
- Decreased total antioxidant status and increased oxidative stress in women with polycystic ovary syndrome may contribute to the risk of cardiovascular disease. Fertil. Steril.. 2003;80(1):123-127.
- [Google Scholar]
- Genetics of polycystic ovarian syndrome. Reproductive BioMedicine Online. 2005;10(6):713-720.
- [Google Scholar]
- Estimation of the concentration of low-density lipoprotein cholesterol in plasma, without use of the preparative ultracentrifuge. Clin. Chem.. 1972;18(6):499-502.
- [Google Scholar]
- Polycystic ovary syndrome and the peripheral blood white cell count. J. Obstet. Gynaecol.. 2011;31(3):242-244.
- [Google Scholar]
- Oxidative stress but not endothelial dysfunction exists in non-obese, young group of patients with polycystic ovary syndrome. Acta Obstet. Gynecol. Scand.. 2009;88(5):612-617.
- [Google Scholar]
- Diagnosis and treatment of polycystic ovary syndrome: an Endocrine Society clinical practice guideline. J. Clin. Endocrinol. Metab.. 2013;98(12):4565-4592.
- [Google Scholar]
- Prevalence and predictors of dyslipidemia in women with polycystic ovary syndrome. Am. J. Med.. 2001;111(8):607-613.
- [Google Scholar]
- Dyslipidemia involvement in the development of polycystic ovary syndrome. Taiwan. J. Obstetr. Gynecol.. 2019;58(4):447-453.
- [Google Scholar]
- Regulated expression of the obese gene product (leptin) in white adipose tissue and 3T3-L1 adipocytes. Proc. Natl. Acad. Sci.. 1995;92(20):9034-9037.
- [Google Scholar]
- Obesity, oxidative stress, adipose tissue dysfunction, and the associated health risks: causes and therapeutic strategies. Metabo. Syndr. Related Disorders. 2015;13(10):423-444.
- [Google Scholar]
- Polymorphisms in the leptin (rs7799039) gene are associated with an increased risk of excessive gestational weight gain but not with leptin concentration during pregnancy. Nutr. Res.. 2017;47:53-62.
- [Google Scholar]
- Homeostasis model assessment: insulin resistance and β-cell function from fasting plasma glucose and insulin concentrations in man. Diabetologia. 1985;28(7):412-419.
- [Google Scholar]
- A study of leptin and its gene 2548 G/A Rs7799039 single-nucleotide polymorphisms in Egyptian children: A single-center experience. Clin. Res. Hepatol. Gastroenterol.. 2021;45(5):101724.
- [Google Scholar]
- Oxidative stress and polycystic ovary syndrome: a brief review. Int J Prev Med. 2019;10(1):86.
- [Google Scholar]
- Obesity differentially affects phenotypes of polycystic ovary syndrome. Int. J. Endocrinol.. 2012;2012:1-7.
- [Google Scholar]
- Leptin impairs metabolic actions of insulin in isolated rat adipocytes. J. Biol. Chem.. 1997;272(16):10585-10593.
- [Google Scholar]
- The cardiovascular risk of young women with polycystic ovary syndrome: an observational, analytical, prospective case-control study. J. Clin. Endocrinol. Metab.. 2004;89(8):3696-3701.
- [Google Scholar]
- Association between hyperleptinemia and oxidative stress in obese diabetic subjects. J. Diab. Metab. Disorders. 2015;14(1):1-6.
- [Google Scholar]
- White blood cells levels and PCOS: direct and indirect relationship with obesity and insulin resistance, but not with hyperandogenemia. Hormones. 2015;14(1):91-100.
- [Google Scholar]
- Polycystic ovary syndrome, insulin resistance, and obesity: navigating the pathophysiologic labyrinth. Int. J. Reprod. Med.. 2014;2014:1-17.
- [Google Scholar]
- Differences in arachidonic acid levels and fatty acid desaturase (FADS) gene variants in African Americans and European Americans with diabetes or the metabolic syndrome. Br. J. Nutr.. 2012;107(4):547-555.
- [Google Scholar]
- Lifestyle, oxidative stress, and antioxidants: Back and forth in the pathophysiology of chronic diseases. Front. Physiol.. 2020;11
- [Google Scholar]
- Coronary heart disease risk factors in women with polycystic ovary syndrome. Arterioscler. Thromb. Vasc. Biol.. 1995;15(7):821-826.
- [Google Scholar]
- LEPR gene polymorphism and plasma soluble leptin receptor levels are associated with polycystic ovary syndrome in Han Chinese women. Personalized Medicine. 2017;14(4):299-307.
- [Google Scholar]
- Oxidative stress in nonobese women with polycystic ovary syndrome: correlations with endocrine and screening parameters. Gynecol. Obstet. Invest.. 2008;65(4):233-239.
- [Google Scholar]
- Positional cloning of the mouse obese gene and its human homologue. Nature. 1994;372(6505):425-432.
- [Google Scholar]
- Zhu, J.P., Teng, Y.C., Zhou, J., Lu, W., Tao, M.F., Jia, W.P., 2013. Increased mean glucose levels in patients with polycystic ovary syndrome and hyperandrogenemia as determined by continuous glucose monitoring. Acta obstetricia et gynecologica Scandinavica, 92(2), 165-171.


