

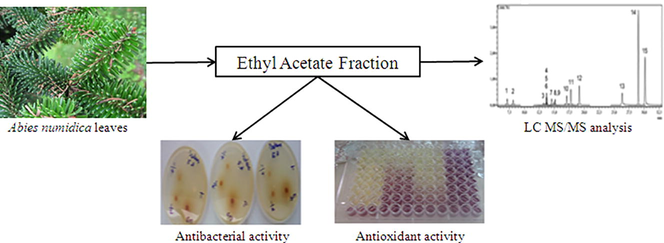
LC–MS/MS analysis, antioxidant and antibacterial activities of Algerian fir (Abies numidica de LANNOY ex CARRIÈRE) ethylacetate fraction extracted from needles
⁎Corresponding authors. bines07@yahoo.fr (Ines Bellil), salah4dz@yahoo.fr (Salah Akkal),
-
Received: ,
Accepted: ,
This article was originally published by Elsevier and was migrated to Scientific Scholar after the change of Publisher.
Peer review under responsibility of King Saud University.
Abstract
Abstract
Objectives
The objectives of the research are to extract chemicals from Algerian fir needles, to determine the total phenolics and flavonoids contents in ethylacetate fraction (EAF) and to assess the biological activities of the extract.
Methods
Several in-vitro biochemical assays were used to measure antioxidant and oxygen radical-scavenging abilities, and antibacterial activity was evaluated. Components of the extract were identified by mass spectrometry and comparison to reference compounds.
Results
Results showed that EAF presented a powerful antioxidant activity in all assays and exhibited a potent inhibitory effect against all bacterial strains used. Fractionation and mass spectrometry identified a high amount of astragalin, hyperoside and quercitrin in the EAF from needles.
Conclusion
The best of our knowledge, we report here for the first time, the evaluation of biological activities and the determination of phytochemical profile of Algerian fir leaves extract underlying the importance of this species as a source of health-promoting.
Keywords
Algerian fir (Abies numidica) leaves
Ethylacetate extract
Antioxidant activity
Antibacterial activity
LC–MS/MS analysis

1 Introduction
Secondary metabolites are considered as main phytochemical constituents, that play a crucial roles as an antioxidant, metal chelate, due to their chemical structure that are rich in hydroxyl groups (Gülçin, 2020). Moreover to free radicals and their harmful effects, bacterial strains resistance to many antibiotics is another problem for the human body, which caused the increasing in bacterial infections (Blonk and Cock, 2019), all these stimulate and oblige the researchers to look for therapeutic alternatives from natural origins.
A. numidica de Lannoy is an endemic evergreen tree, occupied a restrict range, found only in Babor’s mounts, in Algeria. Little is known about A. numidica and few studies reported the potential effect of this plant. Our attention was directed to polyphenols and flavonoids compounds and it was reported that ethylacetate solvent can pick up high amounts of these molecules (Thavamoney et al., 2018). For that, the objectives of the current study were to determine the total phenolics and flavonoids content in ethylacetate fraction extracted from Abies numidica leaves, evaluate its biological activities and characterize its chemical composition using LC–MS/MS analysis.
2 Material and methods
2.1 Reagents and chemicals
1,1′ Diphenyl-2-Picrylhydrazyl (DPPH), butylatedhydroxylanisole (BHA), butylatedhydroxyltoluene (BHT), α- tocopherol, ascorbic acid, neocuproine, 2,2′ azino-bis (3-ethylbenzothiazoline-6-sulfonicacid) diammonium salt (ABTS), dimethylsulfoxyde (DMSO).
2.2 Collection and preparation of plant material
Leaves of Algerian fir were collected from Constantine, they were harvested randomly from branches during the month of September 2018, after which they were dried for 15 days in the dark at room temperature. The samples were powdered using manual grinder IKIa10 type and kept in a dry, dark place until they were used.
2.3 Extraction of secondary metabolites
The extraction process was carried out according to the protocol described by Boudjada et al. (2017) with minor modification. The dried extract was weighed to determine the percentage yield of the soluble constituents using the following formula:
2.4 Phytochemical screening
Preliminary phytochemical screening was carried out for EAF according to the protocol assessed by Cavé (1993).
2.5 Determination of bioactive compounds in A. numidica leaves
2.5.1 Determination of total phenolics content
The amount of total phenolics (TPC) was determined by the method of (Singleton and Rossi, 1965) using Folin-Ciocalteu as reagent (FCR). The absorbance of the resulting color was measured at 765 nm using microplate reader. The TPC was determined from the linear equation of a standard curve prepared with Gallic acid and was expressed in mg per g of dry extract (Gülçin et al., 2020).
2.5.2 Determination of total flavonoids content
Total flavonoids content (TFC) was determined by aluminum chloride colorimetric assay adopted from Topçu et al. (2007) method with slight modifications. The absorbance was measured at 415 nm. The total flavonoids content was obtained using calibration curve of quercetin and was expressed as mg of quercetin equivalence per gram of dry extract (Gülçin et al., 2020).
2.6 Antioxidant activity
2.6.1 DPPH• Radical scavenging activity
The DPPH• free radical scavenging assay was performed according to Blois,(1958) and Tel et al.(2012) methods with some modifications. BHT, BHA were used as standards. Reduction of DPPH• radical in percent (R %) was calculated in following way:
Ablank: absorbance of control reaction. A sample: absorbance of test sample.
2.6.2 ABTS•+ radical scavenging assay
This anti-radical activity was measured using a cation decolorisation assay as described by Re et al. (1999). The antioxidant standards were BHT and BHA. The inhibition percentage was calculated the same as described in DPPH• radical assay.
2.6.3 Reducing power assay
The reducing power ability of the extract was performed using the method of Oyaizu, (1986) with minor modifications. The reducing power ability of the sample is determined by increase in absorbance of the sample. Ascorbic acid, tannic acid and α-tocopherol were used as standards for comparison.
2.6.4 CUPRAC assay (cupric reducing antioxidant capacity)
Cupric ion reducing capacity was measured in accordance to the method of Apak et al. (2007). BHA and BHT were used as standards.
2.6.5 Sun protection factor activity (SPF)
Sun protection factor activity was determined according to the method described by Mansur et al. (1986). The absorbances were measured at different wavelenghts starting with 290 nm to 320 nm, each 5 nm. These waves enhance the production of reactive oxygen species, and the SPF was calculated by applying the below mathematic equation:
EE: erythemal effect spectrum; I: solar intensity spectrum; Abs: absorbance of sun screen product; CF: correction factor (=10). EE* I: is a constant determined by Sayre et al. (1979).
2.7 Antibacterial activity
The antibacterial assay was carried out according to Biondi et al. (1993) method, with minor modifications, using disc diffusion, against 6 human pathogenic bacteria strains including Gram positive and Gram negative; obtained from Pasteur institute, Algiers, Algeria. The antibacterial activity was determined by measuring the inhibition zone surrounding the discs. Each experiment was done in triplicate. The negative control was DMSO and 8 antibiotics discs were used as positive controls (Table 1).
| Inhibition zone (mm) | ||||||
|---|---|---|---|---|---|---|
| Extracts | Gram (+) bacteria | Gram (−) bacteria | ||||
| B. subtillis (ATCC 6633) | S. aureus (ATCC 43300) | E. coli (ATCC 25922) | P. aeruginosa (ATCC 27853) | M. morganii (ATCC 25830) | P. vulgaris (ATCC 29905) | |
| EAa (10 µl/disc) | 24,5 ± 0,70 | 22 ± 0,00 | 19,66 ± 0,57 | 24 ± 0,0 | 20 ± 1,00 | 20,33 ± 0,57 |
| OXb | Nt | Na | Nt | Nt | Nt | Nt |
| CDb | Na | Nt | Nt | Nt | Nt | Nt |
| CIPb | 27 | Nt | Nt | 30 | Nt | Nt |
| Eb | Na | 22 | Nt | Nt | Nt | Nt |
| Pib | Nt | Nt | 18 | Nt | Na | Na |
| Cb | Nt | 28 | Nt | Nt | Nt | 25 |
| AKb | Nt | Nt | 28 ± 1 | 24 | 27 | Nt |
| PRLb | Nt | Nt | Na | Na | Na | Na |
Na: Not active ; Nt: Not tested.
2.8 Identification and quantification of polyphenols by LC–MS/MS analysis
The chemical profile by LC–MS/MS analysis was obtained according to the method described by Akdeniz et al. (2018). The LC–MS/MS system used for the quantitative and qualitative analysis of 15 phytochemicals consists of Shimadzu Nexera model UHPLC coupled to Shimadzu LCMS 8040 model triple quadrupole mass spectrometer. The liquid chromatograph composed of LC-30 AD model gradient pump, DGU-20A3R model degasser, CTO-10ASvp model column oven and SIL-30AC model autosampler. The chromatographic separation was performed on an Agilent Poroshell 120 model (EC-C18 2.7 µm, 4.6 mm × 150 mm) column.
2.9 Statistical analysis
The results are presented as the mean of three replications. Regression analysis was carried out by best fit method and IC50 values were calculated using regression equation. The significance of results was checked at P < 0.0001 using ANOVA test.
3 Results
3.1 Extraction yield and phytochemical screening
The yield of crude methanolic extract was 6, 56% using the previous formula, and the yield of EAF was estimated by 0.35%. The preliminary phytochemical screening tests showed that this fraction was rich in flavonoids and tannins, anthocyans were found in traces. However, alkaloids, coumarins, aponosides and tri-terpens were absent.
3.2 Total phenolics (TPC) and total flavonoids content (TFC)
For TPC and TFC, results revealed that EAF was very rich in phenolic and flavonoid compounds. The amount of TPC and TFC reached to 490.76 ± 6.65 mg GAE/g extract and 143.19 ± 5.59 mg QE/g extract respectively.
3.3 Antioxidant activities
3.3.1 DPPH scavenging assay
The potential antioxidant activity of EAF was evaluated on the basis of its ability to scavenge stable free radicals by donating an electron or hydrogen (Sasikumar and Kalaisezhiyen, 2014). The IC50 was determined from different concentrations tested. The extract which has a lower IC50, presented a high antioxidant activity (Brighente et al., 2007). According to the results presented in Fig. 1, this fraction showed a powerful antioxidant activity in DPPH• scavenging assay with IC50 value which is lower compared with standards used BHT and BHA (Table 2).
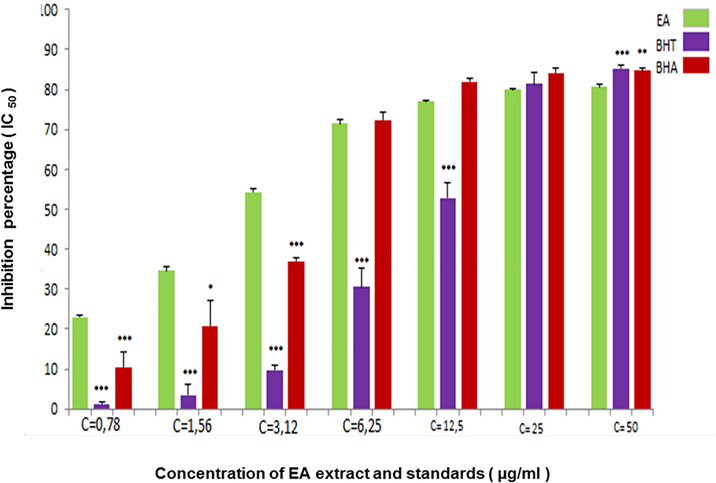
- DPPH radical scavenging activity of EAF extracted from A. numidica leaves at different concentrations (*** P < 0.0001).
| Antioxidant activity | |||||
|---|---|---|---|---|---|
| Extract and standards (0,25 µg/ml) | DPPH assay IC50 µg/mL | ABTS assay IC50 µg/mL | Reducing power assay A0,5 µg/mL | CUPRAC assay A0,5 µg/mL | SPF |
| EAF | 3.07 ± 0.12 | 2.11 ± 0.09 | 6.26 ± 2.02 | 4.10 ± 0,93 | 48.37 ± 0, 51 |
| BHT | 6.55 ± 0.59 | 1.55 ± 0.26 | – | 3,44 ± 0,04 | – |
| BHA | 15.74 ± 0.47 | 7.54 ± 0.67 | – | 1,34 ± 0,11 | – |
| Ascorbic acid | – | – | 6.77 ± 1.15 | – | – |
| Tannic acid | – | – | 5.39 ± 0.91 | – | – |
| Alpha-tocopherol | – | – | 34.93 ± 2.38 | – | – |
3.3.2 ABTS•+ radical scavenging assay
For ABTS• + radical scavenging assay, the addition of an antioxidant molecules reduce ABTS•+ free radicals by donating an electron (Pratapchandran et al., 2013) and decolorize the solution that was determined as the percentage of inhibition (Re et al., 1998). The results in Fig. 2 showed a strong antioxidant activity of EAF in ABTS• + assay where IC50 was near to the value of IC50 presented by BHT standard and more effective compared with BHA standard IC50 (Table 2).
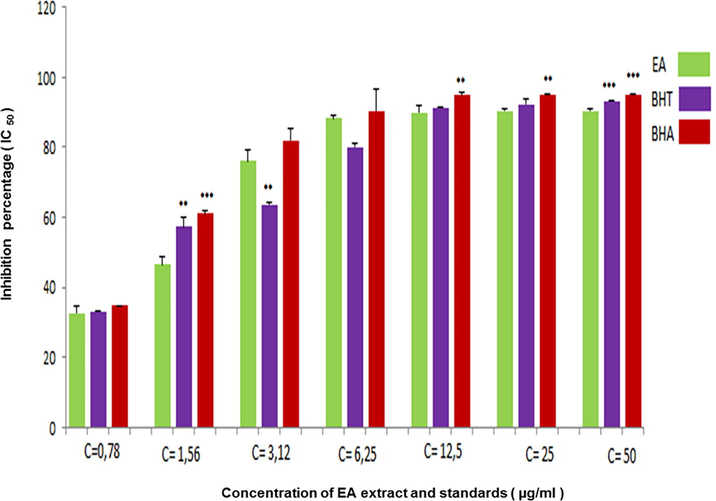
- Inhibition percentage in ABTS assay by EAF extracted from A. numidica leaves at different concentrations (*** P < 0.0001).
3.3.3 Reducing power assay
The reducing power activity is developed to determine the ferric reducing ability of bioactive substances (Pulido et al., 2000). Yildirim et al. (2001) reported that the reducing power of natural molecules is associated with antioxidant activity. Thus, this activity is proportional to the amount of the extract used. Findings of our research (Fig. 3) showed a high reducing power antioxidant assay that seems in A0.5 (µg/ml) value of the EAF tested which is near to Tannic acid and Ascorbic acid standards values examined, however it presented a potential activity compared with α- tocopherol (Table 2).
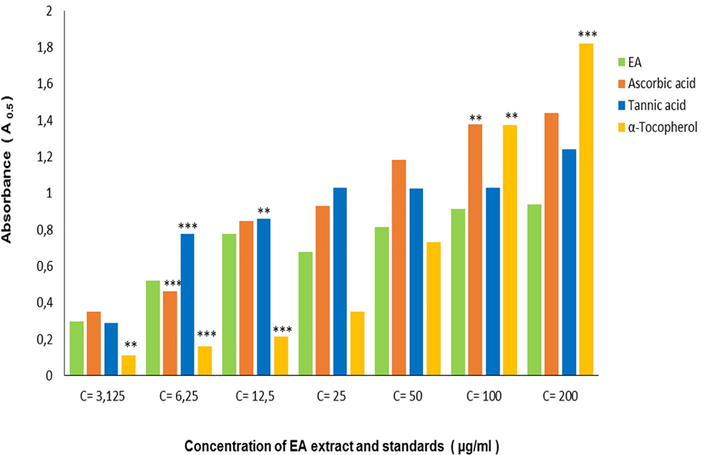
- Inhibition percentage in Reducing power assay by EAF extracted from A. numidica leaves at different concentrations (***P < 0.0001).
3.3.4 CUPRAC assay
Results in Fig. 4 showed that EAF of A. numidica leaves has a mild CUPRAC antioxidant test, the A0.5 (µg/ml) of the extract is near to the value obtained using BHT as standard, but it has a weak activity compared with BHA A0.5 (Table 2).
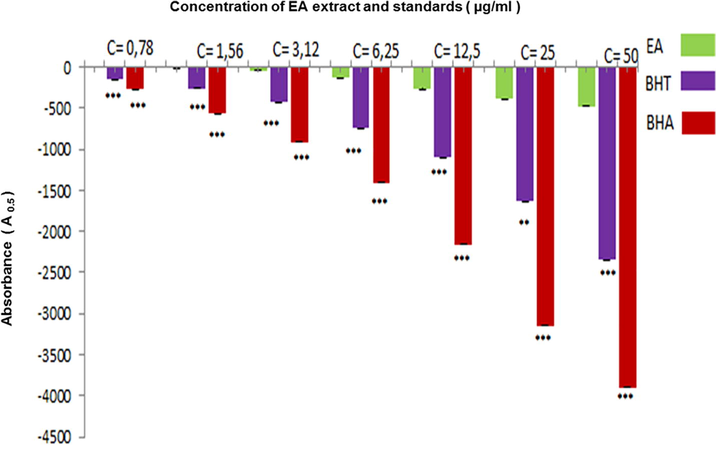
- Inhibition percentage in CUPRAC assay by EAF extracted from A. numidica leaves at different concentrations (***P < 0.0001).
3.3.5 Sun protection factor
For SPF, the results showed that EAF had a high SPF (Table 2). According to the recommendation of the Commission of European Communities (2006), the EAF belongs to the category of high protection (30–49.9).
3.4 Antibacterial activity
EA extract was investigated to evaluate the antibacterial activity against pathogenic bacterial strains using disc diffusion method. Results were recorded in Table 1, revealed that this extract was potentially effective in suppressing all bacterial growth at lower concentration, and the inhibition diameter ranged from 19 to 24.5 mm.
3.5 LC–MS/MS analysis of EAF extracted from A. numidica leaves
Fig. 5 showed the chemical profile of EAF obtained by LC–MS/MS analysis and Table 3 showed the quantitavie amounts of different flavonoids present in this extract. 12 compounds were identified in EA extract among 15 phytochemical standards used, based on their MS fragmentation patterns, high-resolution mass, UV-spectra and retention time. Quantification was performed for all of the identified compounds. The major components with high amounts were flavonols which are astragalin and hyperoside followed by quercitrin found also at high amount, but quercetin was determined in low quantity. Five flavones were also detected which are apigetrin, luteoline-7-glucoside, rutin, apigenin and luteolin where apigenin and luteolin were found in traces. One flavanone called hesperidin was also found. Two phenolic acids were determined which are: protocatechic acid and chlorogenic acid. However three flavonoids were not determined (pseudohypericin, hyperforin and hypericin).
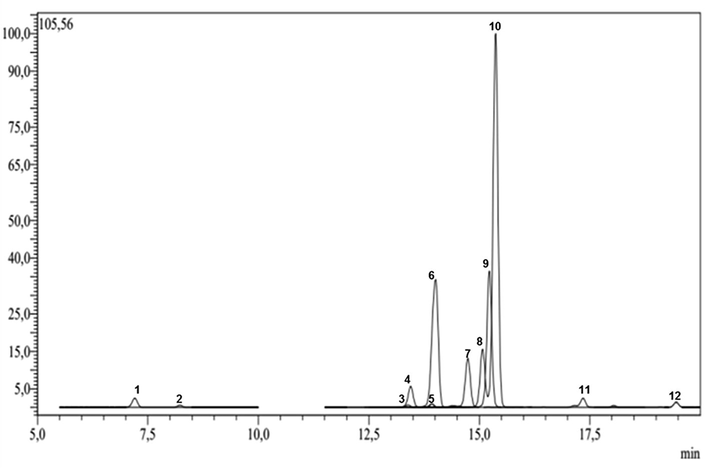
- LC–MS/MS chemical profile of EAF extracted from Abies numidica leaves.
| No | Analytes | Retention Timea | EAF (µg/g) |
|---|---|---|---|
| 1 | Protocatechuic acid | 7.00 | 71,62 |
| 2 | Chlorogenic acid | 8.03 | 15,59 |
| 3 | Luteolin-7-glucoside | 13.20 | 43,17 |
| 4 | Rutin | 13.67 | 27,58 |
| 5 | Hesperidin | 13.68 | 7,83. |
| 6 | Hyperoside | 13.69 | 3370,96 |
| 7 | Apigetrin | 14.54 | 192,56 |
| 8 | Quercitrin | 14.98 | 2300,33 |
| 9 | Astragalin | 15.13 | 3391,36 |
| 10 | Quercetin | 17.10 | 24,75 |
| 11 | Luteolin | 17.78 | 2,41 |
| 12 | Apigenin | 19.20 | 6,64 |
| 13 | Pseudohypericin | 26.34 | N.D. |
| 14 | Hyperforin | 28.97 | N.D. |
| 15 | Hypericin | 30.18 | N.D. |
4 Discussion
Different assays were used to evaluate the antioxidant effect of EAF due to the complex nature of secondary metabolites found in plants and in order to confirm if this extract is powerful as an antioxidant. The results of the antioxidant tests obtained by the above described chemical methods revealed that EA extract has a potential antioxidant activity. It exhibited a significant DPPH, ABTS, reducing power and CUPRAC activities due to the presence of phenolics and flavonoids with high quantities which are known to quench free radicals (Onyebuchi et al., 2015). They have the capacity to react directly with reactive oxygen species to form phenoxyl radicals which are stable and stop the chain reactions (Xia et al., 2010).
In this work, we investigated also the sun protection factor activity of this endemic plant. The results revealed that this fraction represents a remarkable effect according to the different categories of protection presented by the recommendation of the Commission of European Communities, 2006. We suggest that this extract is rich in phenolic products that deemed as multi-active components. It is well known that many flavonoids provide protection against sunlight irradiations (Saewan and Jimtaisong, 2013). This fraction contains a wide range of natural molecules that usually cover full range of UV wavelengths (Ebrahimzadeha et al., 2014). Furthermore, flavonoids due to their structure which is rich in hydroxyl groups, they presented an effective reactive oxygen species scavenging power (Kenjale et al., 2007) and their ability to chelate metals at the active site of metaloenzymes (Ribeiro et al., 2015) present a pigment reducing action and protect skin, furthermore, some flavonoids were used in skin lightening preparations.
Also, EA extract was investigated to evaluate the antibacterial activity against pathogenic bacterial strains. It has been reported that polyphenols and flavonoids have an anti-microbial activity (Shan et al., 2007). Many researchers suggested that antibacterial effect of plant extracts resulted of the interaction of this extract with strains cell proteins lead to cell death (Mostafa et al., 2018). The potential biological activities of this extract might be the result of the synergistic effect of the major flavonoids found in high amounts and the interactions between them due to their structure.
According to qualitative phytochemical analysis results above indicated that EAF has potential biological activities, for that, it is necessary to address this fraction to suitable techniques for identifying its chemical constituents. To get a deeper insight into the chemical composition of the plant extracts LC–MS/MS analysis is considered as powerful analytical tool (Han et al., 2018). The basis of identification was comparison with the standards and retention time. From the LC–MS/MS analysis of EAF results presented in Table 2 revealed the presence of 12 compounds among 15 phytochemical standards used. According to LC–MS/MS analysis results, the major components are astragalin, hyperoside and quercitrin that act as reducing agents. Riaz et al. (2018) reported that astragalin is well known for its multiple pharmaceutical activities including antioxidant; it acts as free radical scavenger, electron donor, chelator of metals, anti-inflammatory, anti-cancer effects. Liu et al. (2015) defined quercitrin as a flavonoid compound that has important antioxidant and antibacterial effects. These compounds in EAF might be responsible for the antioxidant and antibacterial effects.
5 Conclusion
In conclusion, we investigated the antioxidant and antibacterial activities of EAF, we determined the chemical composition in flavonoids by LC–MS/MS analysis. EAF was rich in flavonoids and tannins (phytochemical screening). The quantitative determination showed that EAF was rich in total phenolics and total flavonoids. This extract revealed a significant antioxidant capacity at low concentration; it exhibited a strong antibacterial inhibition activity. LC–MS/MS analysis disclosed that this fraction was wealthy in Astragalin, Hyperoside followed by Quercitrin. However, further studies are needed to isolate these bioactive molecules and subject them to other biological activities.
Acknowledgement
The authors wish to thank Algerian Ministry of Higher Education and Scientific Research and the General Directorate of Scientific Research and Technological Development, Algeria for financial support.
Declaration of Competing Interest
The authors declare that they have no known competing financial interests or personal relationships that could have appeared to influence the work reported in this paper.
References
- Screening of Chemical Content Specific to Hyperıcum Species Growing In Different Parts of Turkey by LC-MS/MS and Method Validation; Investigation Of Their Biological Activities And Chemometric Evaluation. Diyarbakır: Dicle University Institute of Science Department of Chemistry; 2018. [Dessertation]
- Mechanism of antioxidant capacity assays and the CUPRAC (cupric ion reducing antioxidant capacity) assay. Microchim. Acta. 2007;160:413-419.
- [Google Scholar]
- Antimicrobial activity and chemical composition of essential oils from Sicilian aromatic plants. Flavour Frag.. 1993;J.8:331-337.
- [Google Scholar]
- Antioxidant determinations by the use of stable free radical. Nature. 1958;4617(181):1119-1200.
- [Google Scholar]
- Interactive antimicrobial and toxicity profiles of Pittosporum Angustifolium L odd. Extracts with conventional antimicrobials. J. Integr. Med.. 2019;17(4):261-272.
- [Google Scholar]
- Phytochemical constituents, phenolic contents, and antioxidant activity of Crataegus azarolus extracts. Asian J. Pharm. Clin. Res.. 2017;11(4):133-137.
- [Google Scholar]
- Antioxidant activity and total phenolic content of some Brazilian species. Pharm. Biol.. 2007;45(2):156-161.
- [Google Scholar]
- Cavé, A.,1993. Pharmacognosy, phytochemistery, medicinal plants. 2nd Ed. Tec. Et Doc Ed lavoisier, Paris. pp. 274-285.
- [EC] Commission of European Communities. Recommendation of. 22 September 2006. On sun screen products and manufacturers claims. https://eur-lex.europa.eu ›.
- Correlation between sun protection factor and antioxidant activity, phenol and flavonoid contents of some medicinal plants. Iran J Pharm Res.. 2014;13(3):1041-1047.
- [Google Scholar]
- Antioxidants and antioxidant methods: an updated overview. Arch. Toxicol.. 2020;94(3):651-715.
- [Google Scholar]
- Gülçin, İ., Gören, A.C., Taslimi, P., Alwasel, S.H., Kılıc, O., Bursal, E., 2020. Anticholinergic, antidiabetic and antioxidant activities of Anatolian pennyroyal (Mentha pulegium)-analysis of its polyphenol contents by LC-MS/MS. 23(2020), 101441.
- Antioxidant Activity of Flaxseed (Linum usitatissimum Linum usitatissimum L.) shell and Analysis of Its Polyphenol Contents by LC-MS/MS. Rec. Nat. Prod.. 2018;12(4):397-402.
- [Google Scholar]
- Anti-stress and anti-oxidant effects of roots of Chlorophytum borivilianum (Santa Pau and Fernandes) Indian J. Exp. Biol.. 2007;45:974-979.
- [Google Scholar]
- Quercitrin, an inhibitor of sortase a, interferes with the adhesion of Staphylococcal aureus. Molecules. 2015;20:6533-6543.
- [Google Scholar]
- Determination of the factor of solar protection by spectrophotometry. An. Bras. Dermatol. Rio de Janeiro.. 1986;61:121-124.
- [Google Scholar]
- Antimicrobial activity of some plant extracts against bacterial strains causing food poisoning diseases. Saudi J. BiolSci.. 2018;25:361-366.
- [Google Scholar]
- Antioxidant, total phenolic and flavonoid content of selected Nigerian medicinal plants. Daka Univ. J. Pharm. Sci.. 2015;14(1):35-41.
- [Google Scholar]
- Studies on products of browning reactions: antioxidative activities of browning reaction prepared from glucosamine. Japan. J. Nutr.. 1986;44:307-315.
- [Google Scholar]
- In vitro free radical scavenging activity of aqueous extracts of Aegle Tamiladensis Abdul Kader (Rutaceae) Int. J. Pharm. Pharm. Sci.. 2013;5(3):819-823.
- [Google Scholar]
- Antioxidant activity of dietary polyphenols as determined by a modified ferric reducing/antioxidant power assay. J. Agric. Food Chem.. 2000;48:3396-3402.
- [Google Scholar]
- Antioxidant activity applying an improved abts radical cation decolorization assay. Free Radic. Biol. Med.. 1998;26:1231-1237.
- [Google Scholar]
- Antioxidant activity applying an improved ABTS radical cation decolorization assay. Free Radic. Biol. Med.. 1999;26:1231-1237.
- [Google Scholar]
- Main benefits and applicability of plant extracts in skin care products. J Cosmet.. 2015;2:48-65.
- [Google Scholar]
- Astragalin: a bioactive phytochemical with potential therapeutic activities. Adv. Pharmacolsci. 2018:1-15.
- [Google Scholar]
- Evaluation of free radical scavenging activity of various leaf extracts from Kedrostis foetidissima (Jacq.) Cogn. Biochem. Anal. Biochem.. 2014;3(2):1-7.
- [Google Scholar]
- Comparison of in vivo and in vitro testing of sun screening formulas. J. Photochem. Photobiol.. 1979;29(3):559-566.
- [Google Scholar]
- The in vitro antibacterial activity of dietary spice and medicinal herb extracts. Int. J. Food Microbiol.. 2007;117:112-119.
- [Google Scholar]
- Colorimetry of total phenolics with phosphomolybdic-phosphotungstic acid reagents. J. Enol. Vitic.. 1965;16:144-158.
- [Google Scholar]
- Extraction and recovery of phytochemical components and antioxidative properties in fruit parts of Dacryodes rostrata influenced by different solvents. J. Food Sci. Technol.. 2018;55(7):2523-2532.
- [Google Scholar]
- Antioxidant and cholinesterase inhibition activities of three Tricholoma species with total phenolic and flavonoid contents: the edible mushrooms from Anatolia. Food Anal. Methods. 2012;5:495-504.
- [Google Scholar]
- A new flavone from antioxidant extracts of Pistacia terebinthus. Food Chem.. 2007;103:816-822.
- [Google Scholar]
- Biological activities of polyphenols from grapes. Int. J. Mol. Sci.. 2010;11:622-646.
- [Google Scholar]
- Determination of antioxidant and antimicrobial activities of Rumex crispus L. extracts. Jagr. Food Chem.. 2001;49:4083-4089.
- [Google Scholar]


